| Param | Original file | Final file |
|---|---|---|
| Filename | modeM0/AS1A10_053T39_9000004596_31525cztM0_level2.evt | modeM0/AS1A10_053T39_9000004596_31525cztM0_level2_quad_clean.evt |
| Size (bytes) | 619,355,520 | 105,949,440 |
| Size | 590.7 MB | 101.0 MB |
| Events in quadrant A | 3,806,884 | 699,410 |
| Events in quadrant B | 5,320,235 | 708,881 |
| Events in quadrant C | 4,896,206 | 684,292 |
| Events in quadrant D | 4,298,900 | 667,129 |
| Mode SS | |||
|---|---|---|---|
| Quadrant | BADHDUFLAG | Total packets | Discarded packets |
| A | 0 | 134 | 0 |
| B | 0 | 134 | 0 |
| C | 0 | 134 | 0 |
| D | 0 | 134 | 0 |
| Mode M9 | |||
|---|---|---|---|
| Quadrant | BADHDUFLAG | Total packets | Discarded packets |
| A | 0 | 24 | 0 |
| B | 0 | 24 | 0 |
| C | 0 | 24 | 0 |
| D | 0 | 24 | 0 |
| Mode M0 | |||
|---|---|---|---|
| Quadrant | BADHDUFLAG | Total packets | Discarded packets |
| A | 0 | 15547 | 2 |
| B | 0 | 20135 | 2 |
| C | 0 | 18965 | 3 |
| D | 0 | 17008 | 2 |
| Quadrant | Total seconds | Saturated seconds | Saturation percentage |
|---|---|---|---|
| A | 6432 | 169 | 2.627488% |
| B | 6433 | 144 | 2.238458% |
| C | 6432 | 382 | 5.939055% |
| D | 6432 | 146 | 2.269900% |
Noise dominated data is calculated using 1-second bins in cleaned event files. If a bin has >2000 counts, and if more than 50% of those come from <1% of pixels, then it is considered to be noise-dominated and hence unusable.
| Quadrant | # 1 sec bins | Bins with >0 counts | Bins with >2000 counts | High rate bins dominated by noise | Noise dominated (total time) | Noise dominated (detector-on time) | Marked lightcurve |
|---|---|---|---|---|---|---|---|
| A | 8852 | 6432 | 76 | 76 | 0.86% | 1.18% | 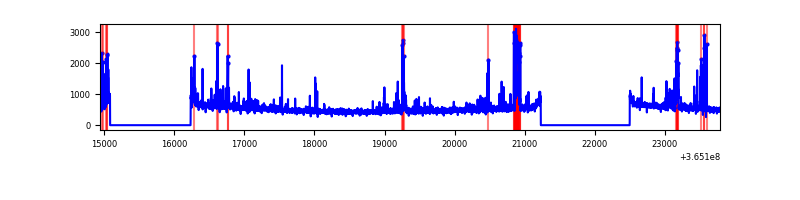 |
| B | 8853 | 6433 | 2 | 2 | 0.02% | 0.03% | 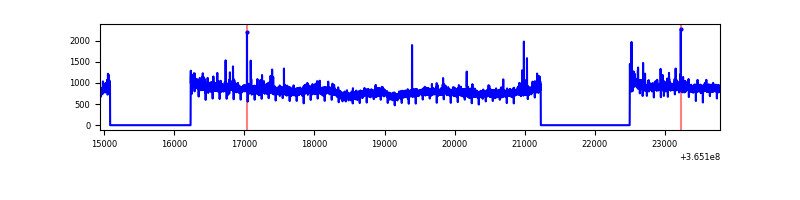 |
| C | 8852 | 6432 | 42 | 42 | 0.47% | 0.65% | 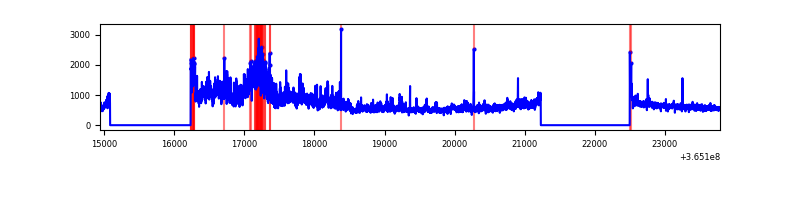 |
| D | 8852 | 6433 | 45 | 45 | 0.51% | 0.70% | 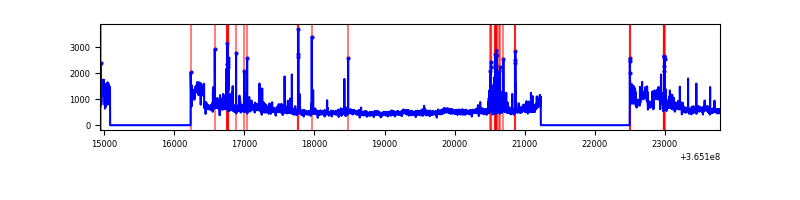 |
Top three noisy pixels from each quadrant. If the there are fewer than three noisy pixels in the level2.evt file, extra rows are filled as -1
| Pixel properties | Quadrant properties | ||||||
|---|---|---|---|---|---|---|---|
| Quadrant | DetID | PixID | Counts | Sigma | Mean | Median | Sigma |
| A | 0 | 13 | 493089 | 2864.81 | 859 | 844 | 171.8 |
| A | 13 | 254 | 11497 | 62.0 | 859 | 844 | 171.8 |
| A | 3 | 137 | 8281 | 43.28 | 859 | 844 | 171.8 |
| B | 6 | 159 | 1791412 | 10878.91 | 866 | 847 | 164.6 |
| B | 4 | 80 | 66070 | 396.27 | 866 | 847 | 164.6 |
| B | 0 | 190 | 22249 | 130.03 | 866 | 847 | 164.6 |
| C | 3 | 233 | 1426414 | 7245.64 | 842 | 851 | 196.7 |
| C | 14 | 238 | 134338 | 678.47 | 842 | 851 | 196.7 |
| C | 2 | 114 | 15143 | 72.64 | 842 | 851 | 196.7 |
| D | 8 | 195 | 801564 | 4030.61 | 844 | 823 | 198.7 |
| D | 2 | 250 | 112765 | 563.47 | 844 | 823 | 198.7 |
| D | 13 | 249 | 57116 | 283.36 | 844 | 823 | 198.7 |
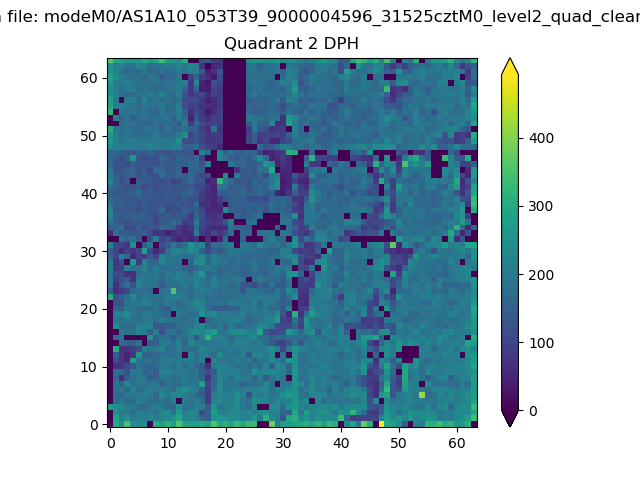
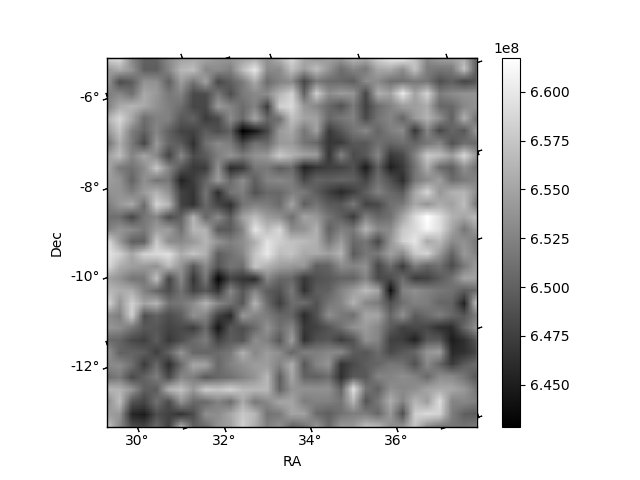
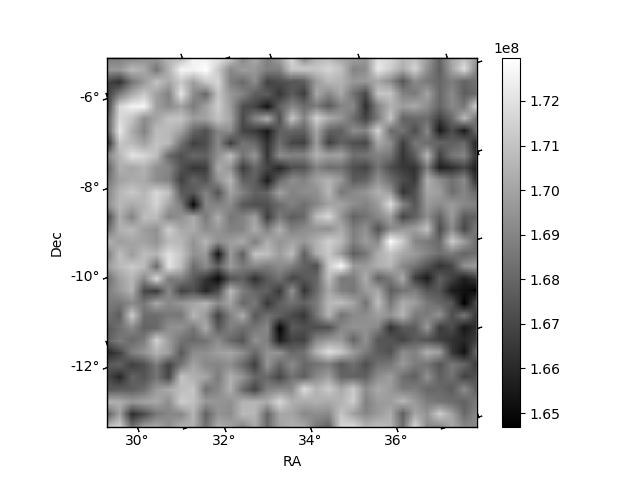
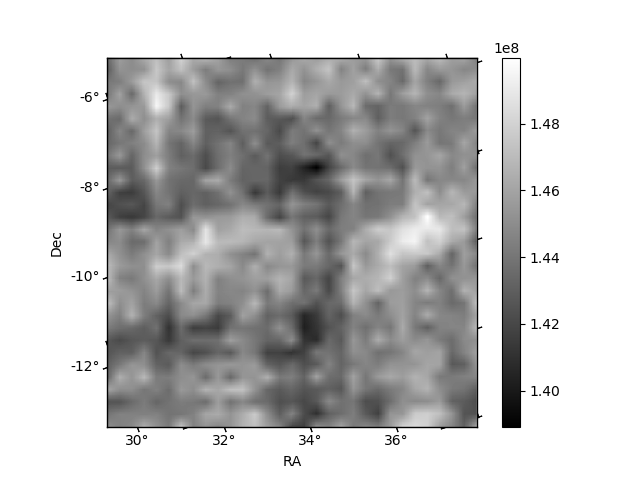
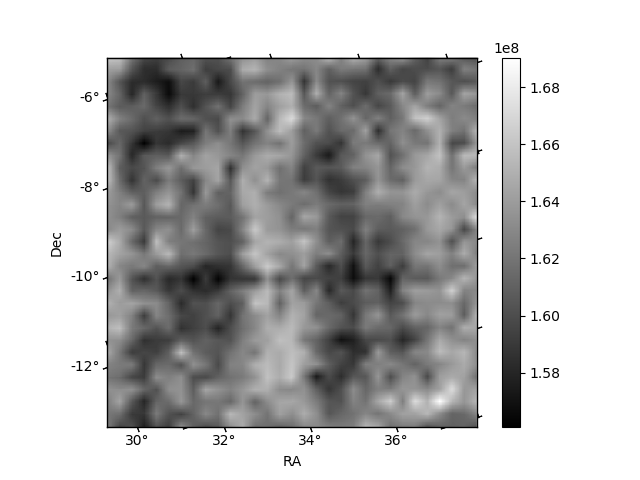
Histogram calculated using DETX and DETY for each event in the final _common_clean file
| Quadrant A | 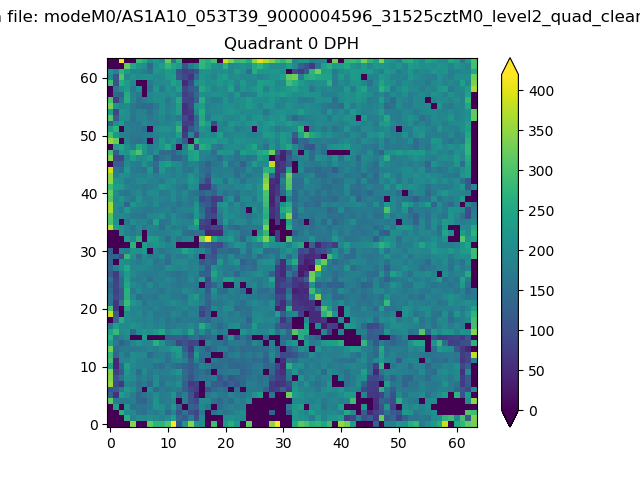 |
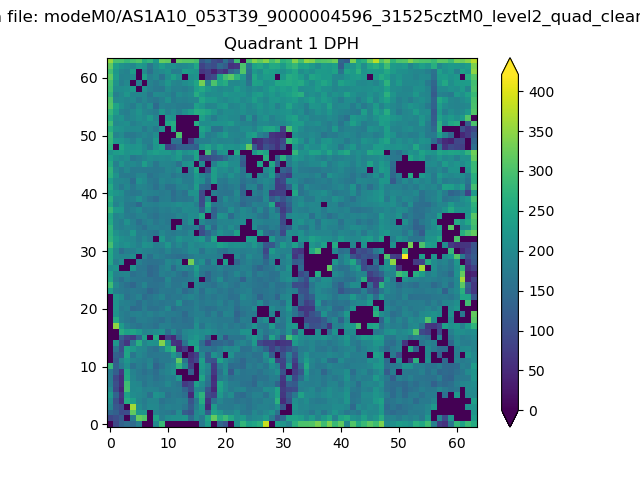 |
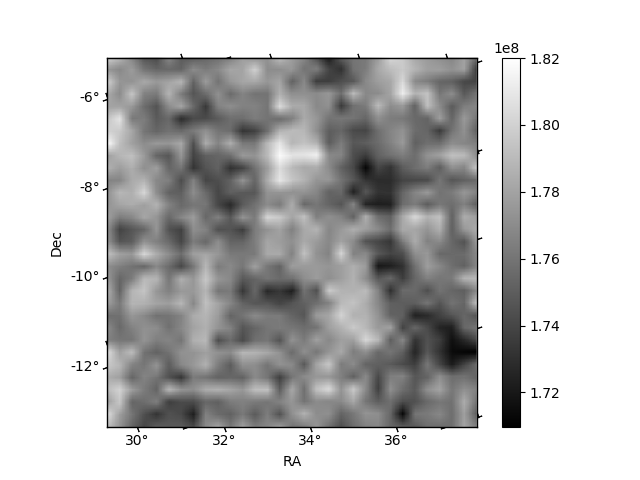
Quadrant B |
|---|---|---|---|
| Quadrant D | 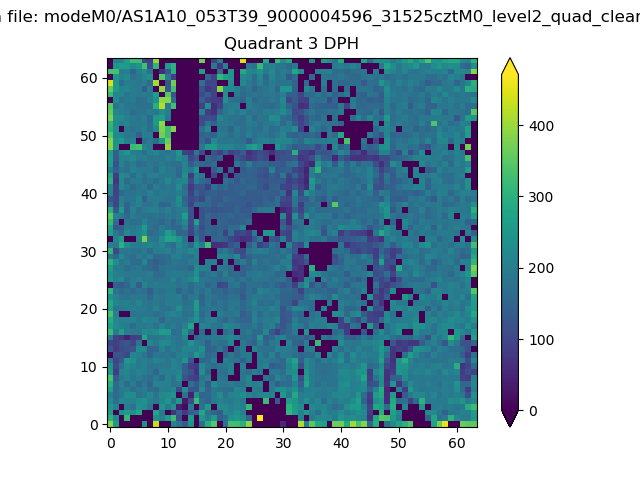 |
 |
Quadrant C |
| Plot type | Count rate plots | Images |
|---|---|---|
| Comparison with Poisson distribution Blue bars denote a histogram of data divided into 1 sec bins. Red curve is a Poisson curve with rate = median count rate of data. |
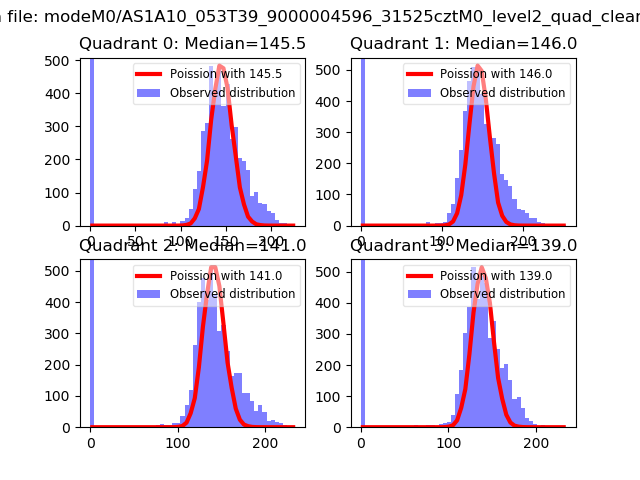 |
 |
| Quadrant-wise count rates Data is divided into 100 sec bins |
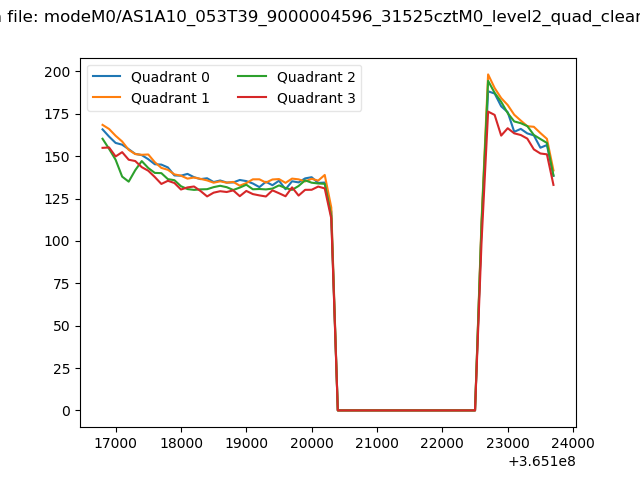 |
|
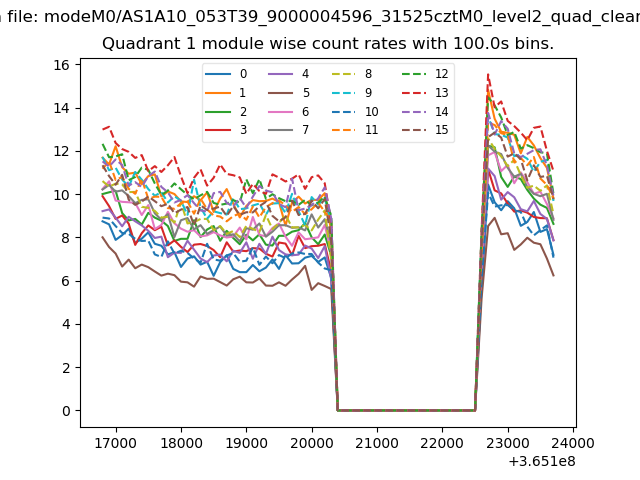
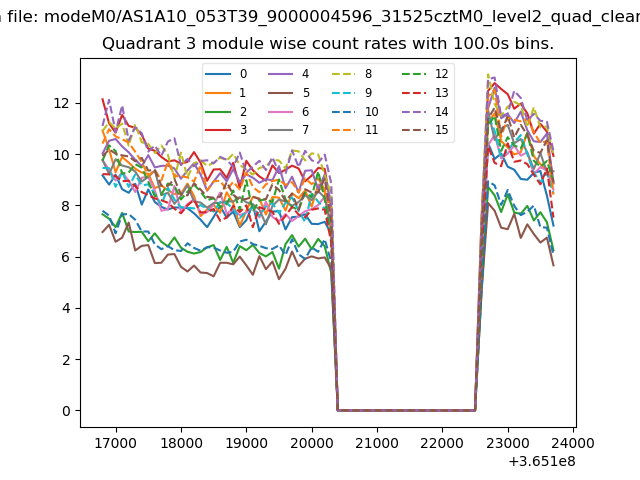
| Module-wise count rates for Quadrant A Data is divided into 100 sec bins |
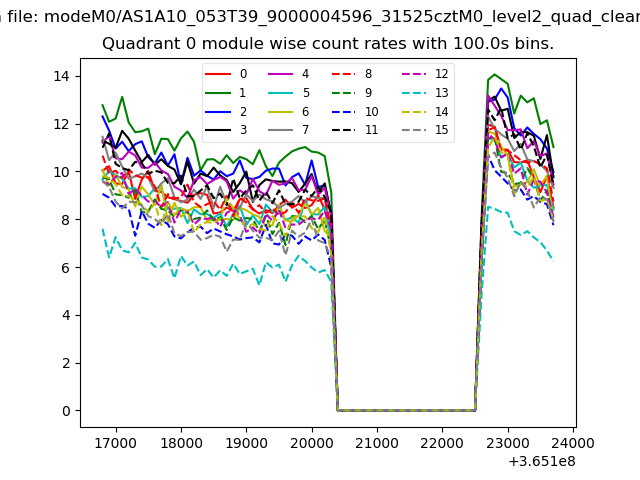 |
 |
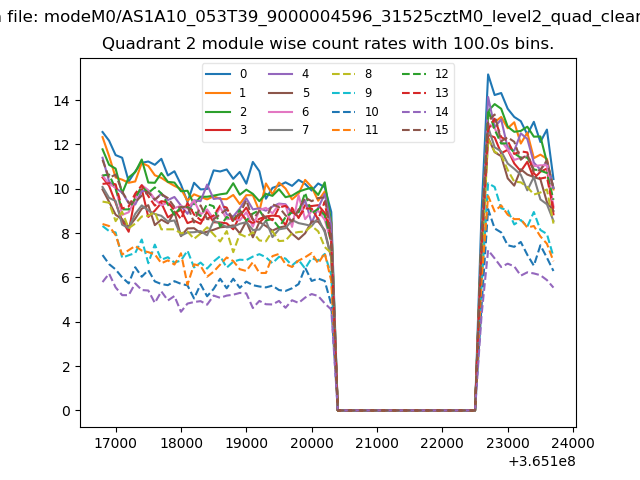
| Module-wise count rates for Quadrant B Data is divided into 100 sec bins |
 |
 |
| Module-wise count rates for Quadrant C Data is divided into 100 sec bins |
 |
 |
| Module-wise count rates for Quadrant D Data is divided into 100 sec bins |
 |
 |
| Parameter | Plot |
|---|---|
| CZT HV Monitor | 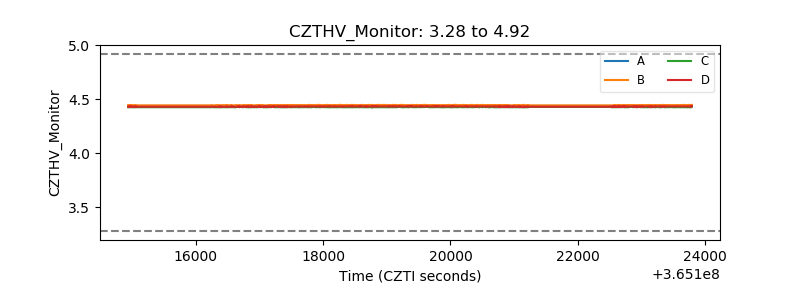 |
| D_VDD | 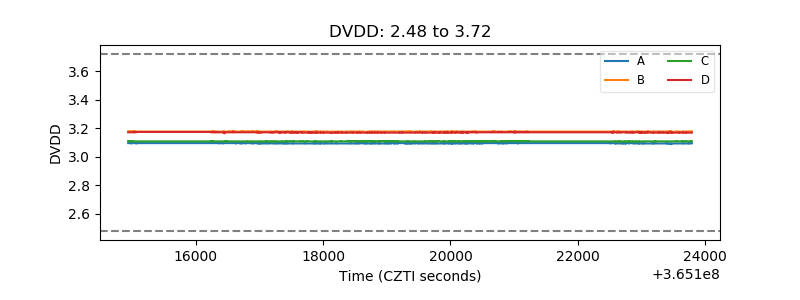 |
| Temperature 1 | 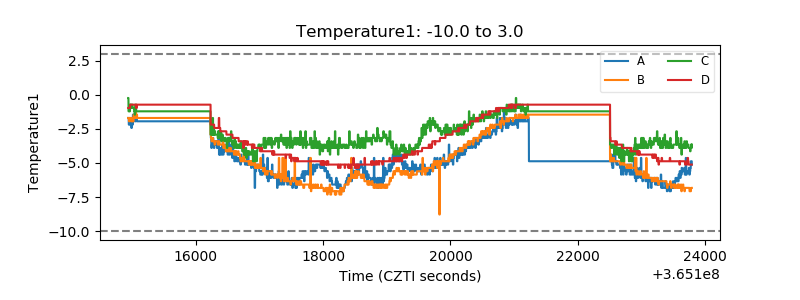 |
| Veto HV Monitor | 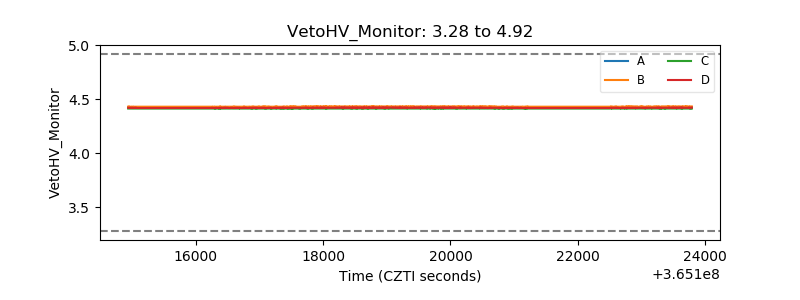 |
| Veto LLD | 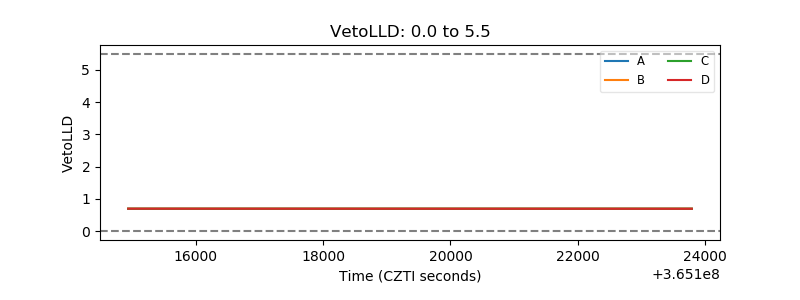 |
| Alpha Counter | 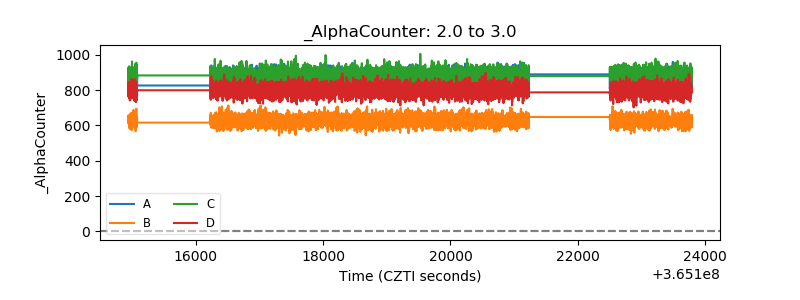 |
| _CPM_Rate | 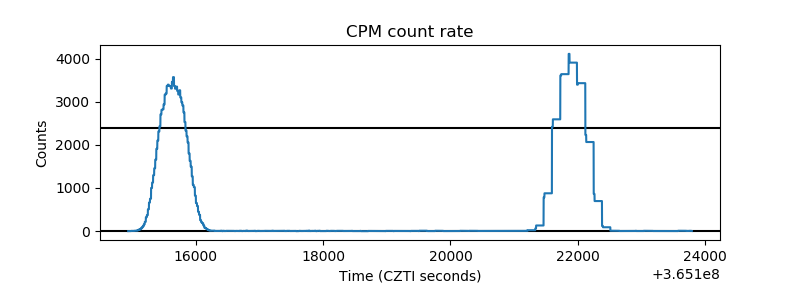 |
| CZT Counter | 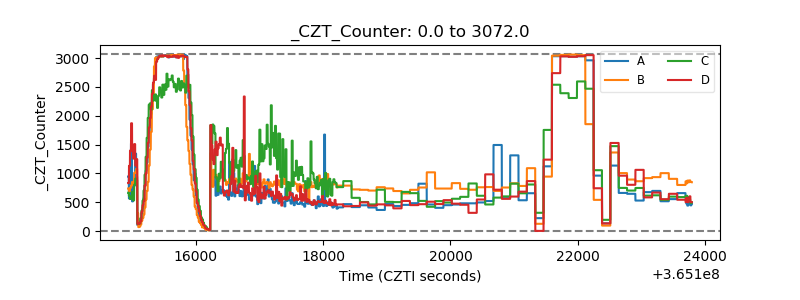 |
| +2.5 Volts monitor |  |
| +5 Volts monitor |  |
| _ROLL_ROT | 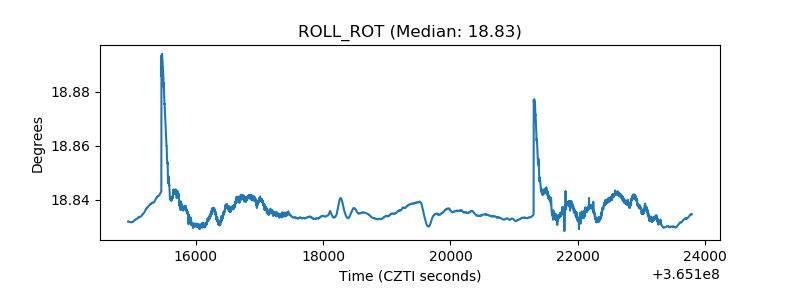 |
| _Roll_DEC | 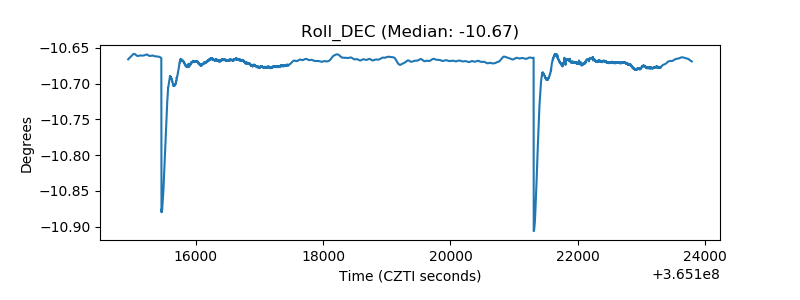 |
| _Roll_RA | 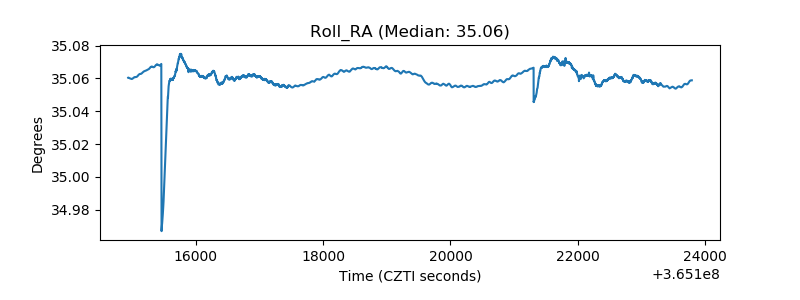 |
| Veto Counter | 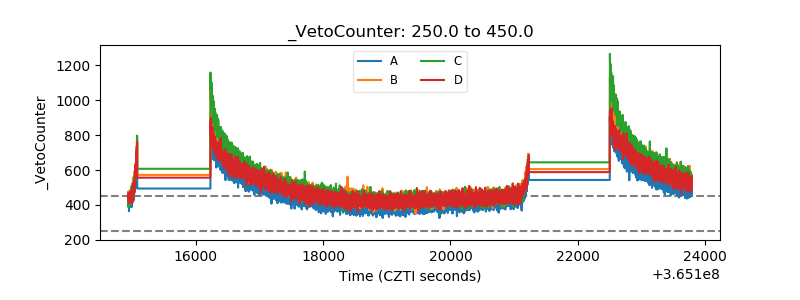 |