| Param | Original file | Final file |
|---|---|---|
| Filename | modeM0/AS1A10_053T39_9000004596_31526cztM0_level2.evt | modeM0/AS1A10_053T39_9000004596_31526cztM0_level2_quad_clean.evt |
| Size (bytes) | 564,606,720 | 114,632,640 |
| Size | 538.5 MB | 109.3 MB |
| Events in quadrant A | 3,610,846 | 761,173 |
| Events in quadrant B | 5,169,155 | 783,716 |
| Events in quadrant C | 4,040,758 | 760,559 |
| Events in quadrant D | 3,859,542 | 734,092 |
| Mode SS | |||
|---|---|---|---|
| Quadrant | BADHDUFLAG | Total packets | Discarded packets |
| A | 0 | 126 | 0 |
| B | 0 | 126 | 0 |
| C | 0 | 126 | 0 |
| D | 0 | 126 | 0 |
| Mode M9 | |||
|---|---|---|---|
| Quadrant | BADHDUFLAG | Total packets | Discarded packets |
| A | 0 | 16 | 0 |
| B | 0 | 17 | 0 |
| C | 0 | 17 | 0 |
| D | 0 | 17 | 0 |
| Mode M0 | |||
|---|---|---|---|
| Quadrant | BADHDUFLAG | Total packets | Discarded packets |
| A | 0 | 14740 | 2 |
| B | 0 | 19463 | 2 |
| C | 0 | 16172 | 2 |
| D | 0 | 15479 | 2 |
| Quadrant | Total seconds | Saturated seconds | Saturation percentage |
|---|---|---|---|
| A | 6195 | 83 | 1.339790% |
| B | 6195 | 108 | 1.743341% |
| C | 6195 | 163 | 2.631154% |
| D | 6195 | 74 | 1.194512% |
Noise dominated data is calculated using 1-second bins in cleaned event files. If a bin has >2000 counts, and if more than 50% of those come from <1% of pixels, then it is considered to be noise-dominated and hence unusable.
| Quadrant | # 1 sec bins | Bins with >0 counts | Bins with >2000 counts | High rate bins dominated by noise | Noise dominated (total time) | Noise dominated (detector-on time) | Marked lightcurve |
|---|---|---|---|---|---|---|---|
| A | 7520 | 6196 | 33 | 33 | 0.44% | 0.53% | 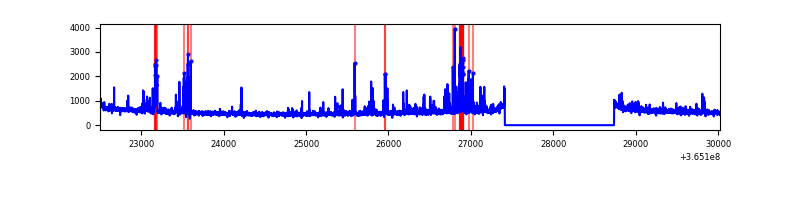 |
| B | 7520 | 6196 | 1 | 1 | 0.01% | 0.02% | 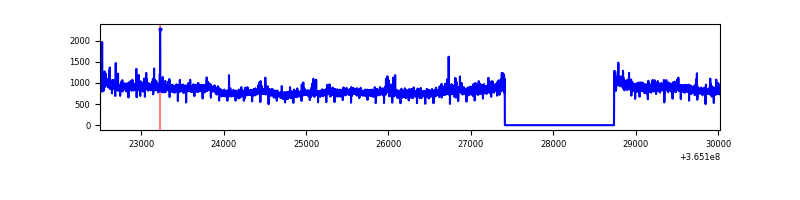 |
| C | 7520 | 6196 | 3 | 3 | 0.04% | 0.05% | 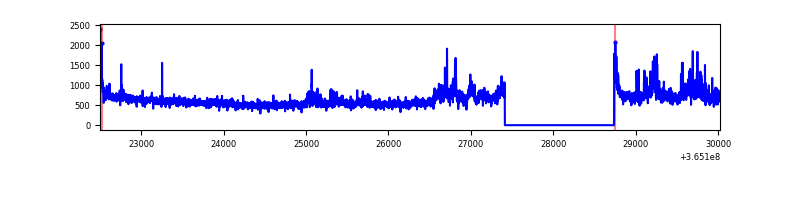 |
| D | 7520 | 6196 | 39 | 39 | 0.52% | 0.63% | 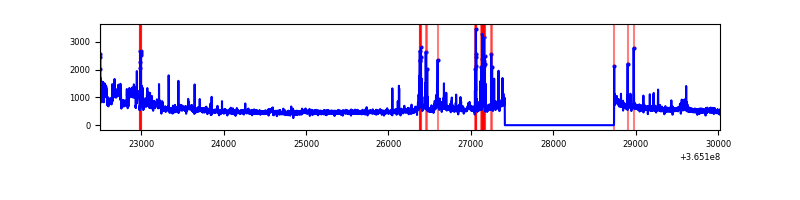 |
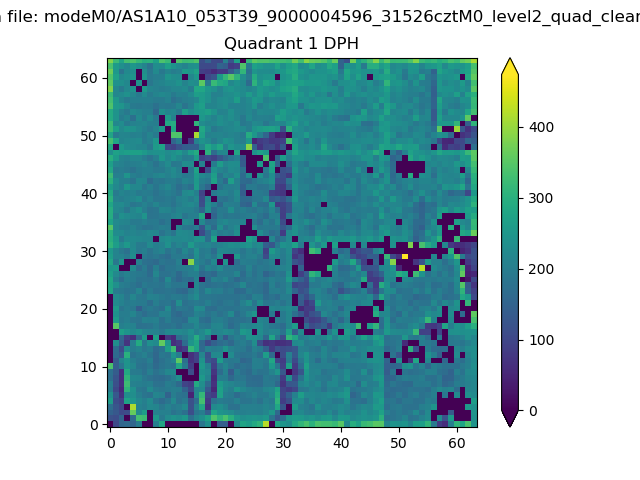
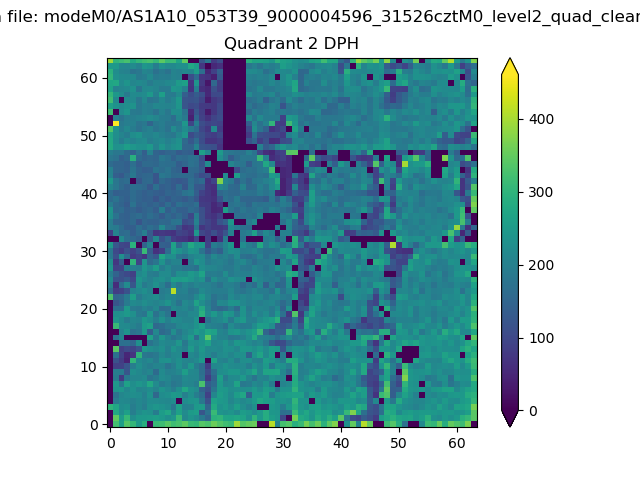
Top three noisy pixels from each quadrant. If the there are fewer than three noisy pixels in the level2.evt file, extra rows are filled as -1
| Pixel properties | Quadrant properties | ||||||
|---|---|---|---|---|---|---|---|
| Quadrant | DetID | PixID | Counts | Sigma | Mean | Median | Sigma |
| A | 0 | 13 | 370128 | 2218.84 | 840 | 826 | 166.4 |
| A | 13 | 254 | 10786 | 59.84 | 840 | 826 | 166.4 |
| A | 3 | 137 | 7860 | 42.26 | 840 | 826 | 166.4 |
| B | 6 | 159 | 1729031 | 10896.6 | 846 | 828 | 158.6 |
| B | 4 | 80 | 82425 | 514.48 | 846 | 828 | 158.6 |
| B | 0 | 190 | 23002 | 139.81 | 846 | 828 | 158.6 |
| C | 3 | 233 | 570755 | 2954.98 | 831 | 842 | 192.9 |
| C | 14 | 238 | 135798 | 699.74 | 831 | 842 | 192.9 |
| C | 4 | 175 | 41805 | 212.39 | 831 | 842 | 192.9 |
| D | 8 | 195 | 511326 | 2623.91 | 827 | 810 | 194.6 |
| D | 12 | 218 | 87258 | 444.32 | 827 | 810 | 194.6 |
| D | 2 | 250 | 82678 | 420.78 | 827 | 810 | 194.6 |
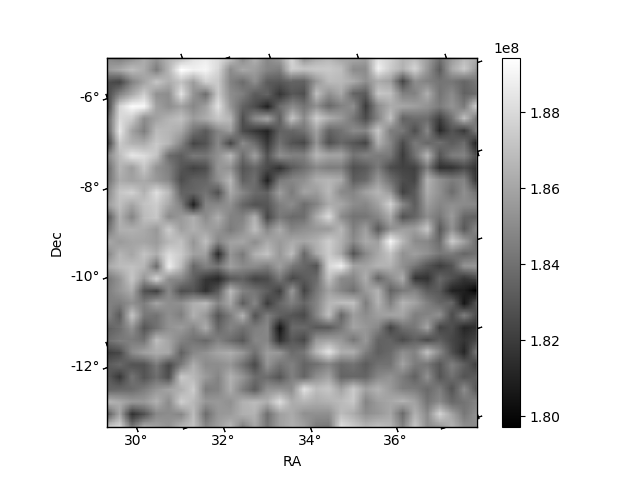
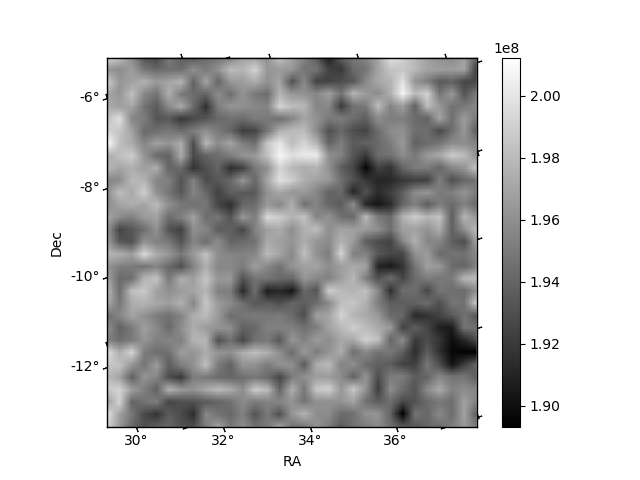
Histogram calculated using DETX and DETY for each event in the final _common_clean file
| Quadrant A | 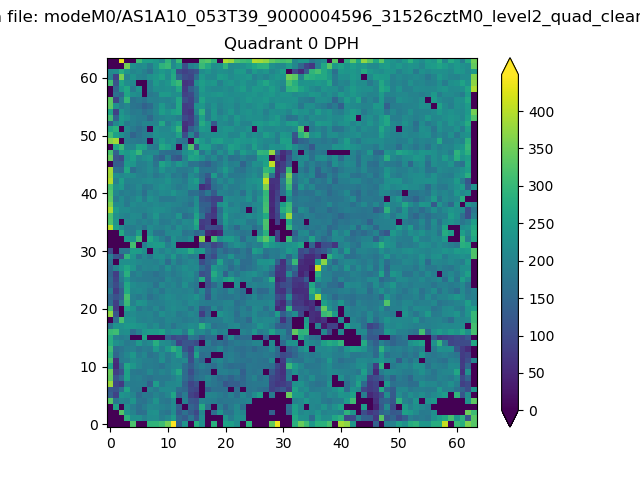 |
 |
Quadrant B |
|---|---|---|---|
| Quadrant D | 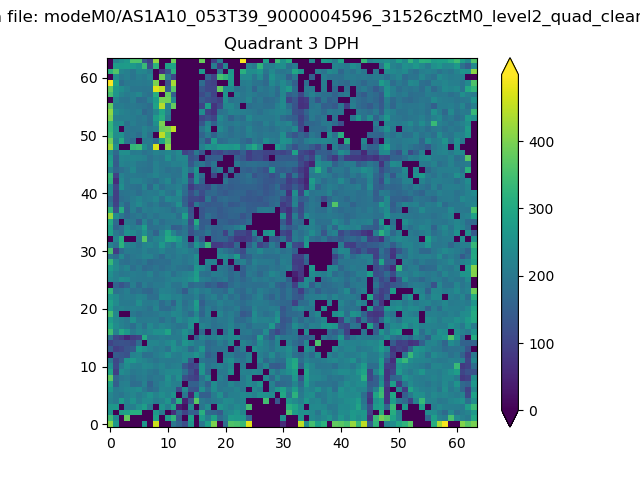 |
 |
Quadrant C |
| Plot type | Count rate plots | Images |
|---|---|---|
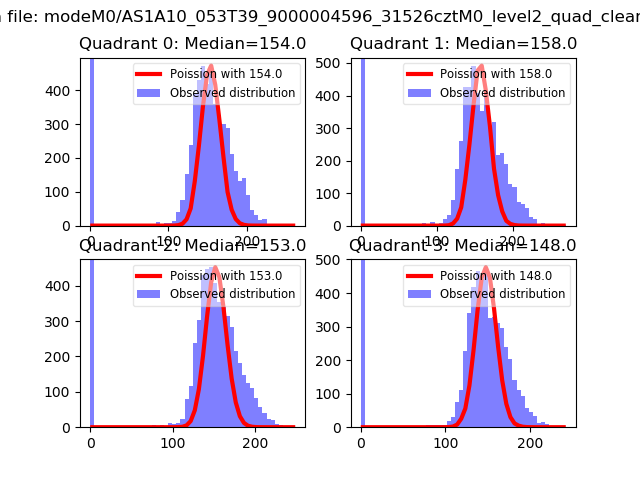
| Comparison with Poisson distribution Blue bars denote a histogram of data divided into 1 sec bins. Red curve is a Poisson curve with rate = median count rate of data. |
 |
 |
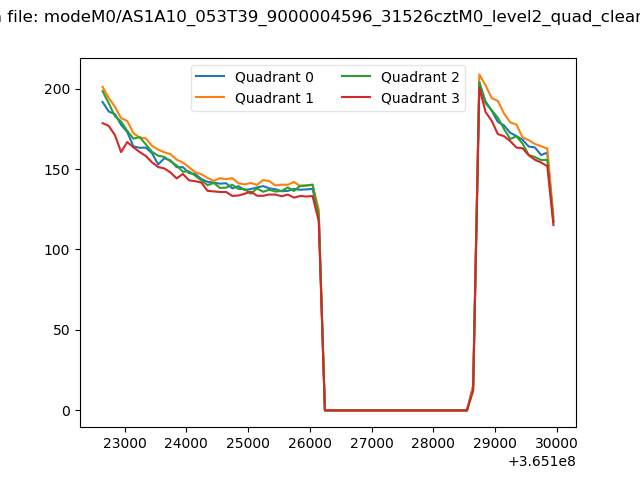
| Quadrant-wise count rates Data is divided into 100 sec bins |
 |
|
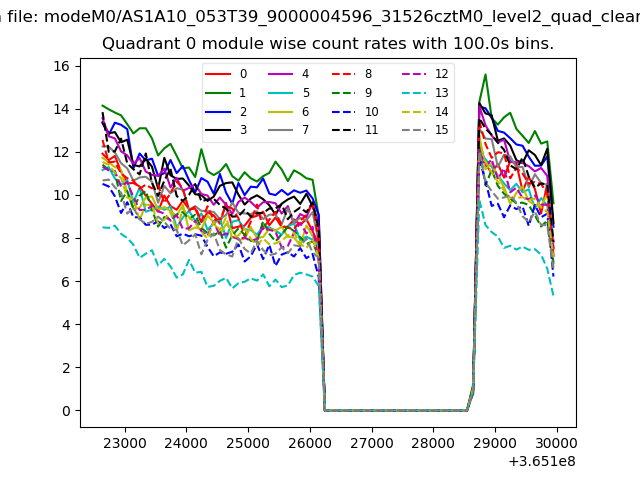
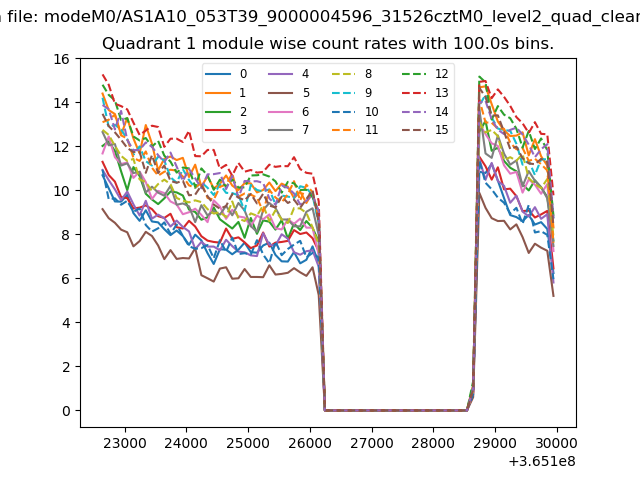
| Module-wise count rates for Quadrant A Data is divided into 100 sec bins |
 |
 |
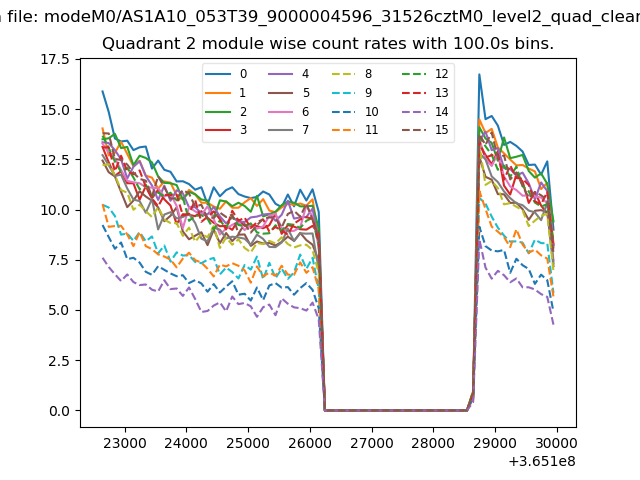
| Module-wise count rates for Quadrant B Data is divided into 100 sec bins |
 |
 |
| Module-wise count rates for Quadrant C Data is divided into 100 sec bins |
 |
 |
| Module-wise count rates for Quadrant D Data is divided into 100 sec bins |
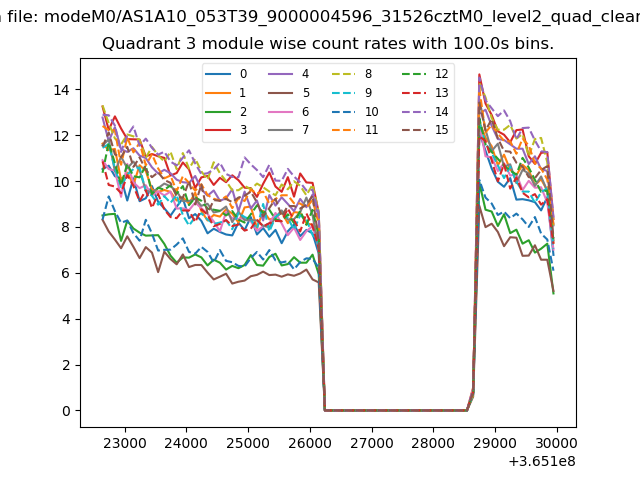 |
 |
| Parameter | Plot |
|---|---|
| CZT HV Monitor | 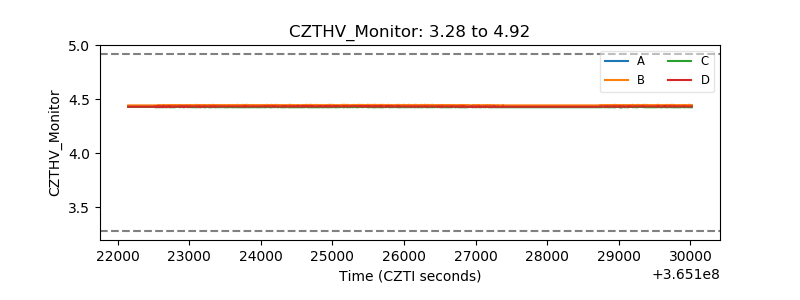 |
| D_VDD | 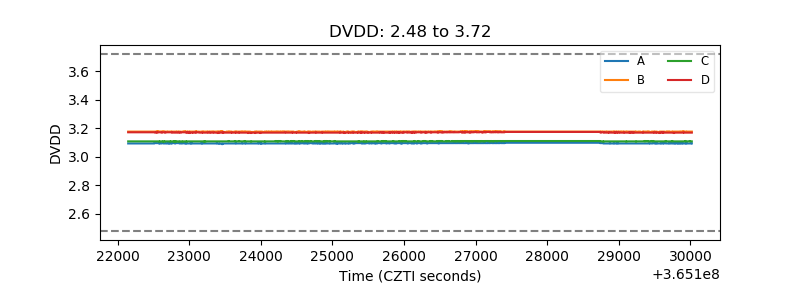 |
| Temperature 1 | 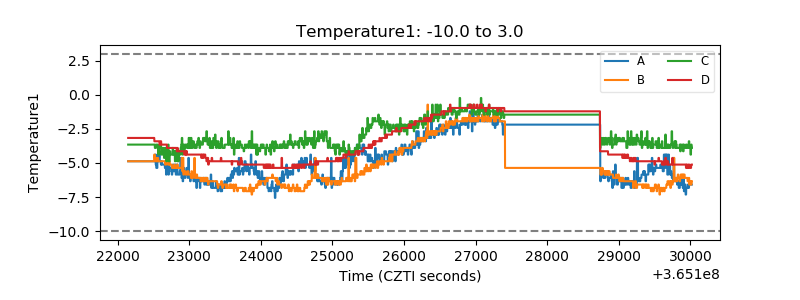 |
| Veto HV Monitor | 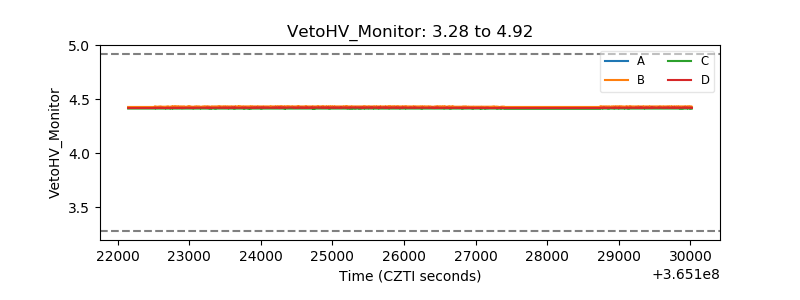 |
| Veto LLD | 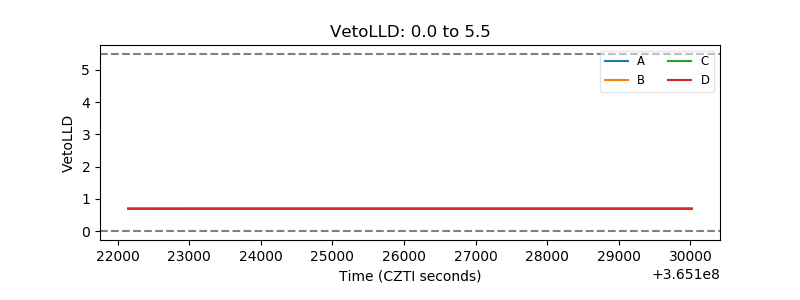 |
| Alpha Counter | 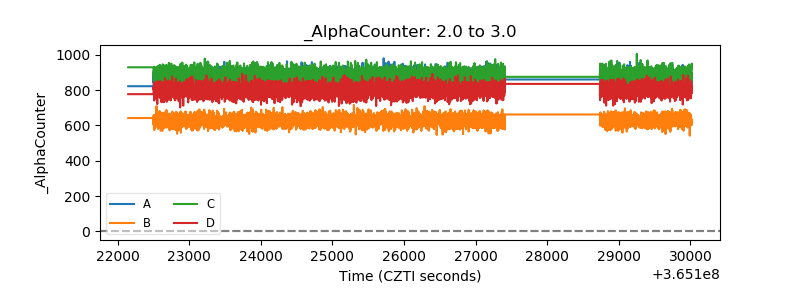 |
| _CPM_Rate | 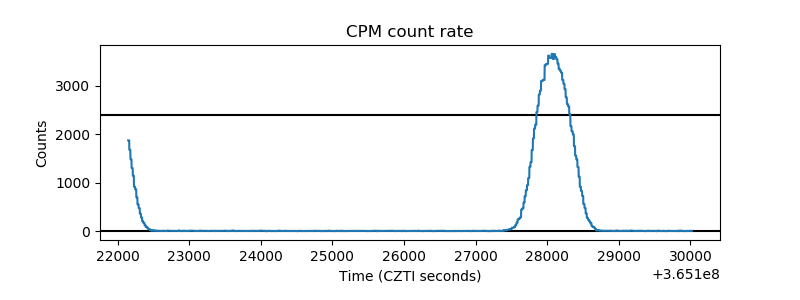 |
| CZT Counter | 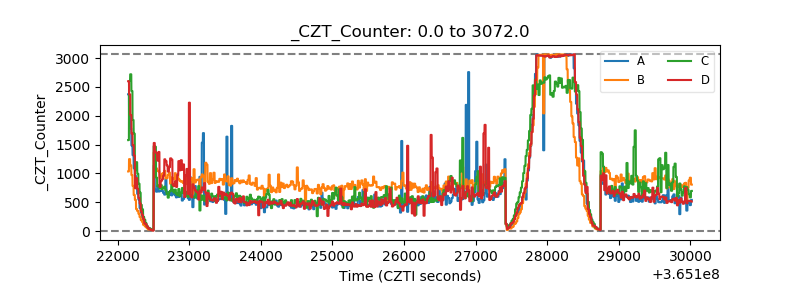 |
| +2.5 Volts monitor |  |
| +5 Volts monitor |  |
| _ROLL_ROT | 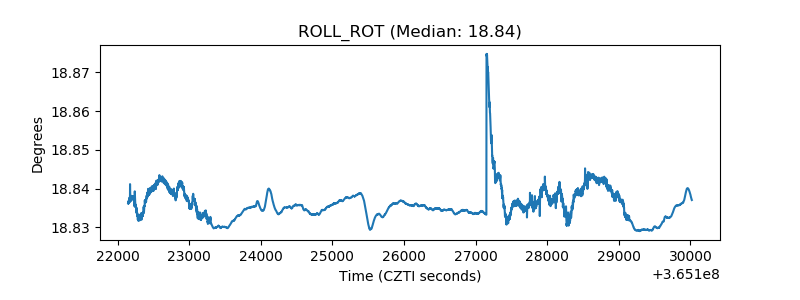 |
| _Roll_DEC | 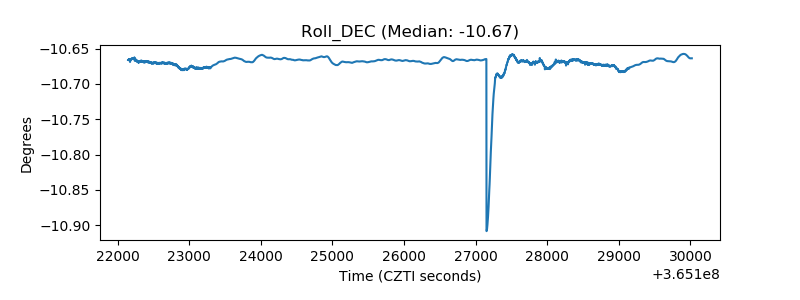 |
| _Roll_RA | 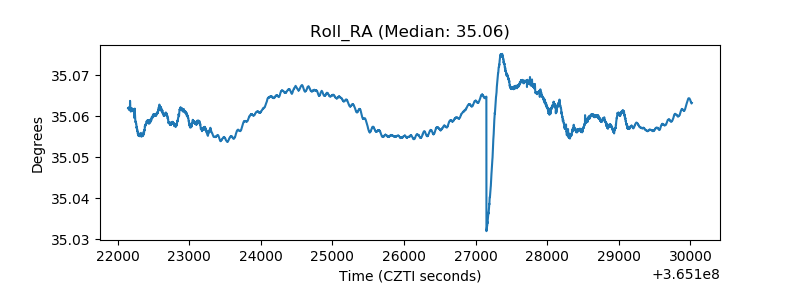 |
| Veto Counter | 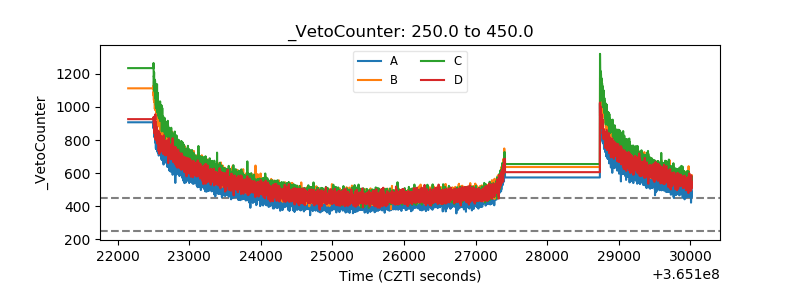 |