| Param | Original file | Final file |
|---|---|---|
| Filename | modeM0/AS1A10_053T39_9000004596_31527cztM0_level2.evt | modeM0/AS1A10_053T39_9000004596_31527cztM0_level2_quad_clean.evt |
| Size (bytes) | 288,227,520 | 73,739,520 |
| Size | 274.9 MB | 70.3 MB |
| Events in quadrant A | 1,702,125 | 502,125 |
| Events in quadrant B | 2,638,089 | 516,787 |
| Events in quadrant C | 2,431,163 | 496,283 |
| Events in quadrant D | 1,735,358 | 486,618 |
| Mode SS | |||
|---|---|---|---|
| Quadrant | BADHDUFLAG | Total packets | Discarded packets |
| A | 0 | 66 | 0 |
| B | 0 | 66 | 0 |
| C | 0 | 66 | 0 |
| D | 0 | 66 | 0 |
| Mode M9 | |||
|---|---|---|---|
| Quadrant | BADHDUFLAG | Total packets | Discarded packets |
| A | 0 | 10 | 0 |
| B | 0 | 11 | 0 |
| C | 0 | 11 | 0 |
| D | 0 | 11 | 0 |
| Mode M0 | |||
|---|---|---|---|
| Quadrant | BADHDUFLAG | Total packets | Discarded packets |
| A | 0 | 7127 | 1 |
| B | 0 | 10097 | 1 |
| C | 0 | 9682 | 1 |
| D | 0 | 7169 | 1 |
| Quadrant | Total seconds | Saturated seconds | Saturation percentage |
|---|---|---|---|
| A | 3255 | 9 | 0.276498% |
| B | 3255 | 21 | 0.645161% |
| C | 3255 | 63 | 1.935484% |
| D | 3255 | 8 | 0.245776% |
Noise dominated data is calculated using 1-second bins in cleaned event files. If a bin has >2000 counts, and if more than 50% of those come from <1% of pixels, then it is considered to be noise-dominated and hence unusable.
| Quadrant | # 1 sec bins | Bins with >0 counts | Bins with >2000 counts | High rate bins dominated by noise | Noise dominated (total time) | Noise dominated (detector-on time) | Marked lightcurve |
|---|---|---|---|---|---|---|---|
| A | 3255 | 3255 | 2 | 2 | 0.06% | 0.06% | 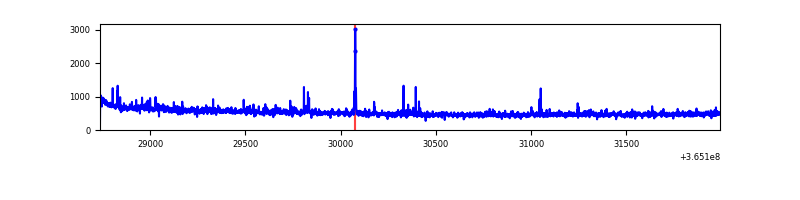 |
| B | 3255 | 3255 | 0 | 0 | 0.00% | 0.00% | 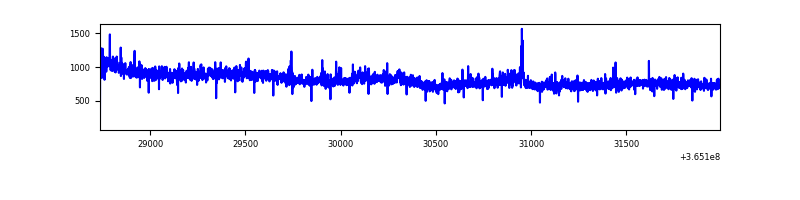 |
| C | 3255 | 3255 | 3 | 3 | 0.09% | 0.09% | 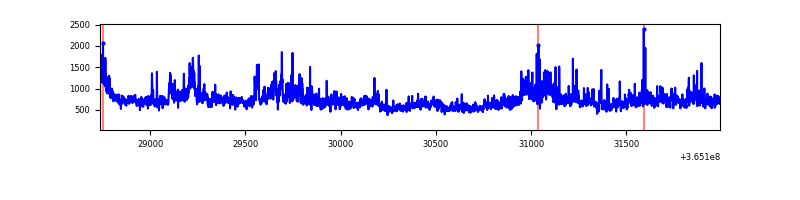 |
| D | 3255 | 3255 | 3 | 3 | 0.09% | 0.09% | 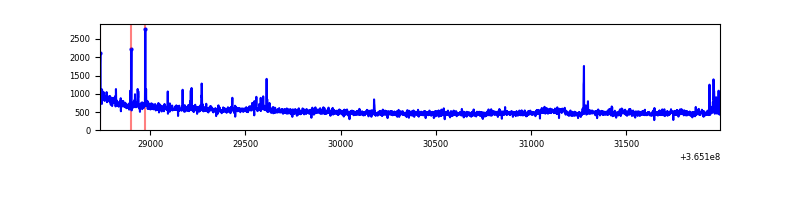 |
Top three noisy pixels from each quadrant. If the there are fewer than three noisy pixels in the level2.evt file, extra rows are filled as -1
| Pixel properties | Quadrant properties | ||||||
|---|---|---|---|---|---|---|---|
| Quadrant | DetID | PixID | Counts | Sigma | Mean | Median | Sigma |
| A | 0 | 13 | 66431 | 778.96 | 424 | 417 | 84.7 |
| A | 13 | 254 | 5819 | 63.74 | 424 | 417 | 84.7 |
| A | 3 | 137 | 3865 | 40.69 | 424 | 417 | 84.7 |
| B | 6 | 159 | 906671 | 11200.82 | 426 | 417 | 80.9 |
| B | 4 | 80 | 49127 | 602.03 | 426 | 417 | 80.9 |
| B | 12 | 111 | 9271 | 109.43 | 426 | 417 | 80.9 |
| C | 3 | 233 | 672046 | 6759.75 | 420 | 426 | 99.4 |
| C | 14 | 238 | 67473 | 674.82 | 420 | 426 | 99.4 |
| C | 4 | 175 | 22607 | 223.25 | 420 | 426 | 99.4 |
| D | 8 | 195 | 102634 | 1024.27 | 419 | 410 | 99.8 |
| D | 2 | 250 | 20868 | 204.99 | 419 | 410 | 99.8 |
| D | 2 | 234 | 13654 | 132.7 | 419 | 410 | 99.8 |
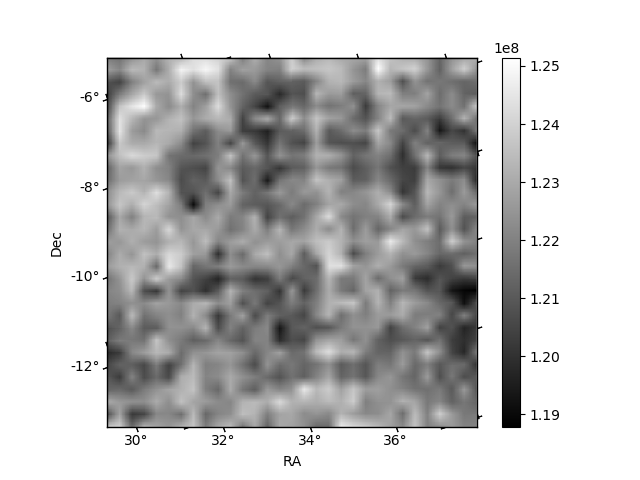
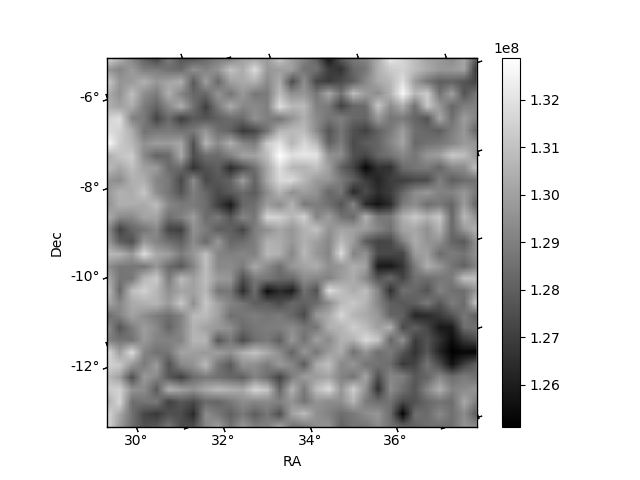
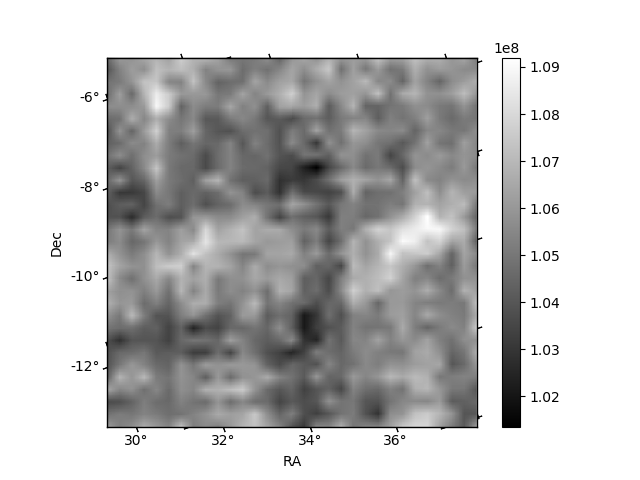
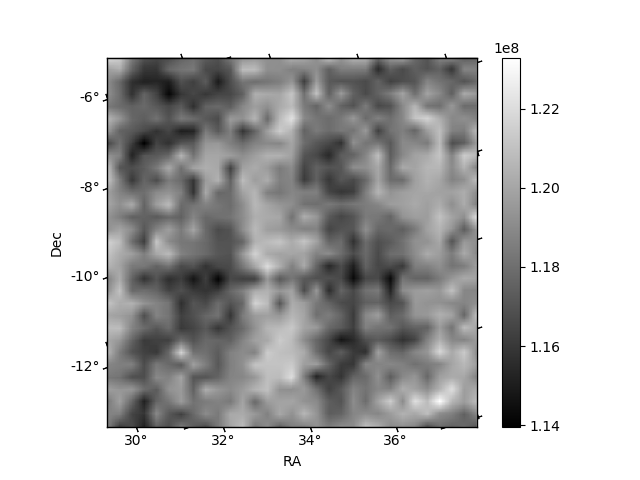
Histogram calculated using DETX and DETY for each event in the final _common_clean file
| Quadrant A |  |
 |
Quadrant B |
|---|---|---|---|
| Quadrant D |  |
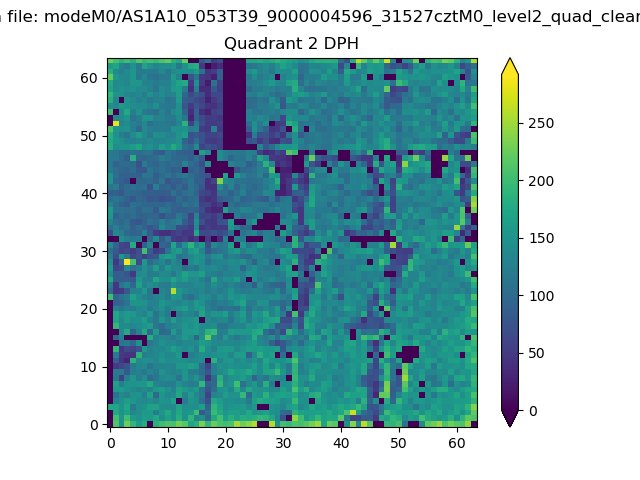 |
Quadrant C |
| Plot type | Count rate plots | Images |
|---|---|---|
| Comparison with Poisson distribution Blue bars denote a histogram of data divided into 1 sec bins. Red curve is a Poisson curve with rate = median count rate of data. |
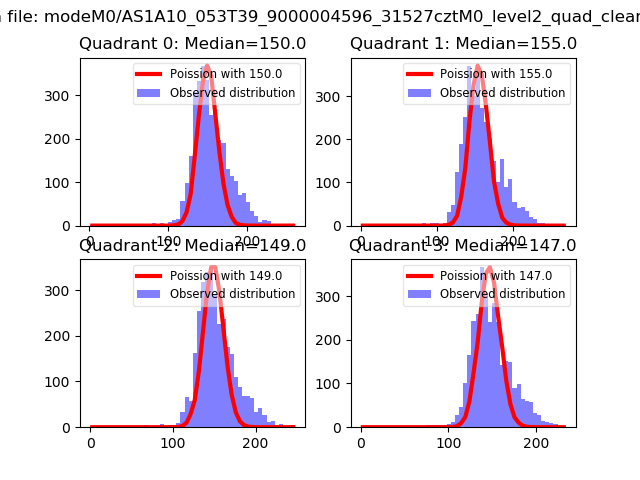 |
 |
| Quadrant-wise count rates Data is divided into 100 sec bins |
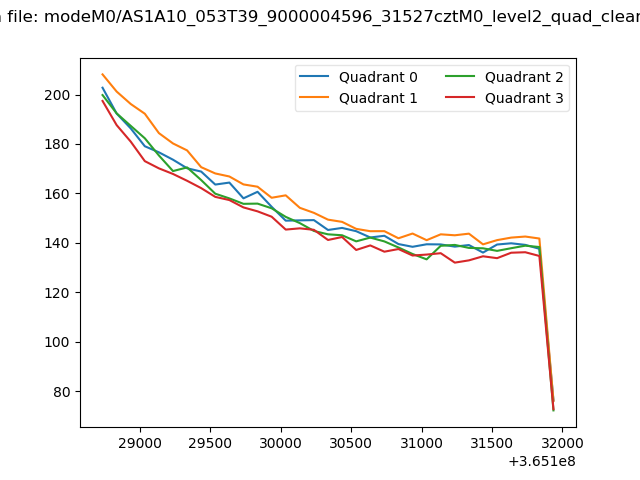 |
|
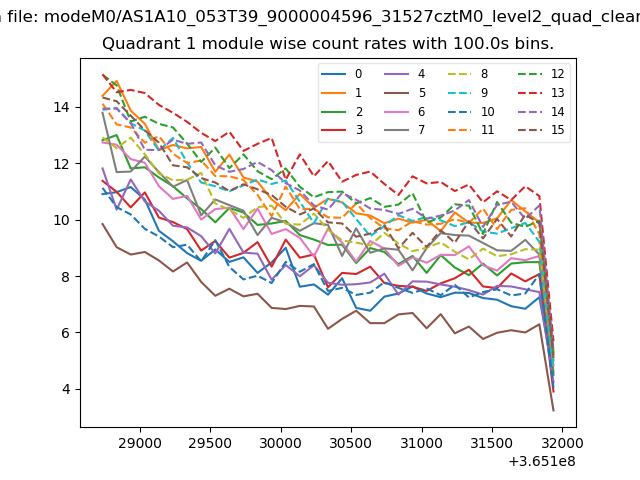
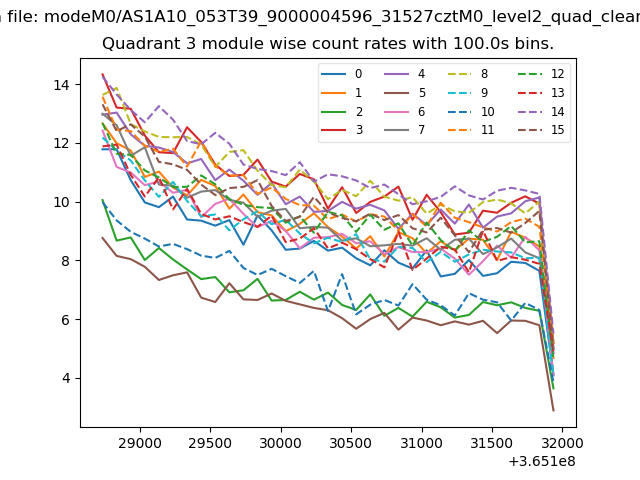
| Module-wise count rates for Quadrant A Data is divided into 100 sec bins |
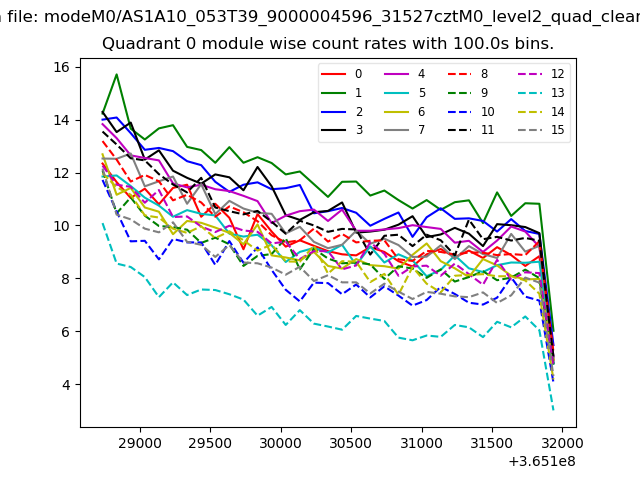 |
 |
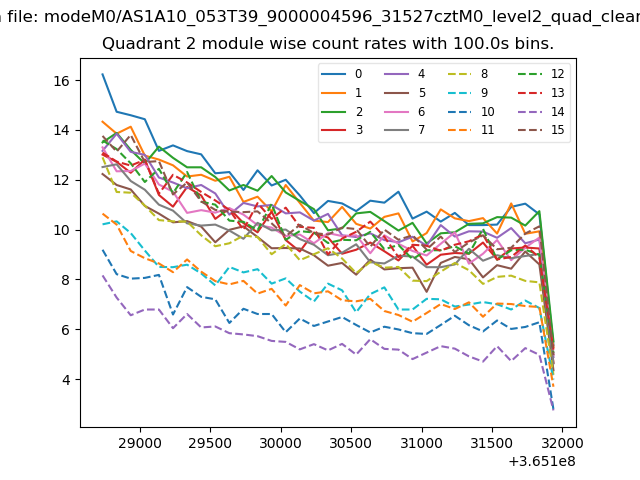
| Module-wise count rates for Quadrant B Data is divided into 100 sec bins |
 |
 |
| Module-wise count rates for Quadrant C Data is divided into 100 sec bins |
 |
 |
| Module-wise count rates for Quadrant D Data is divided into 100 sec bins |
 |
 |
| Parameter | Plot |
|---|---|
| CZT HV Monitor | 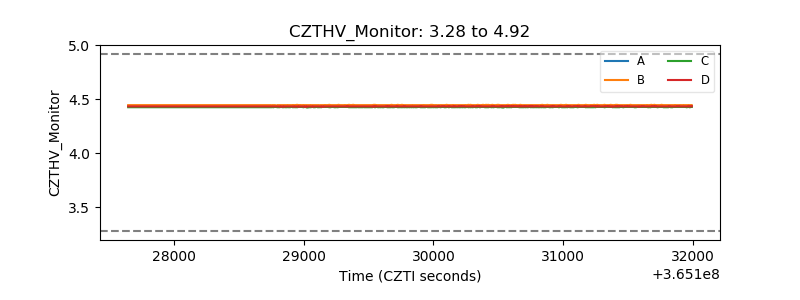 |
| D_VDD | 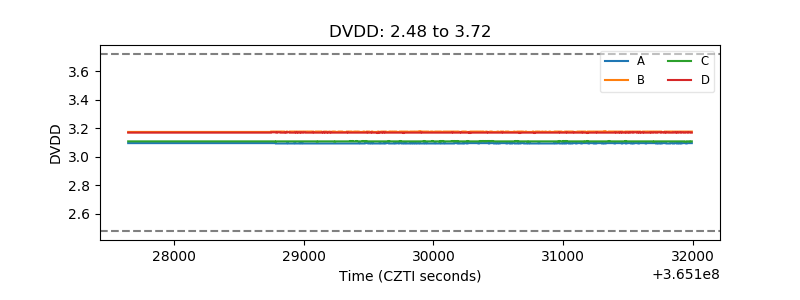 |
| Temperature 1 | 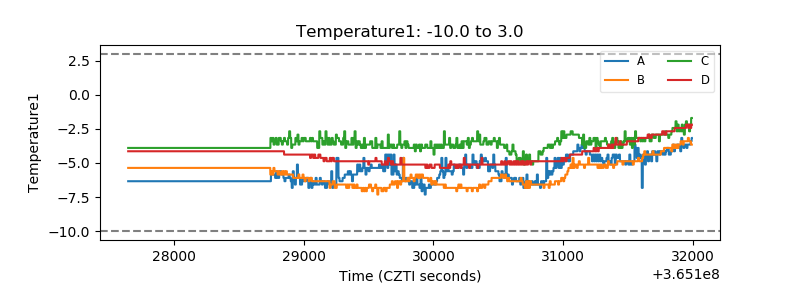 |
| Veto HV Monitor | 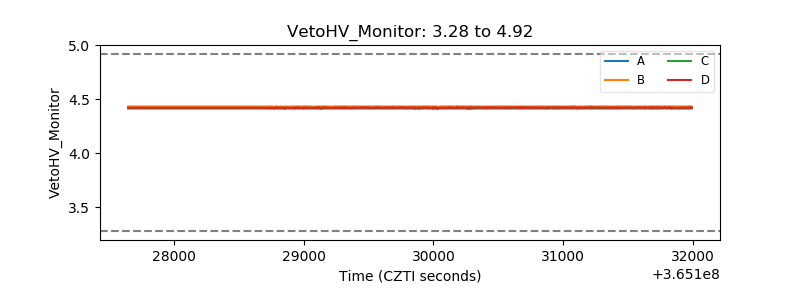 |
| Veto LLD |  |
| Alpha Counter | 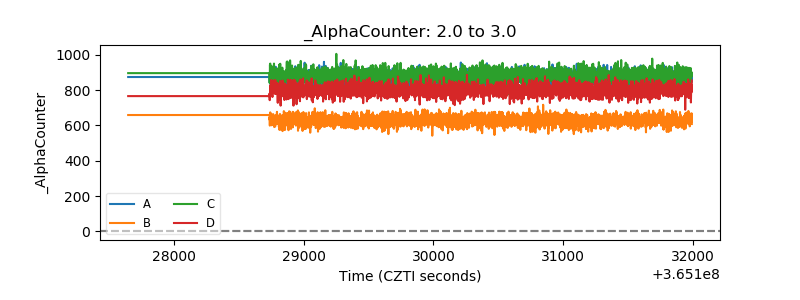 |
| _CPM_Rate | 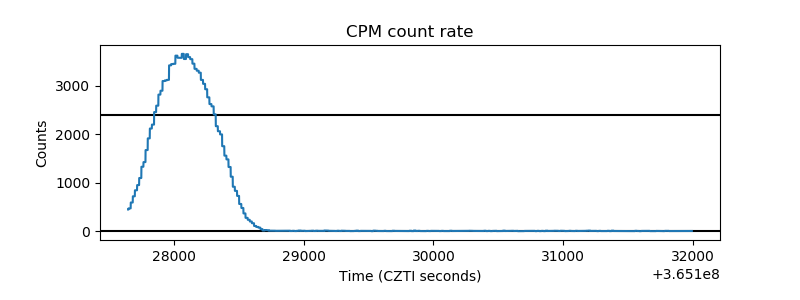 |
| CZT Counter | 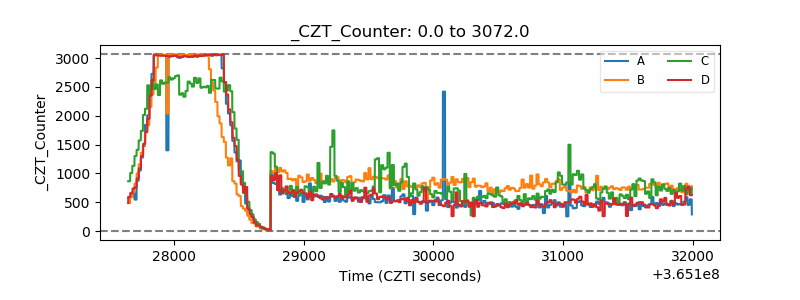 |
| +2.5 Volts monitor |  |
| +5 Volts monitor | 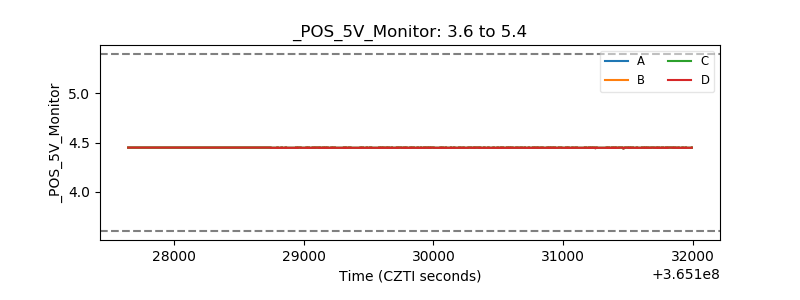 |
| _ROLL_ROT | 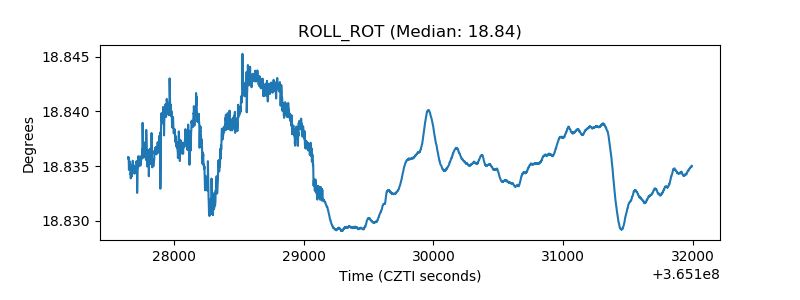 |
| _Roll_DEC | 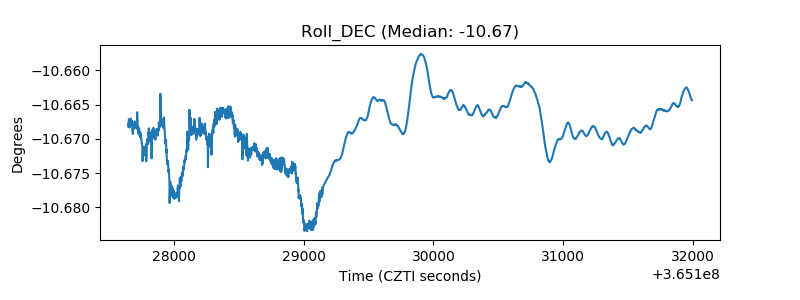 |
| _Roll_RA |  |
| Veto Counter | 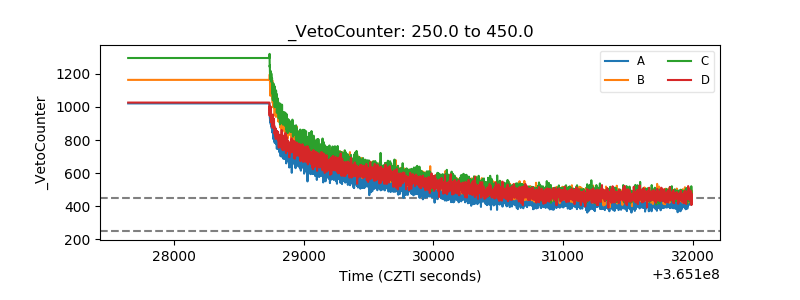 |