| Param | Original file | Final file |
|---|---|---|
| Filename | modeM0/AS1A10_056T01_9000004598_31527cztM0_level2.evt | modeM0/AS1A10_056T01_9000004598_31527cztM0_level2_quad_clean.evt |
| Size (bytes) | 239,290,560 | 37,722,240 |
| Size | 228.2 MB | 36.0 MB |
| Events in quadrant A | 1,322,131 | 249,649 |
| Events in quadrant B | 1,965,678 | 255,303 |
| Events in quadrant C | 2,363,855 | 233,341 |
| Events in quadrant D | 1,433,461 | 233,489 |
| Mode M0 | |||
|---|---|---|---|
| Quadrant | BADHDUFLAG | Total packets | Discarded packets |
| A | 0 | 5378 | 1 |
| B | 0 | 7451 | 2 |
| C | 0 | 8744 | 1 |
| D | 0 | 5836 | 1 |
| Mode M9 | |||
|---|---|---|---|
| Quadrant | BADHDUFLAG | Total packets | Discarded packets |
| A | 0 | 14 | 0 |
| B | 0 | 14 | 0 |
| C | 0 | 14 | 0 |
| D | 0 | 14 | 0 |
| Mode SS | |||
|---|---|---|---|
| Quadrant | BADHDUFLAG | Total packets | Discarded packets |
| A | 0 | 50 | 0 |
| B | 0 | 50 | 0 |
| C | 0 | 50 | 0 |
| D | 0 | 50 | 0 |
| Quadrant | Total seconds | Saturated seconds | Saturation percentage |
|---|---|---|---|
| A | 2360 | 23 | 0.974576% |
| B | 2359 | 64 | 2.713014% |
| C | 2359 | 266 | 11.275964% |
| D | 2359 | 43 | 1.822806% |
Noise dominated data is calculated using 1-second bins in cleaned event files. If a bin has >2000 counts, and if more than 50% of those come from <1% of pixels, then it is considered to be noise-dominated and hence unusable.
| Quadrant | # 1 sec bins | Bins with >0 counts | Bins with >2000 counts | High rate bins dominated by noise | Noise dominated (total time) | Noise dominated (detector-on time) | Marked lightcurve |
|---|---|---|---|---|---|---|---|
| A | 3740 | 2361 | 8 | 8 | 0.21% | 0.34% | 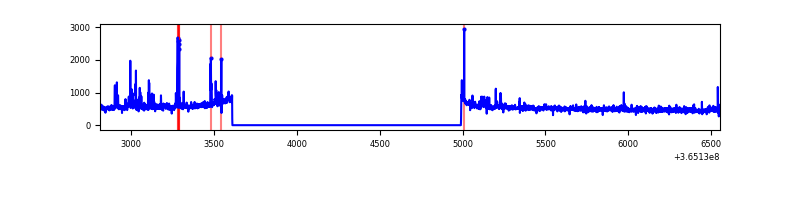 |
| B | 3739 | 2359 | 1 | 1 | 0.03% | 0.04% | 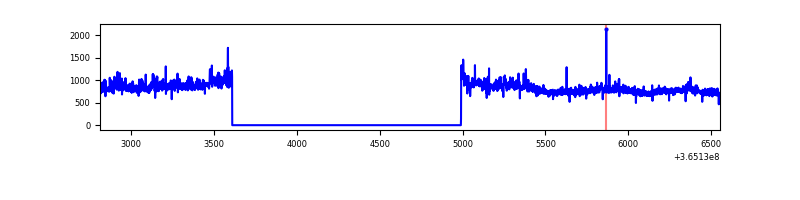 |
| C | 3739 | 2359 | 31 | 31 | 0.83% | 1.31% | 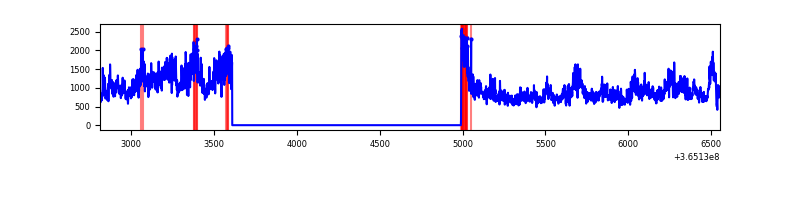 |
| D | 3739 | 2360 | 17 | 17 | 0.45% | 0.72% | 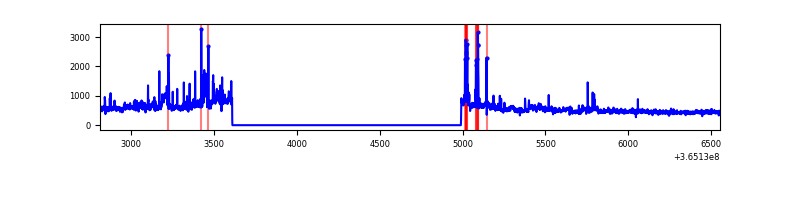 |
Top three noisy pixels from each quadrant. If the there are fewer than three noisy pixels in the level2.evt file, extra rows are filled as -1
| Pixel properties | Quadrant properties | ||||||
|---|---|---|---|---|---|---|---|
| Quadrant | DetID | PixID | Counts | Sigma | Mean | Median | Sigma |
| A | 0 | 13 | 92961 | 1424.21 | 319 | 312 | 65.1 |
| A | 13 | 254 | 4044 | 57.36 | 319 | 312 | 65.1 |
| A | 3 | 137 | 2945 | 40.47 | 319 | 312 | 65.1 |
| B | 6 | 159 | 633531 | 10301.16 | 320 | 314 | 61.5 |
| B | 4 | 80 | 68910 | 1115.92 | 320 | 314 | 61.5 |
| B | 12 | 111 | 6822 | 105.87 | 320 | 314 | 61.5 |
| C | 3 | 233 | 1053168 | 14889.78 | 299 | 301 | 70.7 |
| C | 0 | 10 | 62961 | 886.15 | 299 | 301 | 70.7 |
| C | 14 | 238 | 48322 | 679.12 | 299 | 301 | 70.7 |
| D | 8 | 195 | 143929 | 1953.7 | 305 | 297 | 73.5 |
| D | 2 | 250 | 55435 | 749.99 | 305 | 297 | 73.5 |
| D | 12 | 233 | 35344 | 476.71 | 305 | 297 | 73.5 |
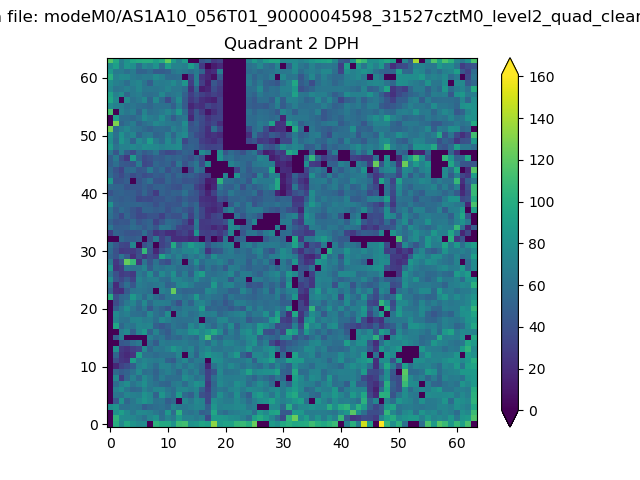
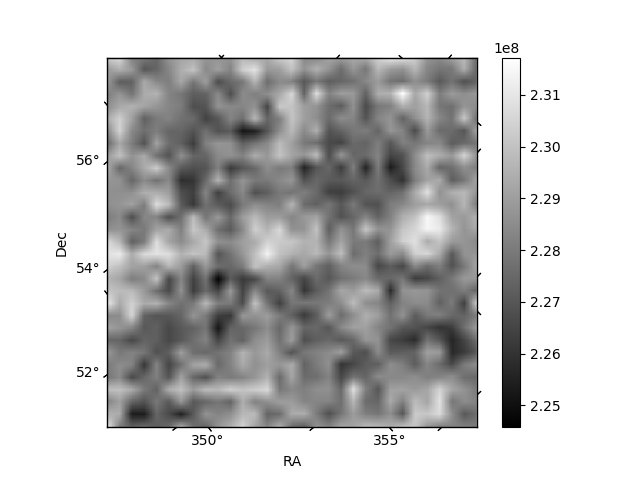
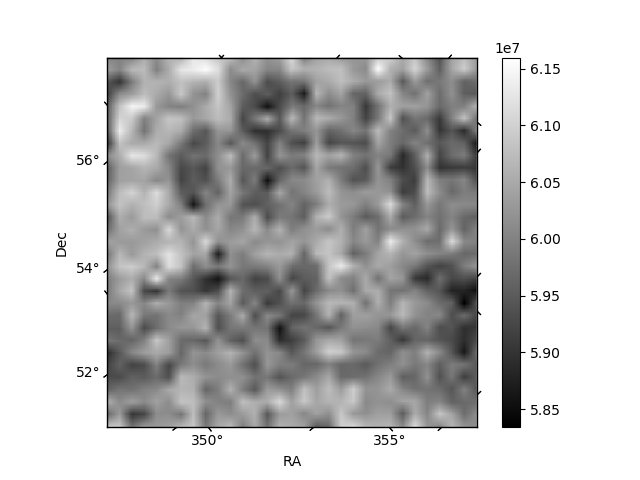
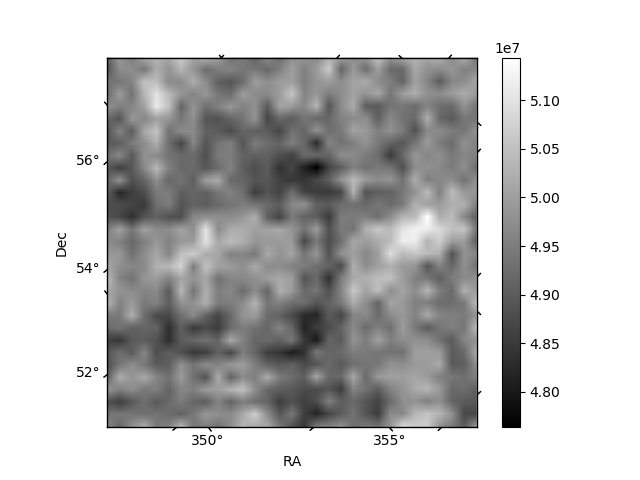
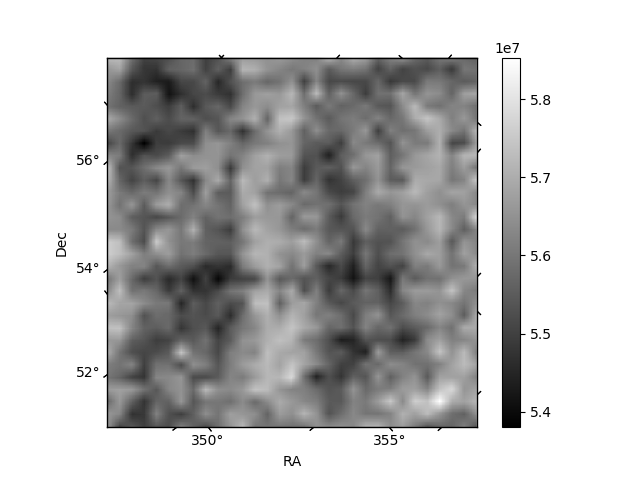
Histogram calculated using DETX and DETY for each event in the final _common_clean file
| Quadrant A | 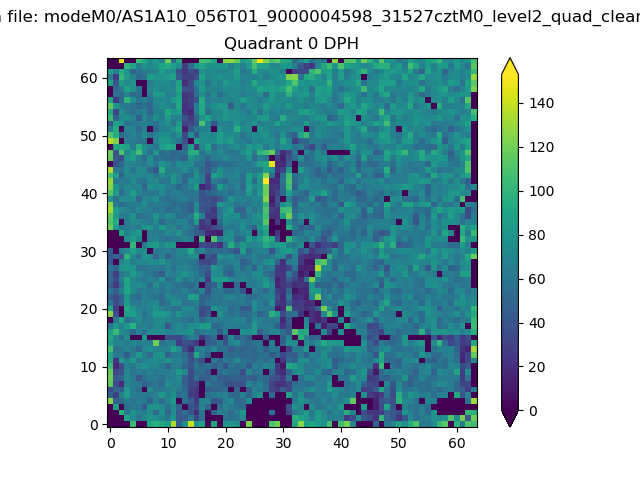 |
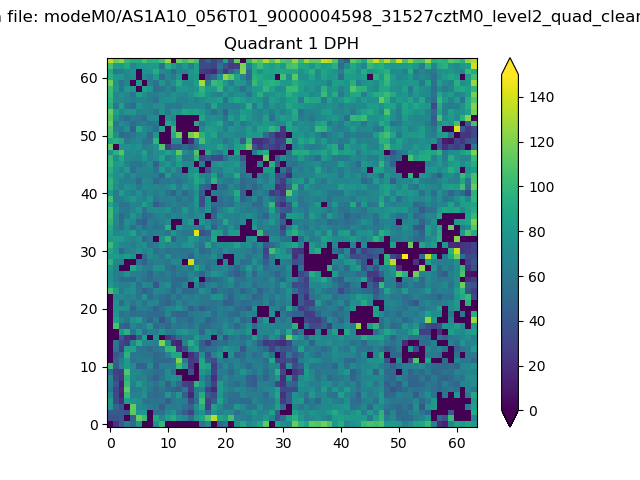 |
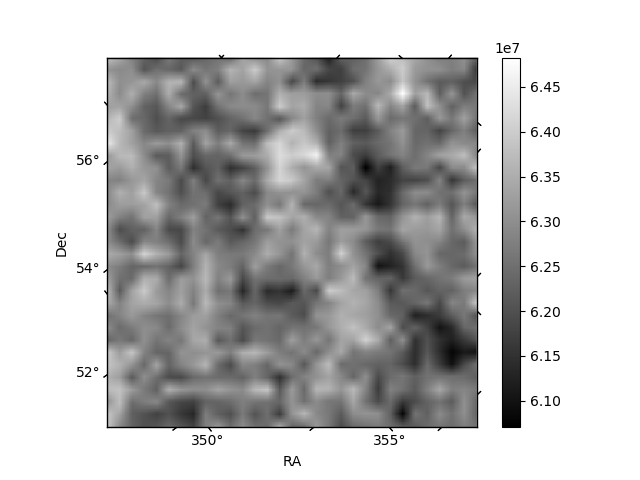
Quadrant B |
|---|---|---|---|
| Quadrant D | 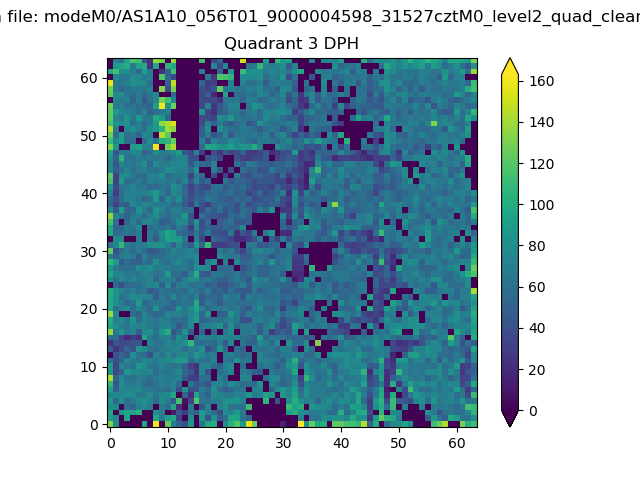 |
 |
Quadrant C |
| Plot type | Count rate plots | Images |
|---|---|---|
| Comparison with Poisson distribution Blue bars denote a histogram of data divided into 1 sec bins. Red curve is a Poisson curve with rate = median count rate of data. |
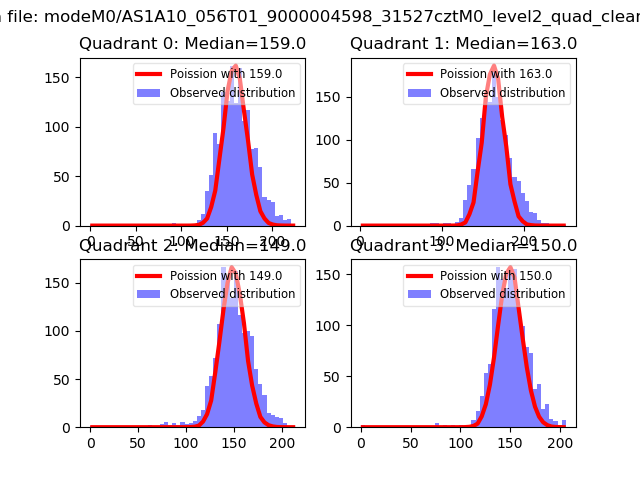 |
 |
| Quadrant-wise count rates Data is divided into 100 sec bins |
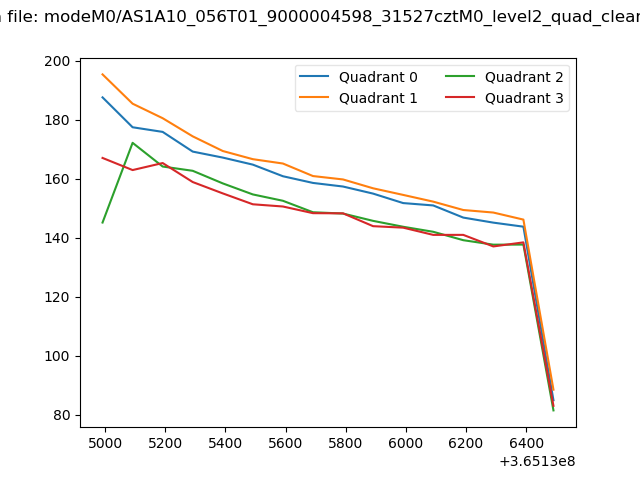 |
|
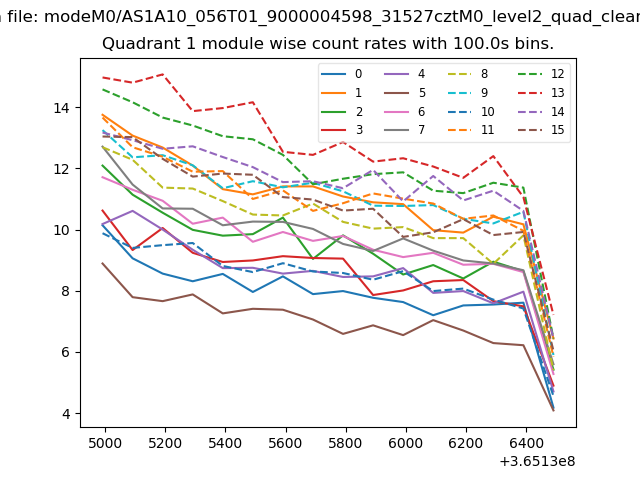
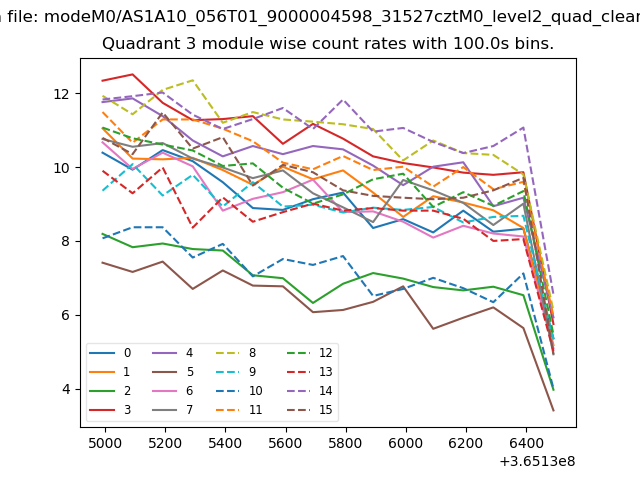
| Module-wise count rates for Quadrant A Data is divided into 100 sec bins |
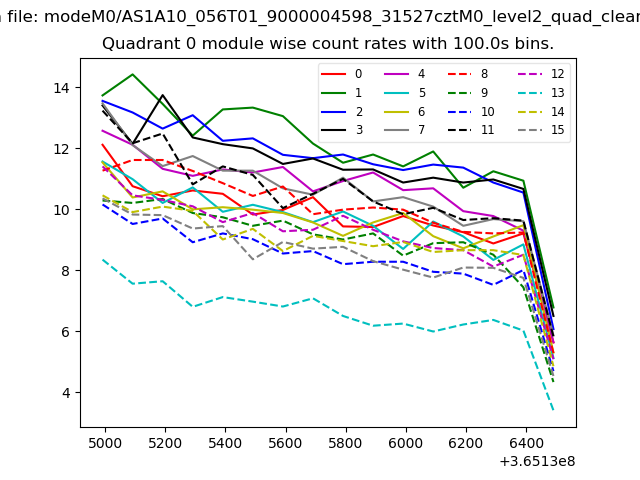 |
 |
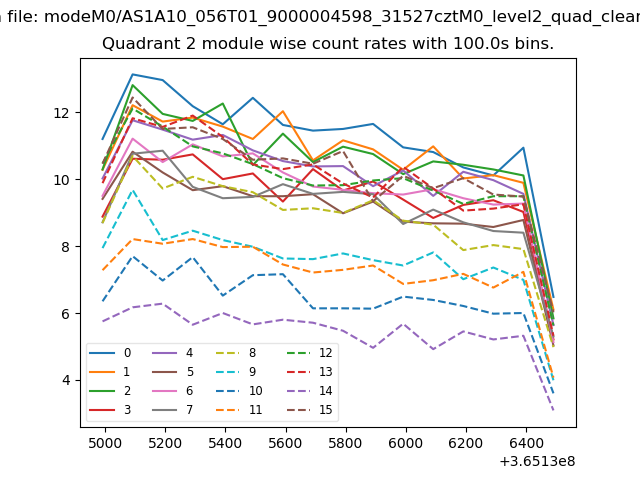
| Module-wise count rates for Quadrant B Data is divided into 100 sec bins |
 |
 |
| Module-wise count rates for Quadrant C Data is divided into 100 sec bins |
 |
 |
| Module-wise count rates for Quadrant D Data is divided into 100 sec bins |
 |
 |
| Parameter | Plot |
|---|---|
| CZT HV Monitor |  |
| D_VDD | 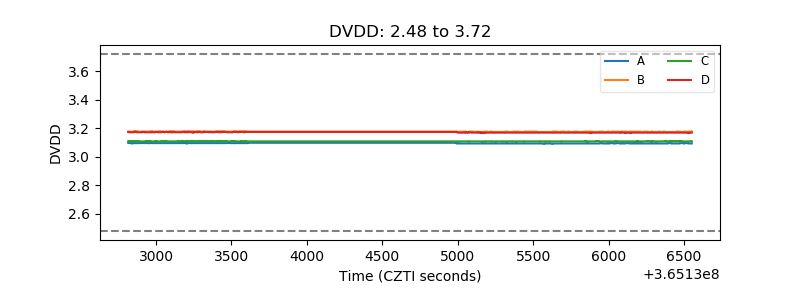 |
| Temperature 1 | 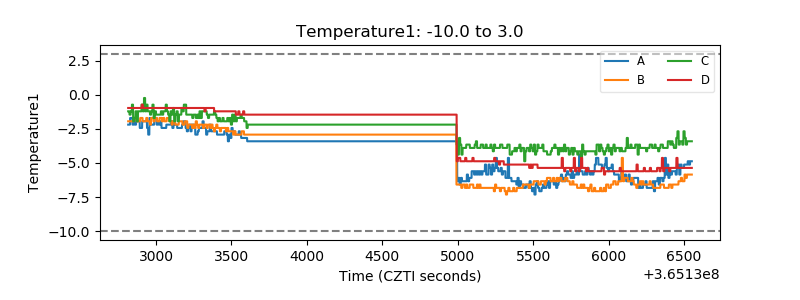 |
| Veto HV Monitor | 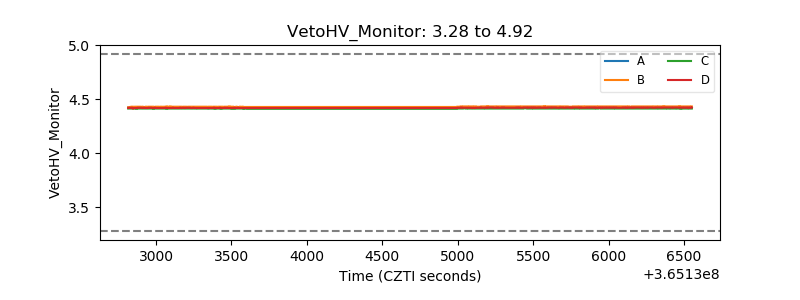 |
| Veto LLD | 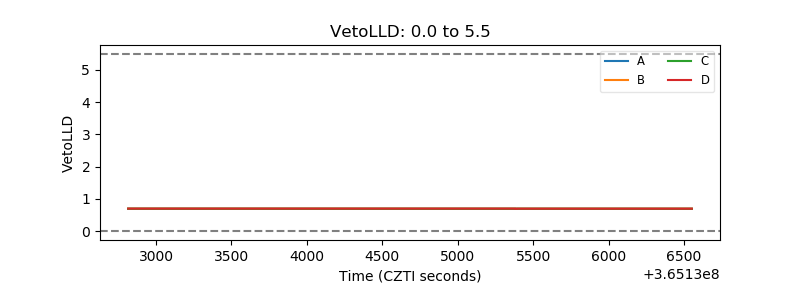 |
| Alpha Counter | 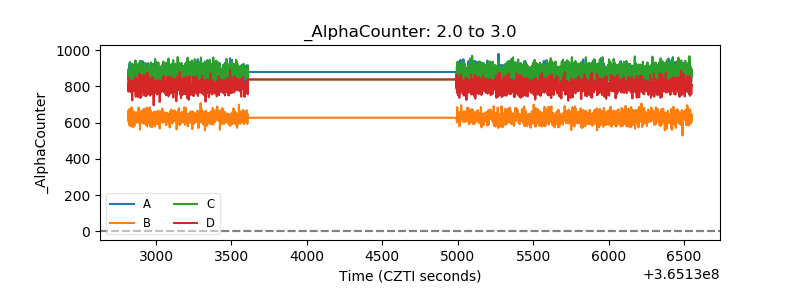 |
| _CPM_Rate | 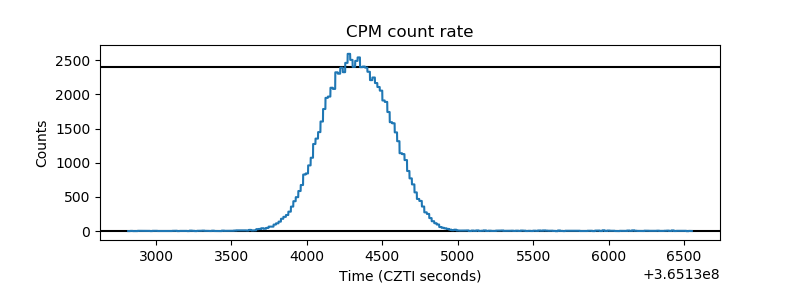 |
| CZT Counter | 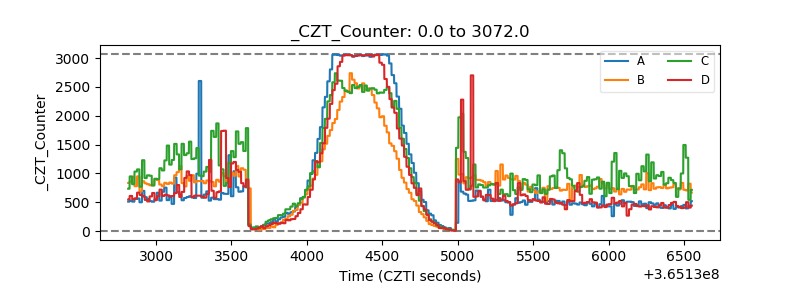 |
| +2.5 Volts monitor |  |
| +5 Volts monitor |  |
| _ROLL_ROT | 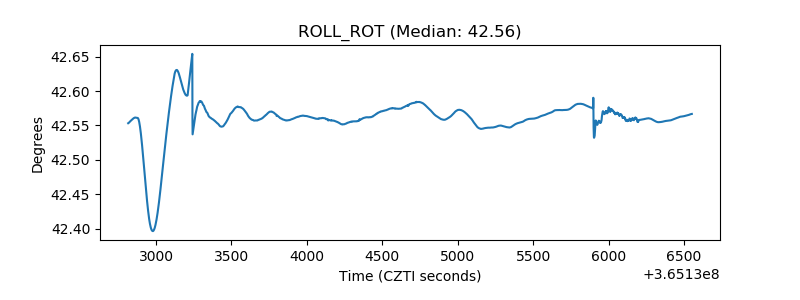 |
| _Roll_DEC | 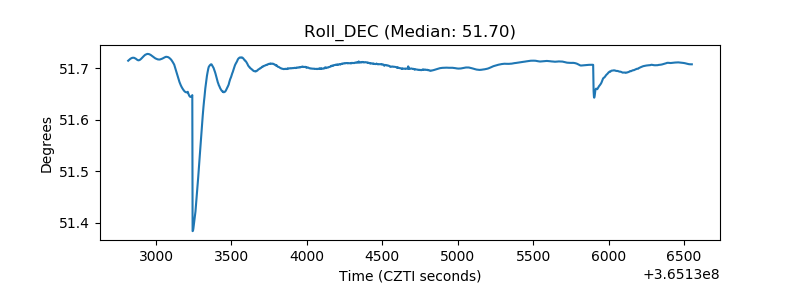 |
| _Roll_RA | 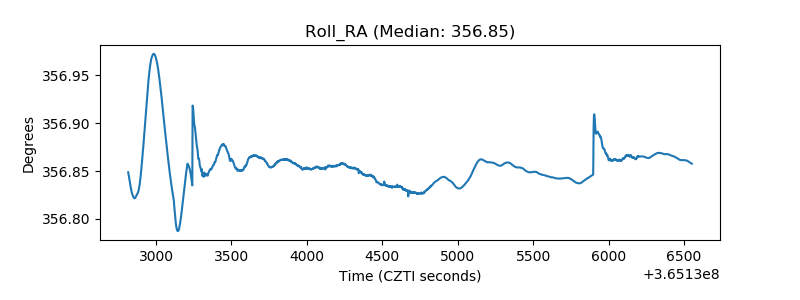 |
| Veto Counter | 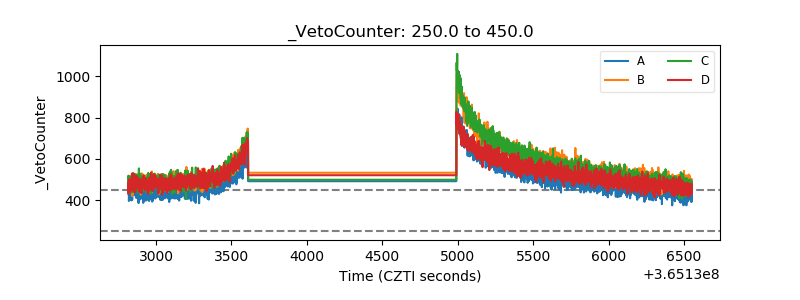 |