| Param | Original file | Final file |
|---|---|---|
| Filename | modeM0/AS1A10_056T01_9000004598_31528cztM0_level2.evt | modeM0/AS1A10_056T01_9000004598_31528cztM0_level2_quad_clean.evt |
| Size (bytes) | 580,685,760 | 84,977,280 |
| Size | 553.8 MB | 81.0 MB |
| Events in quadrant A | 3,904,819 | 552,876 |
| Events in quadrant B | 4,716,409 | 573,175 |
| Events in quadrant C | 5,443,350 | 498,384 |
| Events in quadrant D | 3,125,565 | 539,390 |
| Mode M0 | |||
|---|---|---|---|
| Quadrant | BADHDUFLAG | Total packets | Discarded packets |
| A | 0 | 15388 | 1 |
| B | 0 | 18332 | 1 |
| C | 0 | 20034 | 1 |
| D | 0 | 13102 | 1 |
| Mode M9 | |||
|---|---|---|---|
| Quadrant | BADHDUFLAG | Total packets | Discarded packets |
| A | 0 | 14 | 0 |
| B | 0 | 14 | 0 |
| C | 0 | 14 | 0 |
| D | 0 | 14 | 0 |
| Mode SS | |||
|---|---|---|---|
| Quadrant | BADHDUFLAG | Total packets | Discarded packets |
| A | 0 | 118 | 0 |
| B | 0 | 118 | 0 |
| C | 0 | 118 | 0 |
| D | 0 | 118 | 0 |
| Quadrant | Total seconds | Saturated seconds | Saturation percentage |
|---|---|---|---|
| A | 5857 | 270 | 4.609869% |
| B | 5857 | 137 | 2.339081% |
| C | 5857 | 807 | 13.778385% |
| D | 5857 | 31 | 0.529281% |
Noise dominated data is calculated using 1-second bins in cleaned event files. If a bin has >2000 counts, and if more than 50% of those come from <1% of pixels, then it is considered to be noise-dominated and hence unusable.
| Quadrant | # 1 sec bins | Bins with >0 counts | Bins with >2000 counts | High rate bins dominated by noise | Noise dominated (total time) | Noise dominated (detector-on time) | Marked lightcurve |
|---|---|---|---|---|---|---|---|
| A | 7172 | 5858 | 229 | 229 | 3.19% | 3.91% | 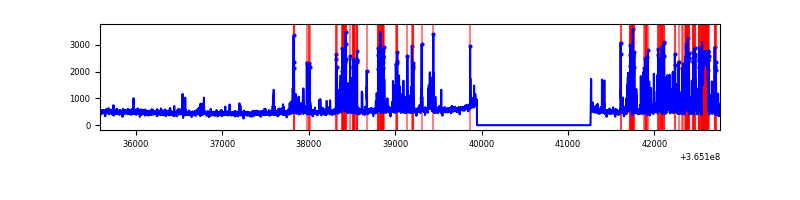 |
| B | 7172 | 5858 | 12 | 12 | 0.17% | 0.20% |  |
| C | 7172 | 5858 | 677 | 677 | 9.44% | 11.56% |  |
| D | 7172 | 5858 | 16 | 16 | 0.22% | 0.27% |  |
Top three noisy pixels from each quadrant. If the there are fewer than three noisy pixels in the level2.evt file, extra rows are filled as -1
| Pixel properties | Quadrant properties | ||||||
|---|---|---|---|---|---|---|---|
| Quadrant | DetID | PixID | Counts | Sigma | Mean | Median | Sigma |
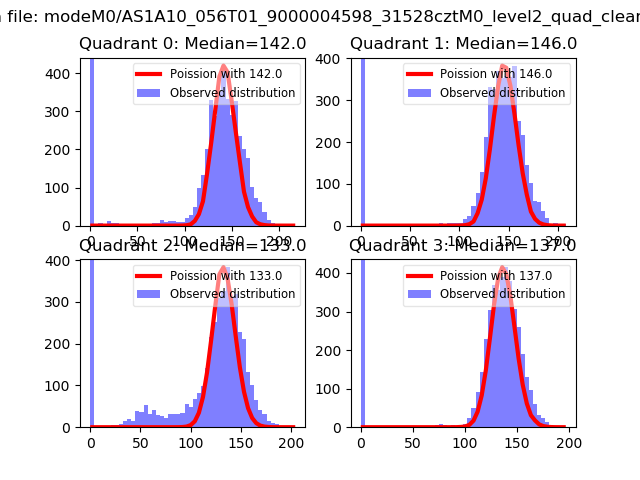
| A | 0 | 13 | 1155540 | 8132.16 | 713 | 699 | 142.0 |
| A | 13 | 254 | 9510 | 62.05 | 713 | 699 | 142.0 |
| A | 3 | 137 | 6758 | 42.67 | 713 | 699 | 142.0 |
| B | 6 | 159 | 1574427 | 11531.84 | 722 | 704 | 136.5 |
| B | 4 | 80 | 183834 | 1341.93 | 722 | 704 | 136.5 |
| B | 0 | 190 | 51581 | 372.81 | 722 | 704 | 136.5 |
| C | 10 | 22 | 1874056 | 12256.64 | 661 | 666 | 152.8 |
| C | 3 | 233 | 813048 | 5315.0 | 661 | 666 | 152.8 |
| C | 14 | 238 | 107984 | 702.13 | 661 | 666 | 152.8 |
| D | 8 | 195 | 344662 | 2096.67 | 697 | 679 | 164.1 |
| D | 2 | 250 | 84838 | 512.97 | 697 | 679 | 164.1 |
| D | 12 | 233 | 43007 | 258.0 | 697 | 679 | 164.1 |
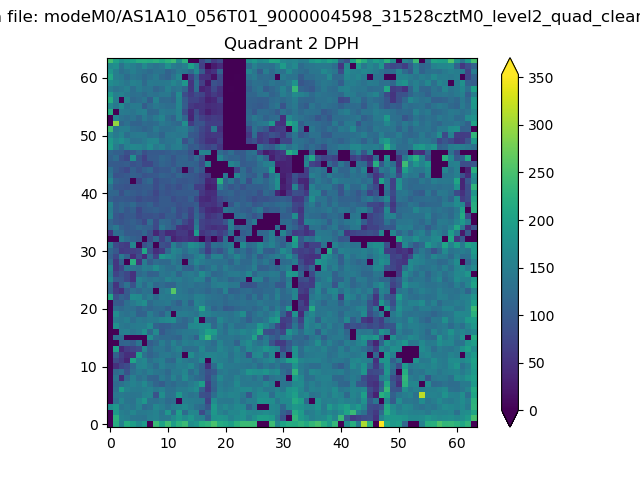
Histogram calculated using DETX and DETY for each event in the final _common_clean file
| Quadrant A | 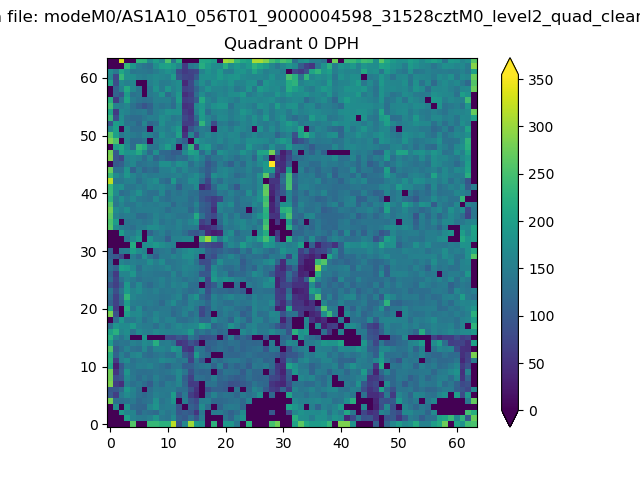 |
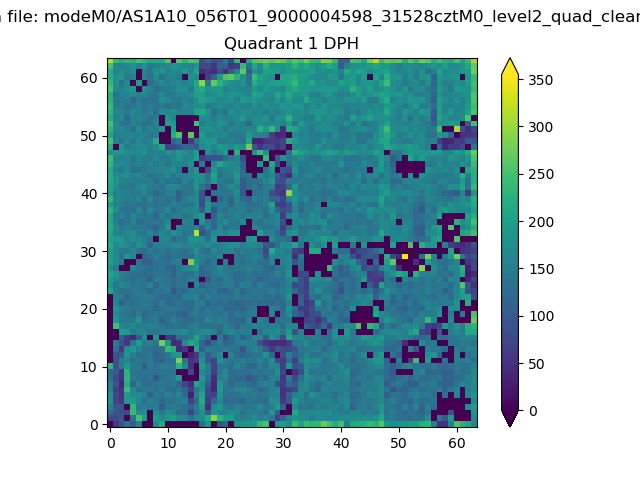 |
Quadrant B |
|---|---|---|---|
| Quadrant D | 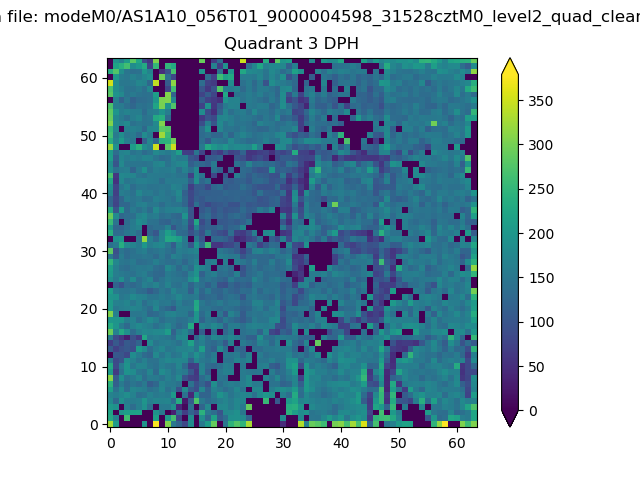 |
 |
Quadrant C |
| Plot type | Count rate plots | Images |
|---|---|---|
| Comparison with Poisson distribution Blue bars denote a histogram of data divided into 1 sec bins. Red curve is a Poisson curve with rate = median count rate of data. |
 |
 |
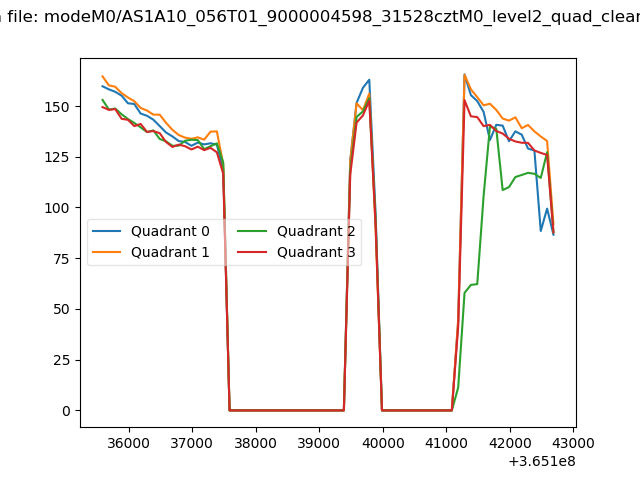
| Quadrant-wise count rates Data is divided into 100 sec bins |
 |
|
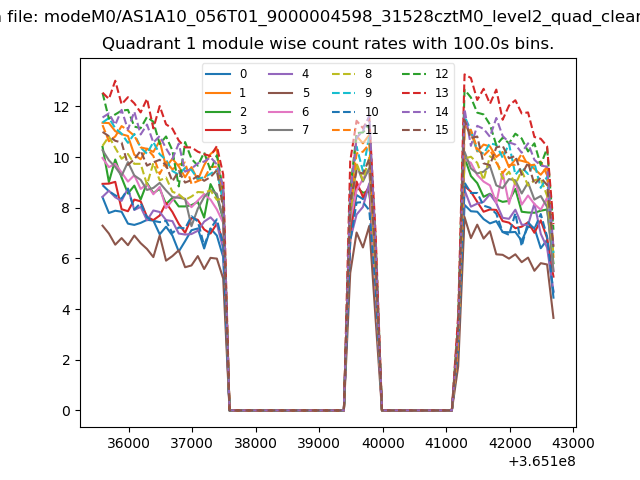
| Module-wise count rates for Quadrant A Data is divided into 100 sec bins |
 |
 |
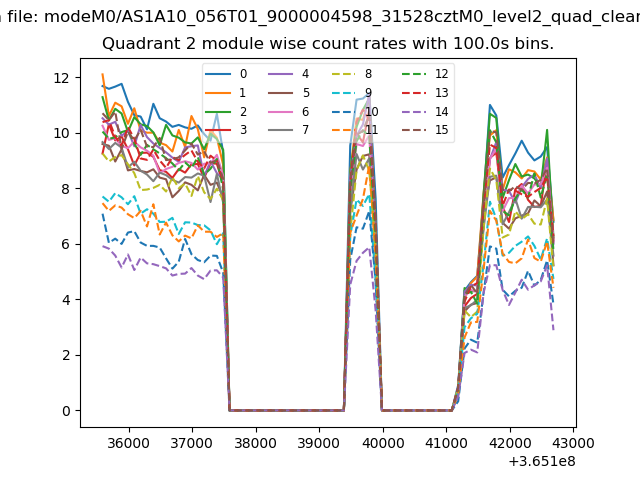
| Module-wise count rates for Quadrant B Data is divided into 100 sec bins |
 |
 |
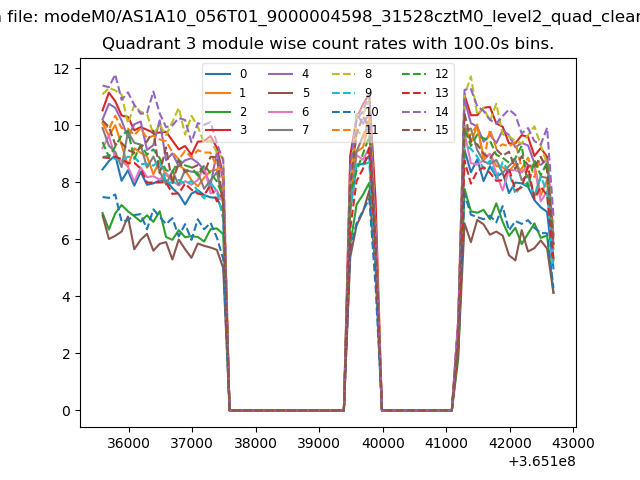
| Module-wise count rates for Quadrant C Data is divided into 100 sec bins |
 |
 |
| Module-wise count rates for Quadrant D Data is divided into 100 sec bins |
 |
 |
| Parameter | Plot |
|---|---|
| CZT HV Monitor | 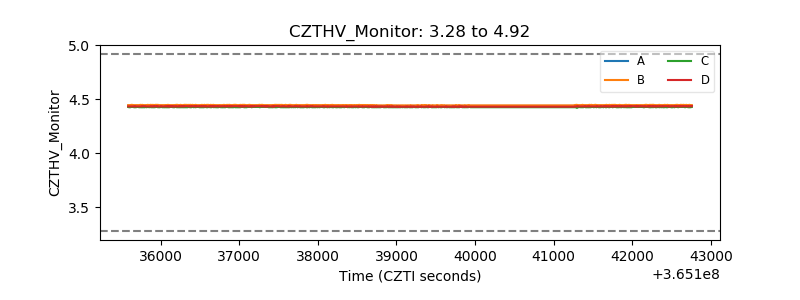 |
| D_VDD | 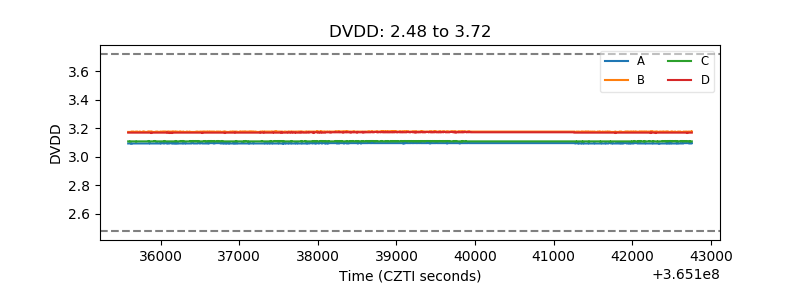 |
| Temperature 1 | 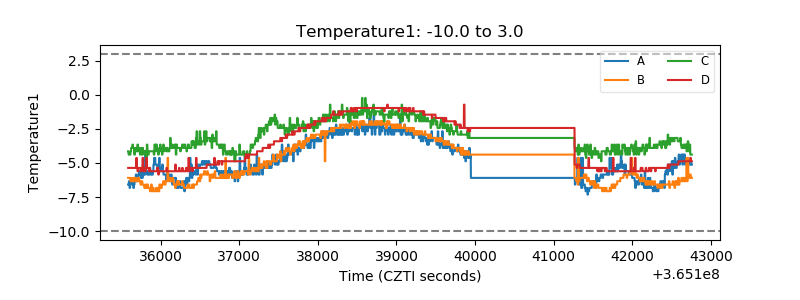 |
| Veto HV Monitor | 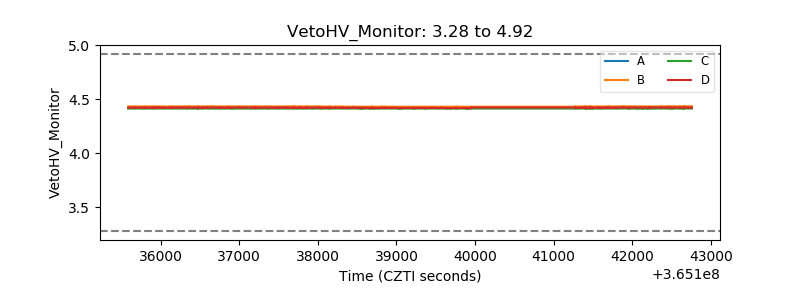 |
| Veto LLD | 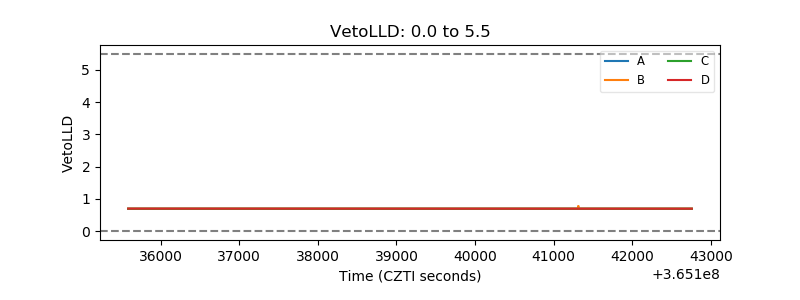 |
| Alpha Counter | 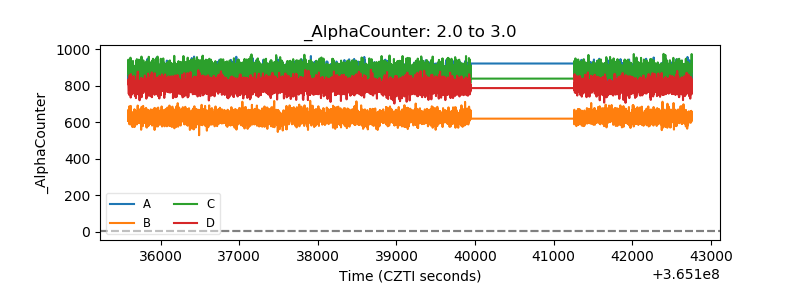 |
| _CPM_Rate | 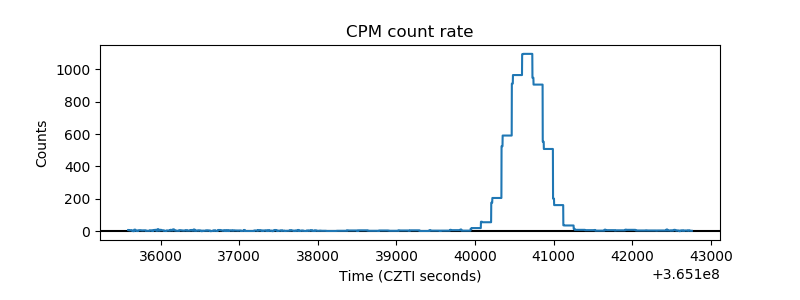 |
| CZT Counter | 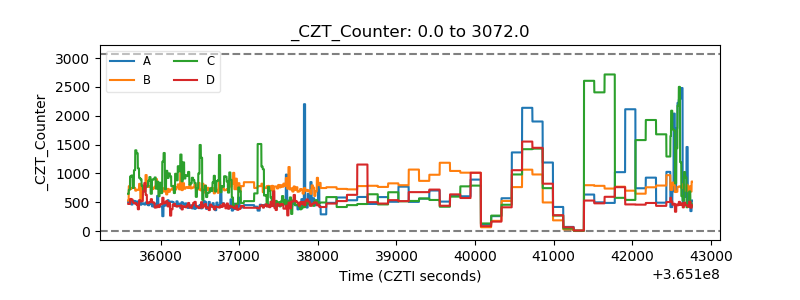 |
| +2.5 Volts monitor |  |
| +5 Volts monitor |  |
| _ROLL_ROT |  |
| _Roll_DEC |  |
| _Roll_RA | 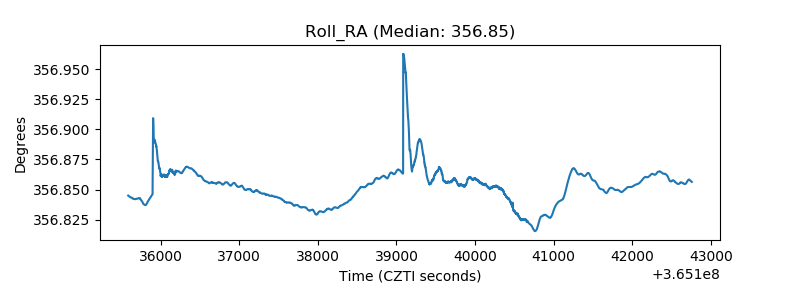 |
| Veto Counter |  |