| Param | Original file | Final file |
|---|---|---|
| Filename | modeM0/AS1A10_056T01_9000004598_31531cztM0_level2.evt | modeM0/AS1A10_056T01_9000004598_31531cztM0_level2_quad_clean.evt |
| Size (bytes) | 1,474,231,680 | 223,704,000 |
| Size | 1.4 GB | 213.3 MB |
| Events in quadrant A | 10,536,842 | 1,404,204 |
| Events in quadrant B | 13,392,023 | 1,434,413 |
| Events in quadrant C | 9,345,588 | 1,378,853 |
| Events in quadrant D | 10,211,819 | 1,369,860 |
| Mode M0 | |||
|---|---|---|---|
| Quadrant | BADHDUFLAG | Total packets | Discarded packets |
| A | 0 | 42702 | 4 |
| B | 0 | 52937 | 4 |
| C | 0 | 38344 | 5 |
| D | 0 | 41570 | 4 |
| Mode M9 | |||
|---|---|---|---|
| Quadrant | BADHDUFLAG | Total packets | Discarded packets |
| A | 0 | 18 | 0 |
| B | 0 | 18 | 0 |
| C | 0 | 18 | 0 |
| D | 0 | 18 | 0 |
| Mode SS | |||
|---|---|---|---|
| Quadrant | BADHDUFLAG | Total packets | Discarded packets |
| A | 0 | 350 | 0 |
| B | 0 | 350 | 0 |
| C | 0 | 350 | 0 |
| D | 0 | 350 | 0 |
| Quadrant | Total seconds | Saturated seconds | Saturation percentage |
|---|---|---|---|
| A | 17232 | 1000 | 5.803157% |
| B | 17233 | 669 | 3.882087% |
| C | 17232 | 570 | 3.307799% |
| D | 17232 | 409 | 2.373491% |
Noise dominated data is calculated using 1-second bins in cleaned event files. If a bin has >2000 counts, and if more than 50% of those come from <1% of pixels, then it is considered to be noise-dominated and hence unusable.
| Quadrant | # 1 sec bins | Bins with >0 counts | Bins with >2000 counts | High rate bins dominated by noise | Noise dominated (total time) | Noise dominated (detector-on time) | Marked lightcurve |
|---|---|---|---|---|---|---|---|
| A | 18917 | 17234 | 501 | 501 | 2.65% | 2.91% | 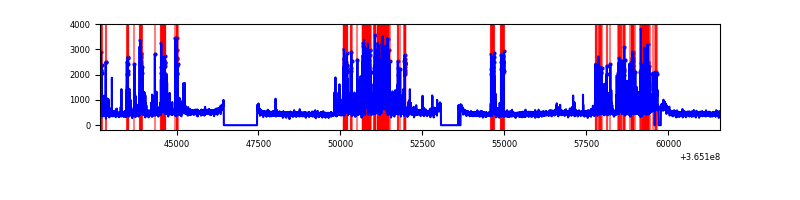 |
| B | 18918 | 17233 | 68 | 68 | 0.36% | 0.39% | 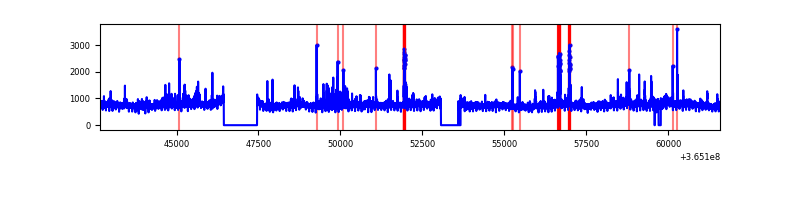 |
| C | 18917 | 17235 | 30 | 30 | 0.16% | 0.17% | 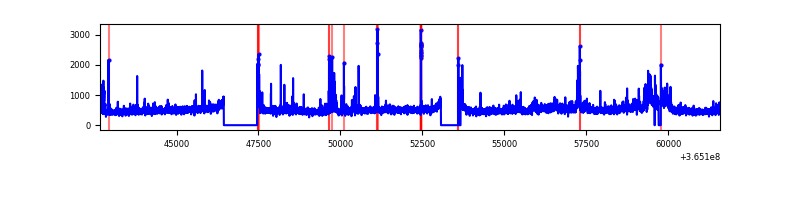 |
| D | 18917 | 17234 | 97 | 97 | 0.51% | 0.56% | 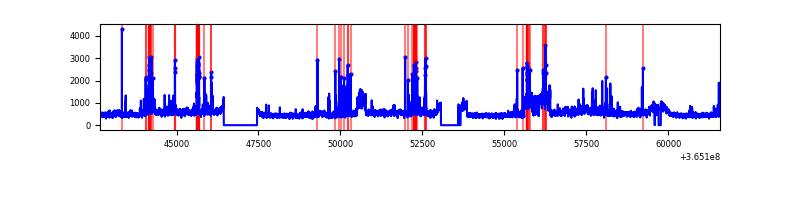 |
Top three noisy pixels from each quadrant. If the there are fewer than three noisy pixels in the level2.evt file, extra rows are filled as -1
| Pixel properties | Quadrant properties | ||||||
|---|---|---|---|---|---|---|---|
| Quadrant | DetID | PixID | Counts | Sigma | Mean | Median | Sigma |
| A | 0 | 13 | 2575322 | 6240.93 | 2063 | 2014 | 412.3 |
| A | 13 | 254 | 30623 | 69.38 | 2063 | 2014 | 412.3 |
| A | 3 | 137 | 21556 | 47.39 | 2063 | 2014 | 412.3 |
| B | 6 | 159 | 4573719 | 11704.98 | 2064 | 2013 | 390.6 |
| B | 4 | 80 | 200968 | 509.39 | 2064 | 2013 | 390.6 |
| B | 0 | 229 | 141562 | 357.29 | 2064 | 2013 | 390.6 |
| C | 3 | 233 | 791874 | 1717.89 | 1991 | 2002 | 459.8 |
| C | 14 | 238 | 322556 | 697.17 | 1991 | 2002 | 459.8 |
| C | 10 | 22 | 198845 | 428.11 | 1991 | 2002 | 459.8 |
| D | 8 | 195 | 1832300 | 3832.43 | 2027 | 1973 | 477.6 |
| D | 12 | 233 | 337865 | 703.31 | 2027 | 1973 | 477.6 |
| D | 2 | 250 | 269173 | 559.48 | 2027 | 1973 | 477.6 |
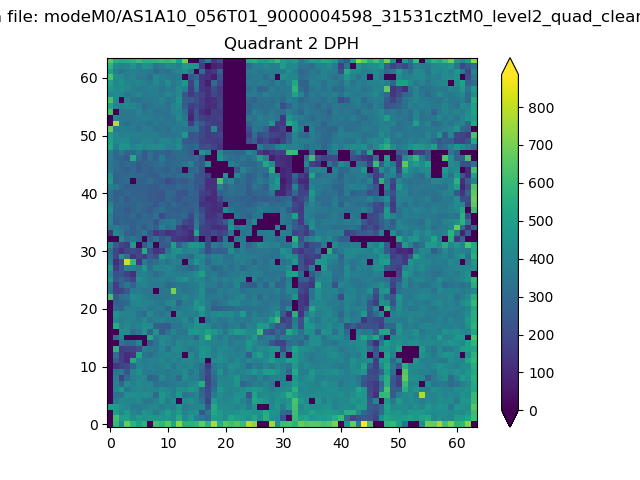
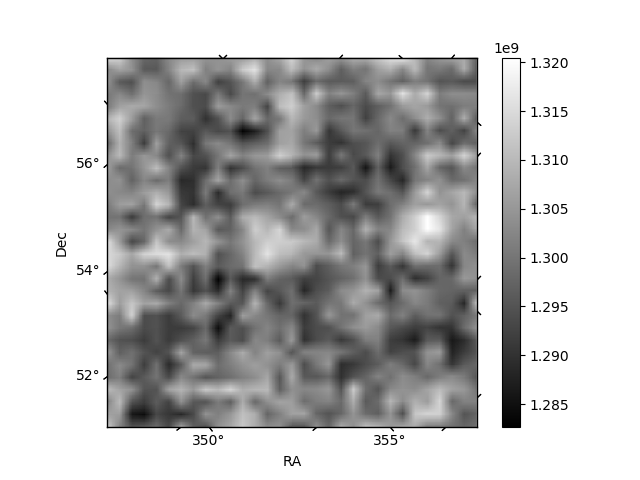
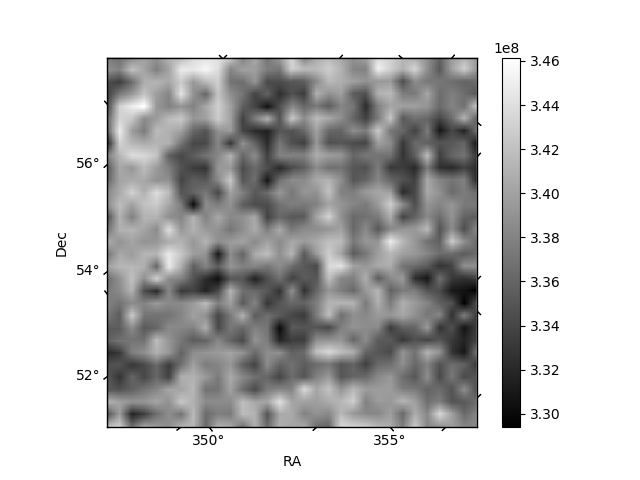
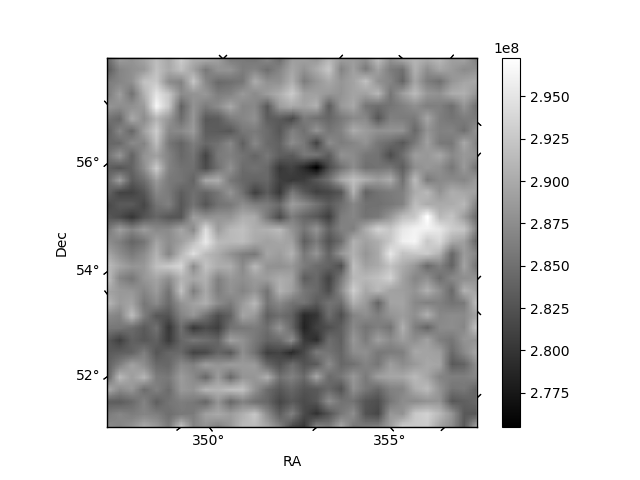
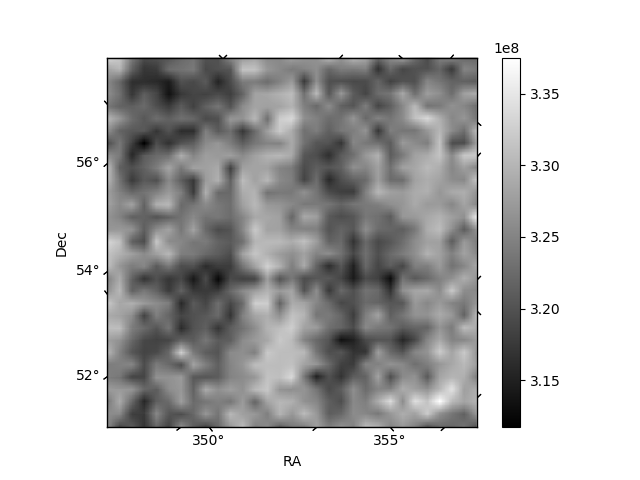
Histogram calculated using DETX and DETY for each event in the final _common_clean file
| Quadrant A | 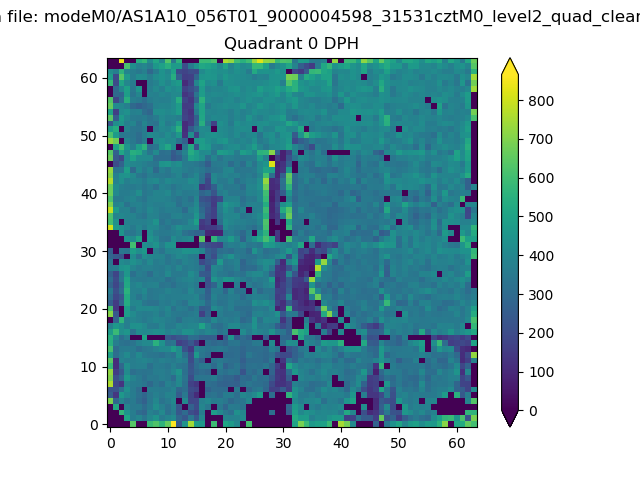 |
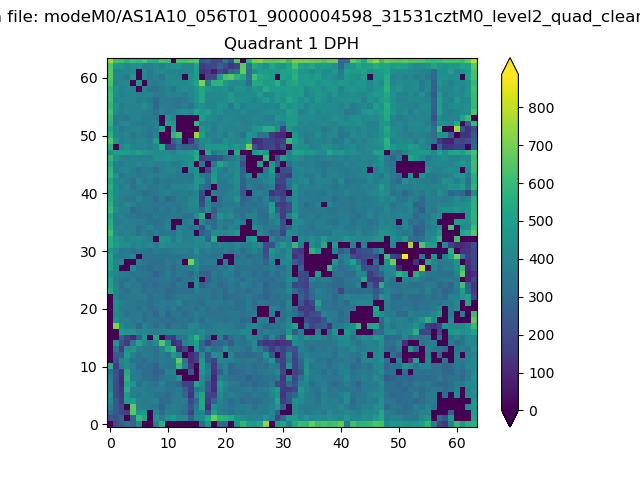 |
Quadrant B |
|---|---|---|---|
| Quadrant D | 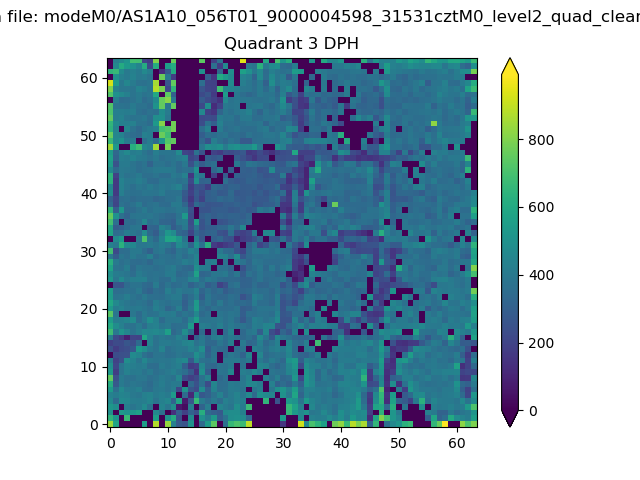 |
 |
Quadrant C |
| Plot type | Count rate plots | Images |
|---|---|---|
| Comparison with Poisson distribution Blue bars denote a histogram of data divided into 1 sec bins. Red curve is a Poisson curve with rate = median count rate of data. |
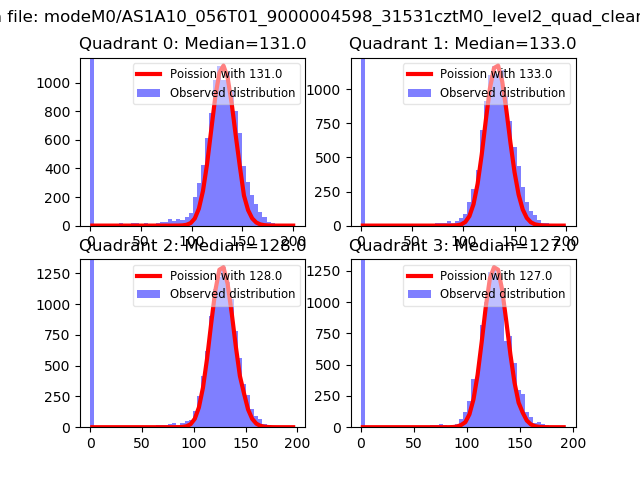 |
 |
| Quadrant-wise count rates Data is divided into 100 sec bins |
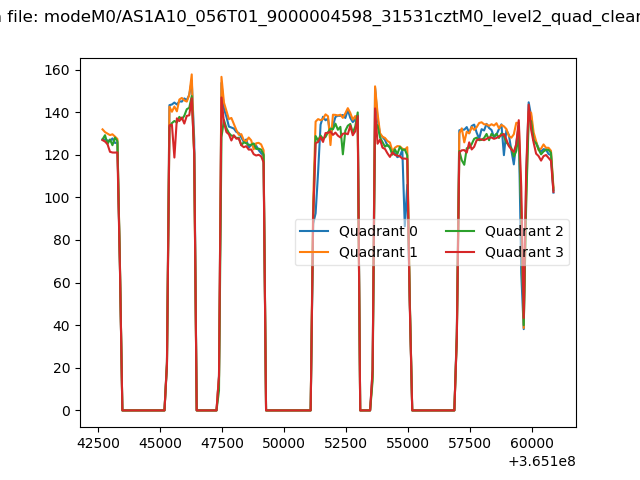 |
|
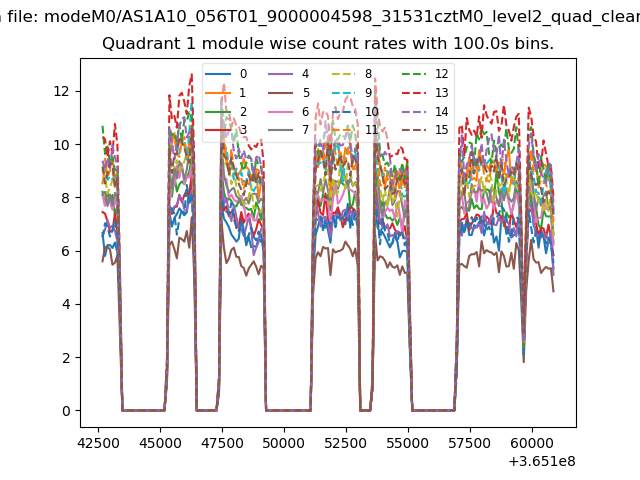
| Module-wise count rates for Quadrant A Data is divided into 100 sec bins |
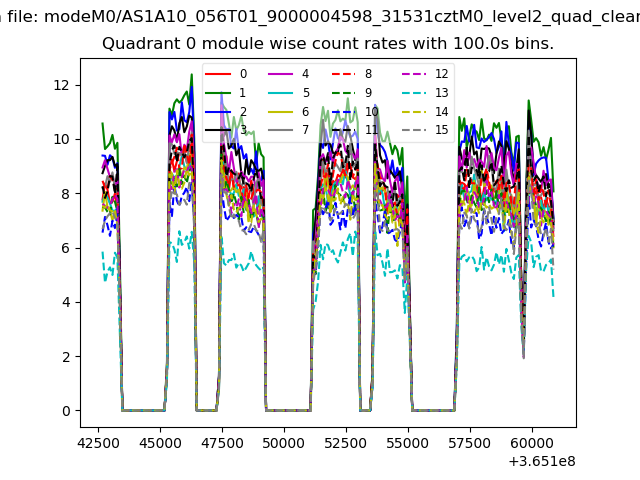 |
 |
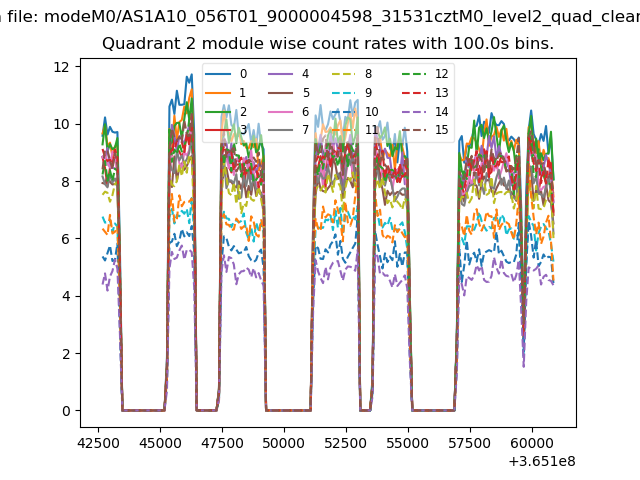
| Module-wise count rates for Quadrant B Data is divided into 100 sec bins |
 |
 |
| Module-wise count rates for Quadrant C Data is divided into 100 sec bins |
 |
 |
| Module-wise count rates for Quadrant D Data is divided into 100 sec bins |
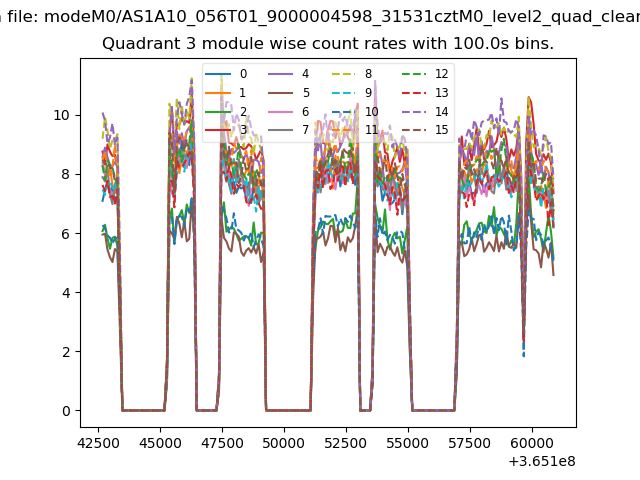 |
 |
| Parameter | Plot |
|---|---|
| CZT HV Monitor | 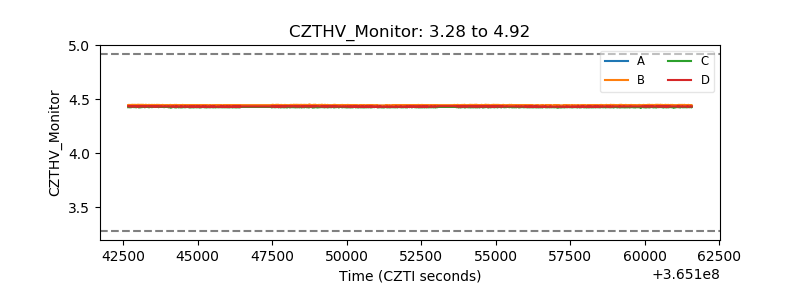 |
| D_VDD |  |
| Temperature 1 | 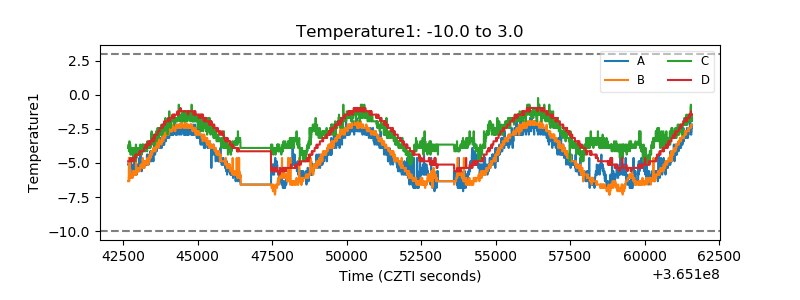 |
| Veto HV Monitor | 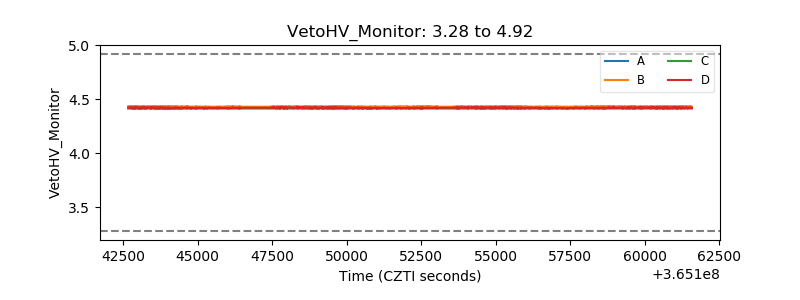 |
| Veto LLD | 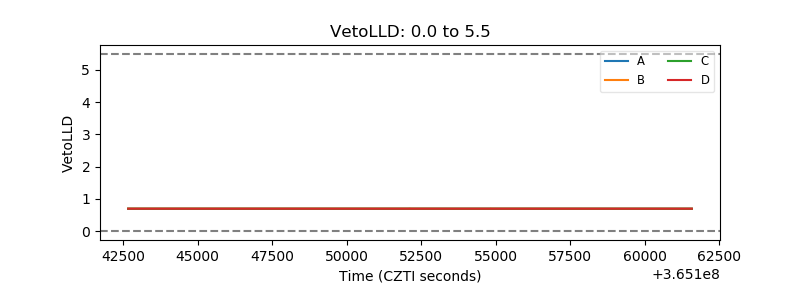 |
| Alpha Counter | 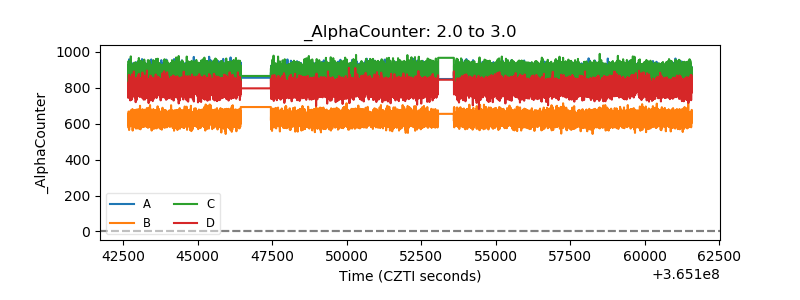 |
| _CPM_Rate | 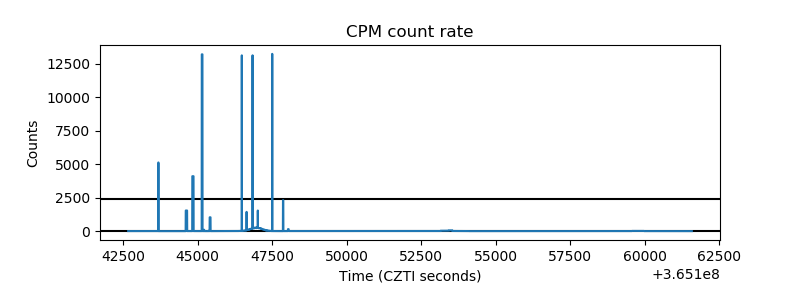 |
| CZT Counter | 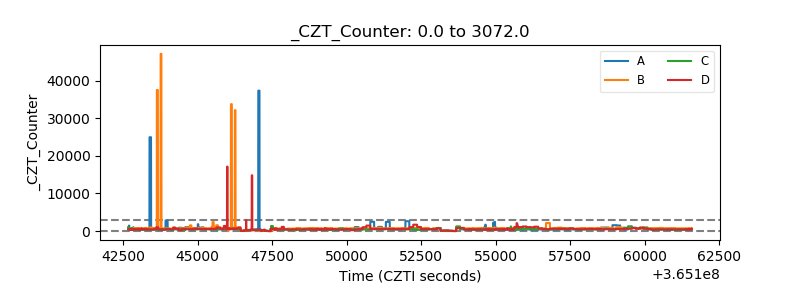 |
| +2.5 Volts monitor |  |
| +5 Volts monitor | 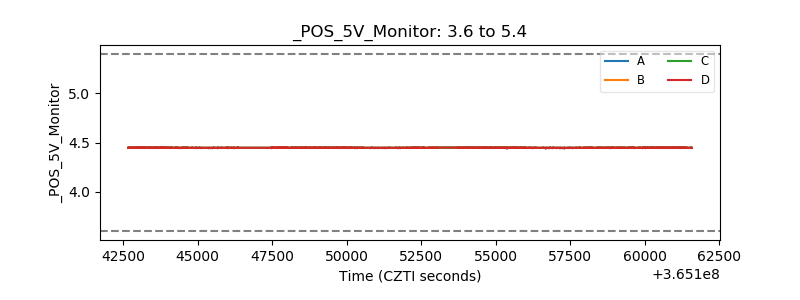 |
| _ROLL_ROT | 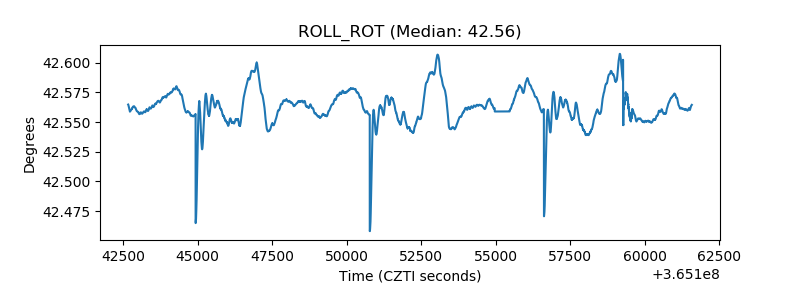 |
| _Roll_DEC | 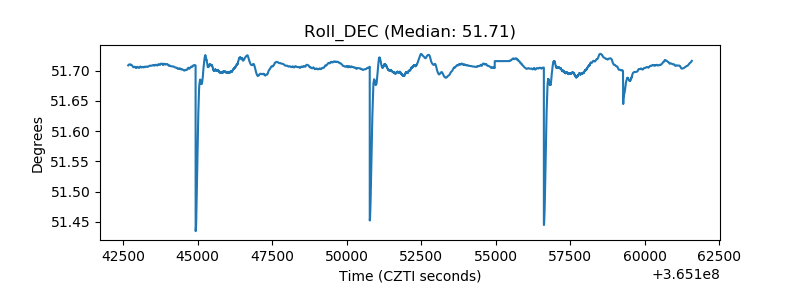 |
| _Roll_RA | 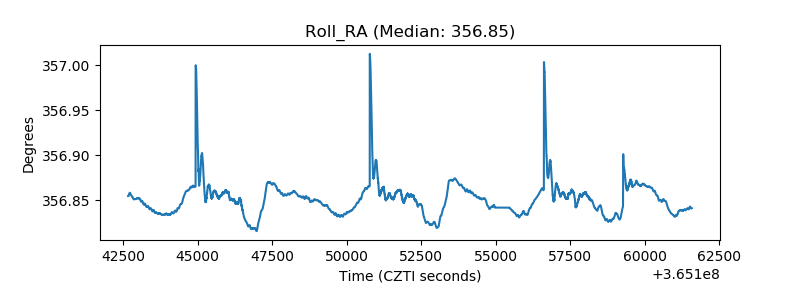 |
| Veto Counter | 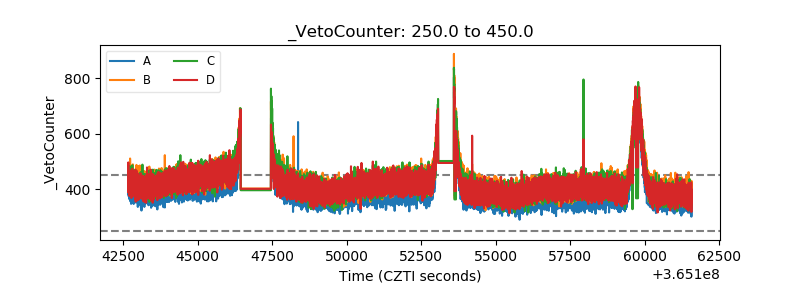 |