| Param | Original file | Final file |
|---|---|---|
| Filename | modeM0/AS1A10_056T01_9000004598_31532cztM0_level2.evt | modeM0/AS1A10_056T01_9000004598_31532cztM0_level2_quad_clean.evt |
| Size (bytes) | 616,728,960 | 85,150,080 |
| Size | 588.2 MB | 81.2 MB |
| Events in quadrant A | 4,329,715 | 507,611 |
| Events in quadrant B | 5,461,513 | 537,008 |
| Events in quadrant C | 4,603,413 | 514,197 |
| Events in quadrant D | 3,793,637 | 515,962 |
| Mode M0 | |||
|---|---|---|---|
| Quadrant | BADHDUFLAG | Total packets | Discarded packets |
| A | 0 | 17681 | 1 |
| B | 0 | 21945 | 1 |
| C | 0 | 18593 | 1 |
| D | 0 | 15873 | 1 |
| Mode M9 | |||
|---|---|---|---|
| Quadrant | BADHDUFLAG | Total packets | Discarded packets |
| A | 0 | 2 | 0 |
| B | 0 | 2 | 0 |
| C | 0 | 2 | 0 |
| D | 0 | 2 | 0 |
| Mode SS | |||
|---|---|---|---|
| Quadrant | BADHDUFLAG | Total packets | Discarded packets |
| A | 0 | 148 | 0 |
| B | 0 | 148 | 0 |
| C | 0 | 148 | 0 |
| D | 0 | 148 | 0 |
| Quadrant | Total seconds | Saturated seconds | Saturation percentage |
|---|---|---|---|
| A | 7228 | 593 | 8.204206% |
| B | 7228 | 280 | 3.873824% |
| C | 7229 | 307 | 4.246784% |
| D | 7229 | 192 | 2.655969% |
Noise dominated data is calculated using 1-second bins in cleaned event files. If a bin has >2000 counts, and if more than 50% of those come from <1% of pixels, then it is considered to be noise-dominated and hence unusable.
| Quadrant | # 1 sec bins | Bins with >0 counts | Bins with >2000 counts | High rate bins dominated by noise | Noise dominated (total time) | Noise dominated (detector-on time) | Marked lightcurve |
|---|---|---|---|---|---|---|---|
| A | 7388 | 7228 | 348 | 348 | 4.71% | 4.81% | 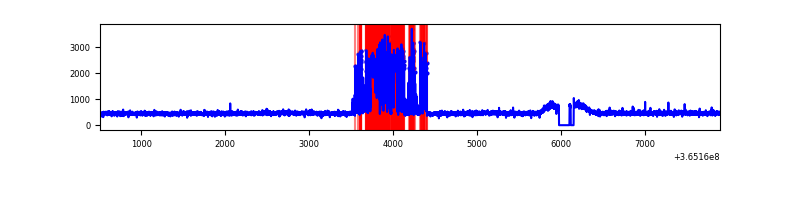 |
| B | 7388 | 7228 | 0 | 0 | 0.00% | 0.00% | 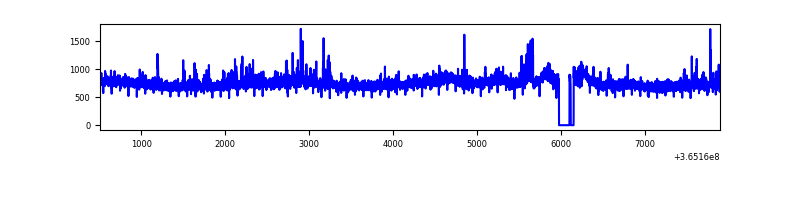 |
| C | 7389 | 7229 | 18 | 18 | 0.24% | 0.25% | 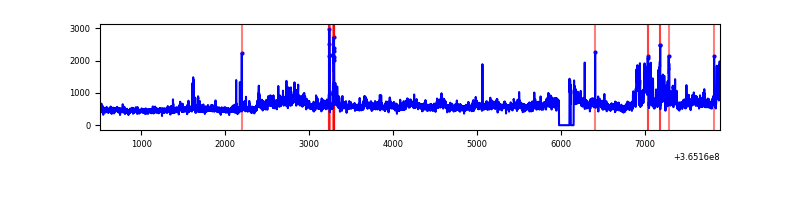 |
| D | 7389 | 7229 | 10 | 10 | 0.14% | 0.14% | 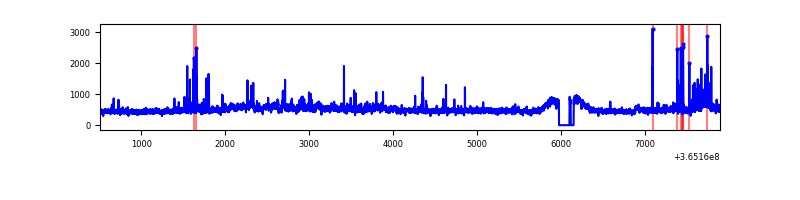 |
Top three noisy pixels from each quadrant. If the there are fewer than three noisy pixels in the level2.evt file, extra rows are filled as -1
| Pixel properties | Quadrant properties | ||||||
|---|---|---|---|---|---|---|---|
| Quadrant | DetID | PixID | Counts | Sigma | Mean | Median | Sigma |
| A | 0 | 13 | 1045156 | 6089.82 | 851 | 831 | 171.5 |
| A | 13 | 254 | 12956 | 70.7 | 851 | 831 | 171.5 |
| A | 3 | 137 | 9074 | 48.06 | 851 | 831 | 171.5 |
| B | 6 | 159 | 1872551 | 11237.33 | 857 | 835 | 166.6 |
| B | 4 | 80 | 120787 | 720.16 | 857 | 835 | 166.6 |
| B | 0 | 190 | 54823 | 324.13 | 857 | 835 | 166.6 |
| C | 3 | 233 | 1135099 | 5833.07 | 824 | 825 | 194.5 |
| C | 14 | 238 | 132881 | 679.11 | 824 | 825 | 194.5 |
| C | 10 | 22 | 68082 | 345.87 | 824 | 825 | 194.5 |
| D | 8 | 195 | 415952 | 2068.04 | 842 | 817 | 200.7 |
| D | 2 | 250 | 85180 | 420.26 | 842 | 817 | 200.7 |
| D | 12 | 233 | 71201 | 350.63 | 842 | 817 | 200.7 |
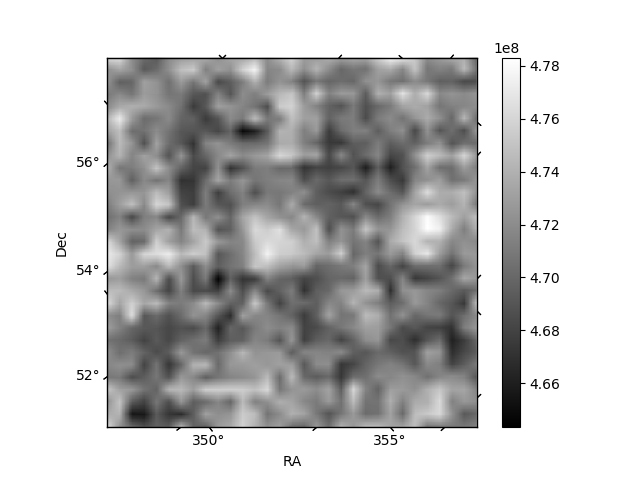
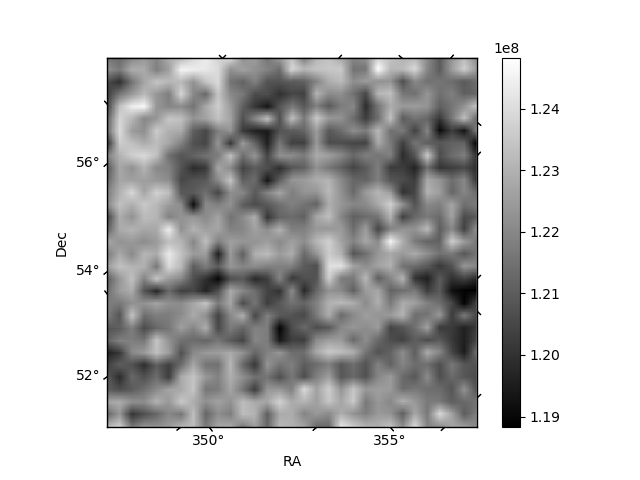
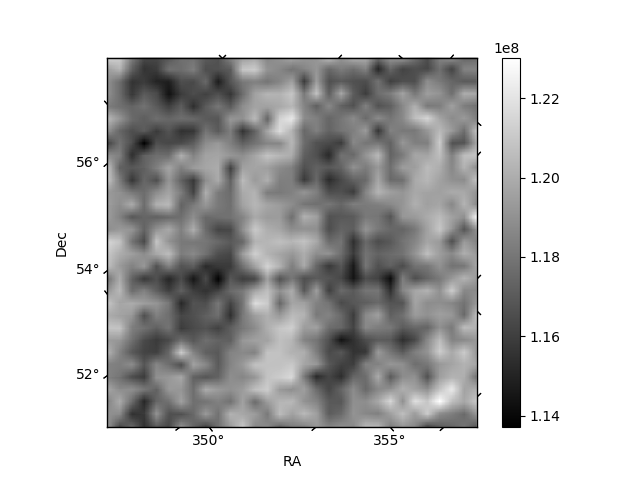
Histogram calculated using DETX and DETY for each event in the final _common_clean file
| Quadrant A | 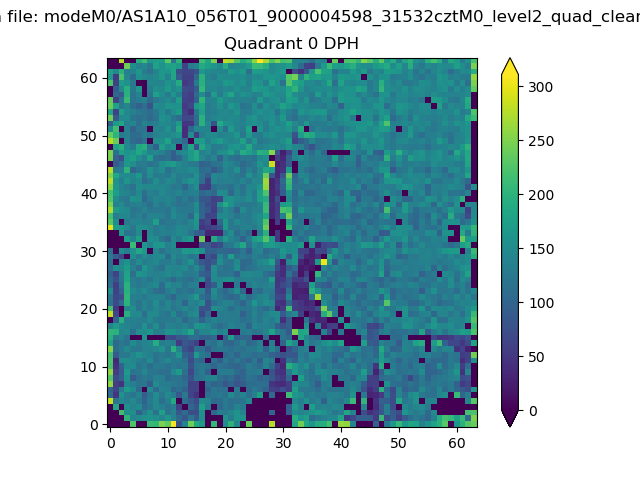 |
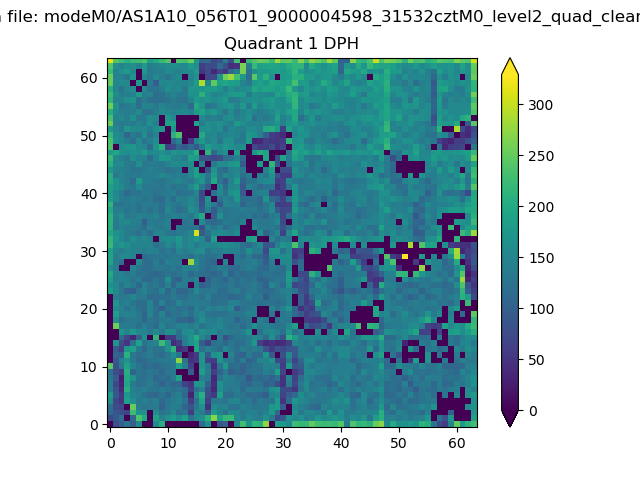 |
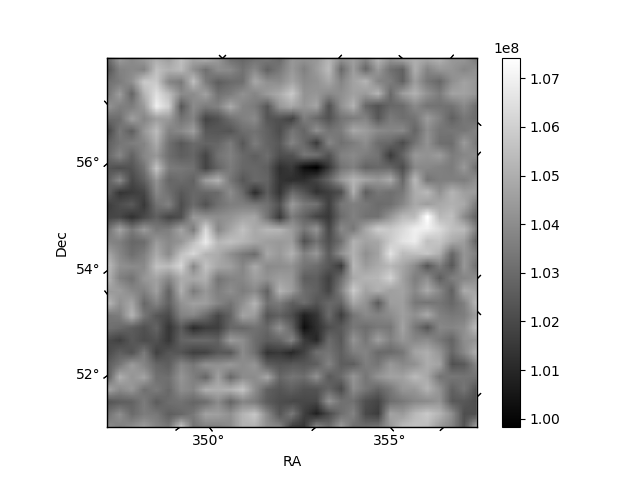
Quadrant B |
|---|---|---|---|
| Quadrant D | 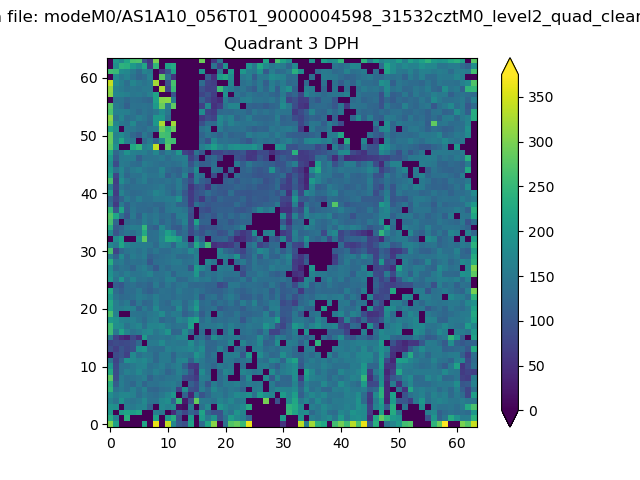 |
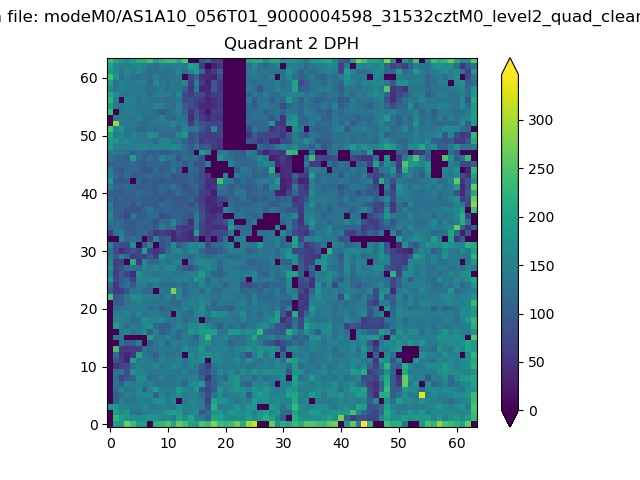 |
Quadrant C |
| Plot type | Count rate plots | Images |
|---|---|---|
| Comparison with Poisson distribution Blue bars denote a histogram of data divided into 1 sec bins. Red curve is a Poisson curve with rate = median count rate of data. |
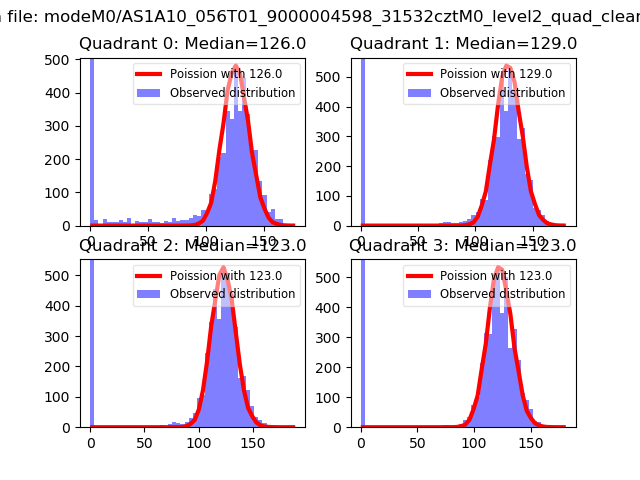 |
 |
| Quadrant-wise count rates Data is divided into 100 sec bins |
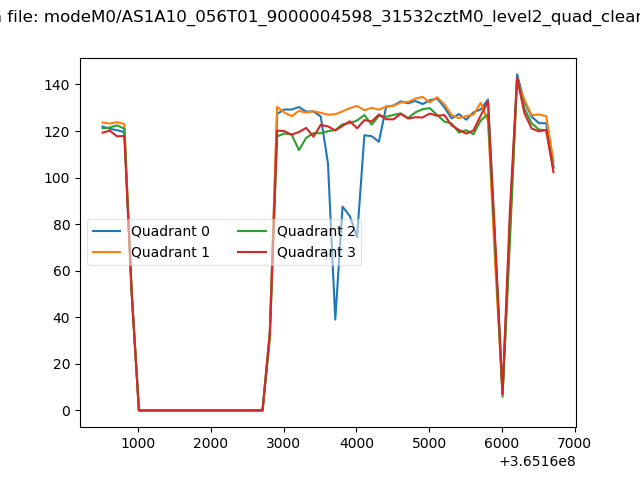 |
|
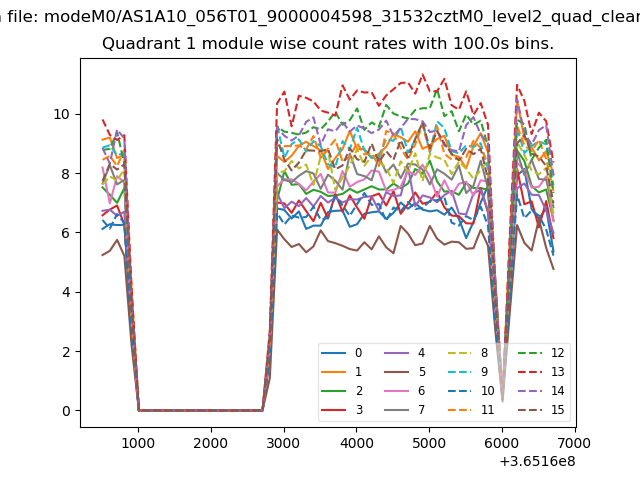
| Module-wise count rates for Quadrant A Data is divided into 100 sec bins |
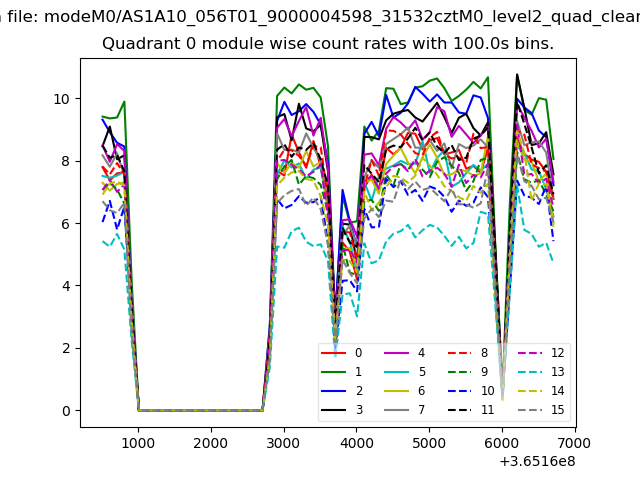 |
 |
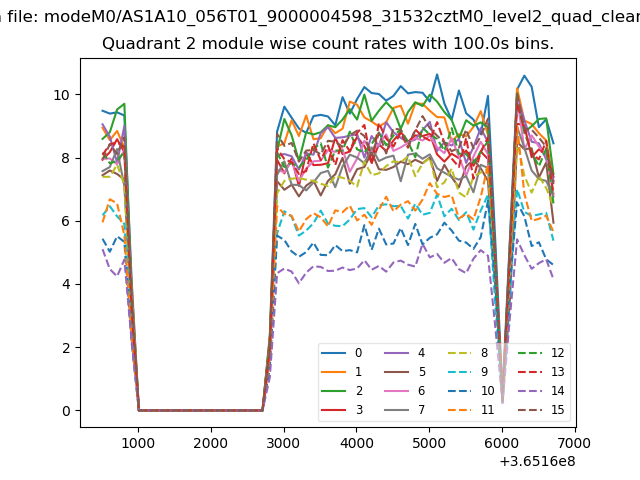
| Module-wise count rates for Quadrant B Data is divided into 100 sec bins |
 |
 |
| Module-wise count rates for Quadrant C Data is divided into 100 sec bins |
 |
 |
| Module-wise count rates for Quadrant D Data is divided into 100 sec bins |
 |
 |
| Parameter | Plot |
|---|---|
| CZT HV Monitor | 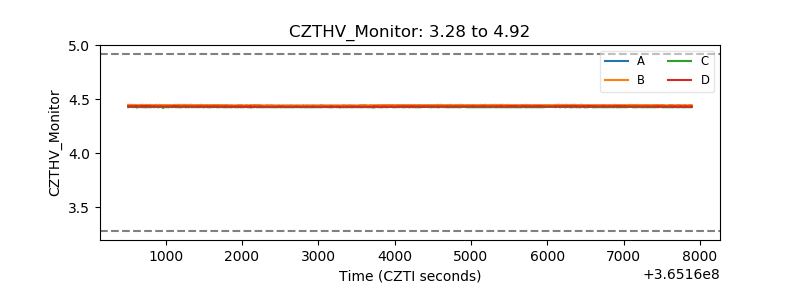 |
| D_VDD |  |
| Temperature 1 |  |
| Veto HV Monitor | 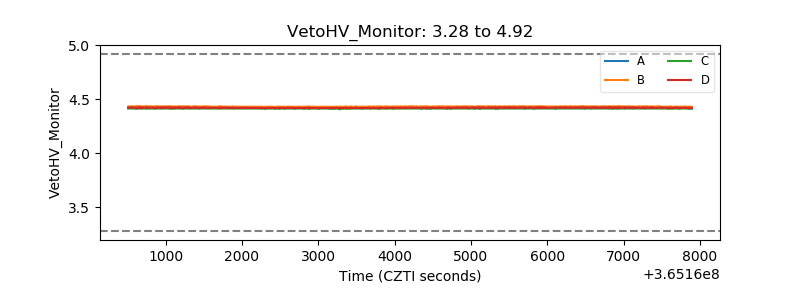 |
| Veto LLD | 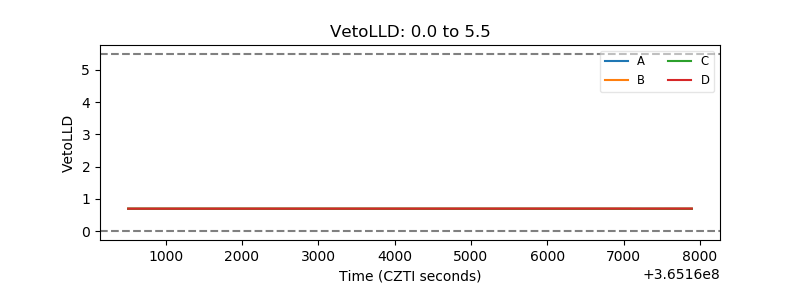 |
| Alpha Counter | 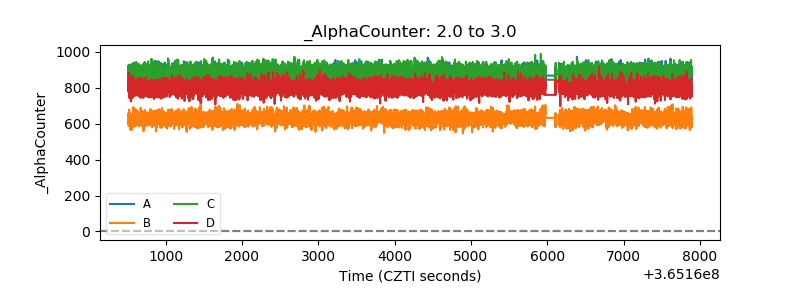 |
| _CPM_Rate | 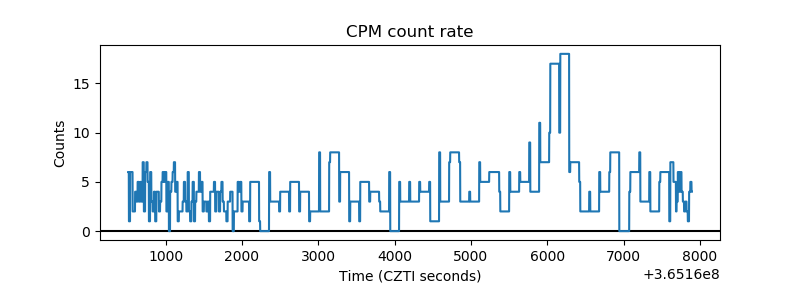 |
| CZT Counter | 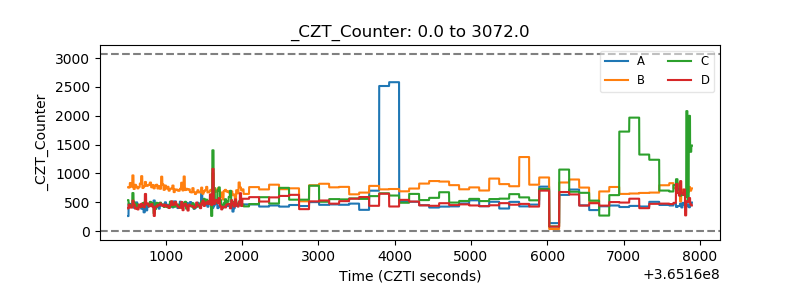 |
| +2.5 Volts monitor |  |
| +5 Volts monitor |  |
| _ROLL_ROT | 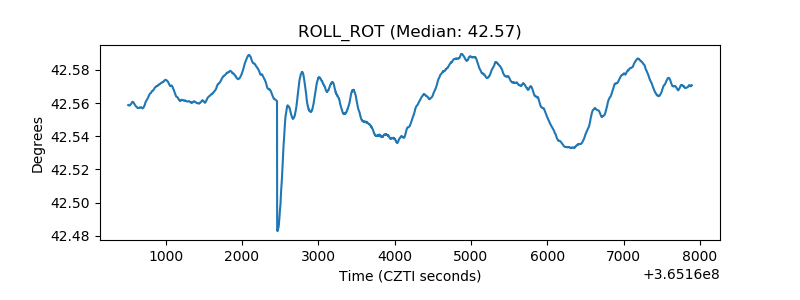 |
| _Roll_DEC | 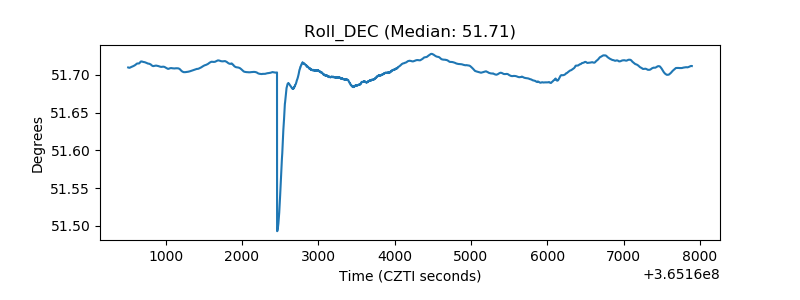 |
| _Roll_RA | 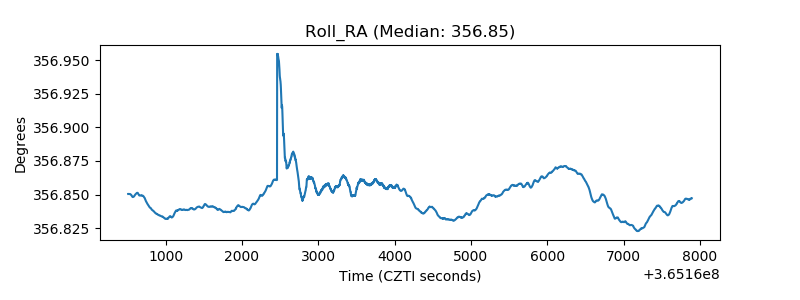 |
| Veto Counter | 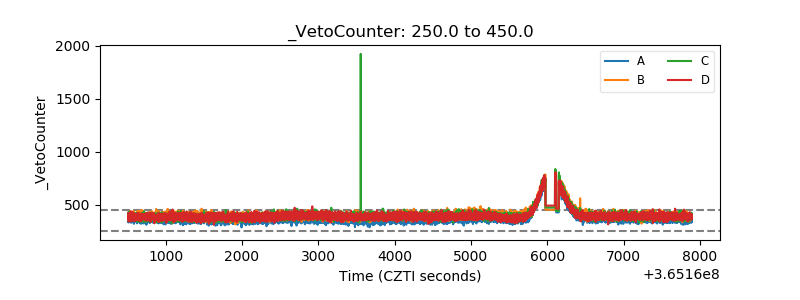 |