| Param | Original file | Final file |
|---|---|---|
| Filename | modeM0/AS1A10_056T01_9000004598_31535cztM0_level2.evt | modeM0/AS1A10_056T01_9000004598_31535cztM0_level2_quad_clean.evt |
| Size (bytes) | 1,589,080,320 | 239,569,920 |
| Size | 1.5 GB | 228.5 MB |
| Events in quadrant A | 8,691,341 | 1,537,448 |
| Events in quadrant B | 14,341,031 | 1,529,973 |
| Events in quadrant C | 10,690,506 | 1,458,199 |
| Events in quadrant D | 13,144,241 | 1,442,949 |
| Mode M0 | |||
|---|---|---|---|
| Quadrant | BADHDUFLAG | Total packets | Discarded packets |
| A | 0 | 38184 | 4 |
| B | 0 | 56874 | 4 |
| C | 0 | 43669 | 4 |
| D | 0 | 52350 | 9 |
| Mode M9 | |||
|---|---|---|---|
| Quadrant | BADHDUFLAG | Total packets | Discarded packets |
| A | 0 | 19 | 0 |
| B | 0 | 19 | 0 |
| C | 0 | 19 | 0 |
| D | 0 | 19 | 0 |
| Mode SS | |||
|---|---|---|---|
| Quadrant | BADHDUFLAG | Total packets | Discarded packets |
| A | 0 | 382 | 0 |
| B | 0 | 382 | 0 |
| C | 0 | 382 | 0 |
| D | 0 | 382 | 0 |
| Quadrant | Total seconds | Saturated seconds | Saturation percentage |
|---|---|---|---|
| A | 18679 | 275 | 1.472242% |
| B | 18680 | 476 | 2.548180% |
| C | 18680 | 610 | 3.265525% |
| D | 18679 | 387 | 2.071845% |
Noise dominated data is calculated using 1-second bins in cleaned event files. If a bin has >2000 counts, and if more than 50% of those come from <1% of pixels, then it is considered to be noise-dominated and hence unusable.
| Quadrant | # 1 sec bins | Bins with >0 counts | Bins with >2000 counts | High rate bins dominated by noise | Noise dominated (total time) | Noise dominated (detector-on time) | Marked lightcurve |
|---|---|---|---|---|---|---|---|
| A | 20539 | 18679 | 0 | 0 | 0.00% | 0.00% | 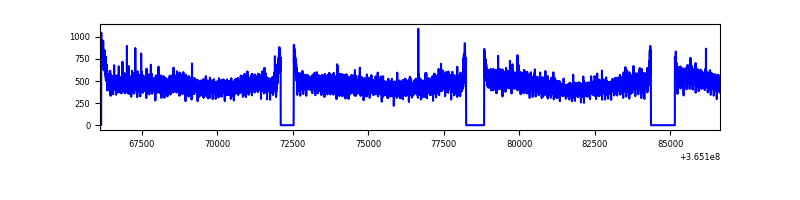 |
| B | 20540 | 18680 | 8 | 8 | 0.04% | 0.04% | 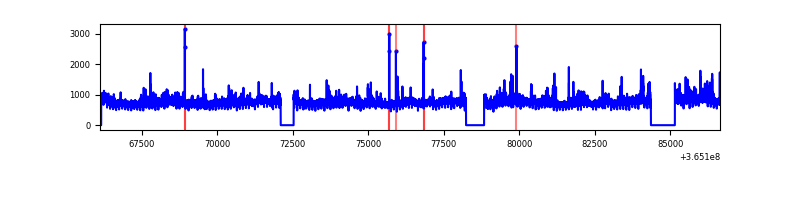 |
| C | 20540 | 18680 | 87 | 87 | 0.42% | 0.47% | 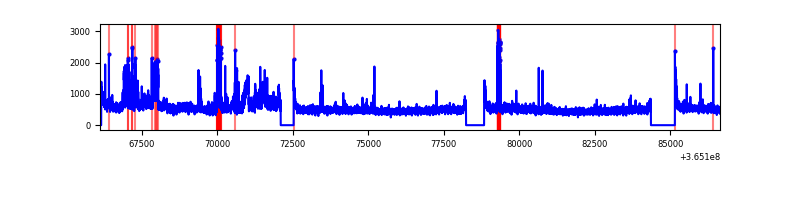 |
| D | 20539 | 18679 | 112 | 112 | 0.55% | 0.60% | 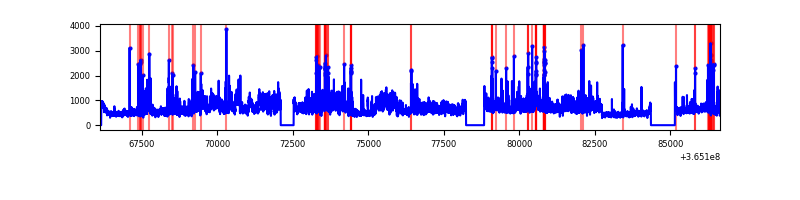 |
Top three noisy pixels from each quadrant. If the there are fewer than three noisy pixels in the level2.evt file, extra rows are filled as -1
| Pixel properties | Quadrant properties | ||||||
|---|---|---|---|---|---|---|---|
| Quadrant | DetID | PixID | Counts | Sigma | Mean | Median | Sigma |
| A | 13 | 254 | 34322 | 71.29 | 2250 | 2200 | 450.6 |
| A | 3 | 137 | 23598 | 47.49 | 2250 | 2200 | 450.6 |
| A | 0 | 226 | 18937 | 37.15 | 2250 | 2200 | 450.6 |
| B | 6 | 159 | 5026950 | 11839.65 | 2221 | 2162 | 424.4 |
| B | 4 | 80 | 347212 | 813.02 | 2221 | 2162 | 424.4 |
| B | 0 | 190 | 95115 | 219.02 | 2221 | 2162 | 424.4 |
| C | 3 | 233 | 1013219 | 2017.72 | 2135 | 2135 | 501.1 |
| C | 10 | 22 | 814972 | 1622.1 | 2135 | 2135 | 501.1 |
| C | 14 | 238 | 345235 | 684.69 | 2135 | 2135 | 501.1 |
| D | 8 | 195 | 4110801 | 7941.95 | 2169 | 2105 | 517.3 |
| D | 2 | 250 | 332817 | 639.25 | 2169 | 2105 | 517.3 |
| D | 13 | 249 | 225778 | 432.35 | 2169 | 2105 | 517.3 |
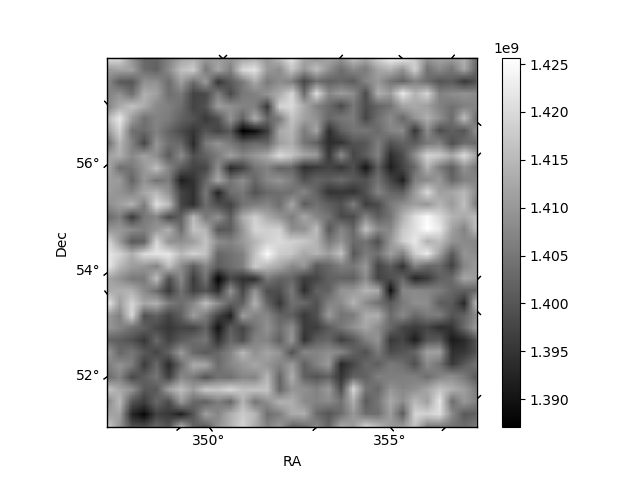
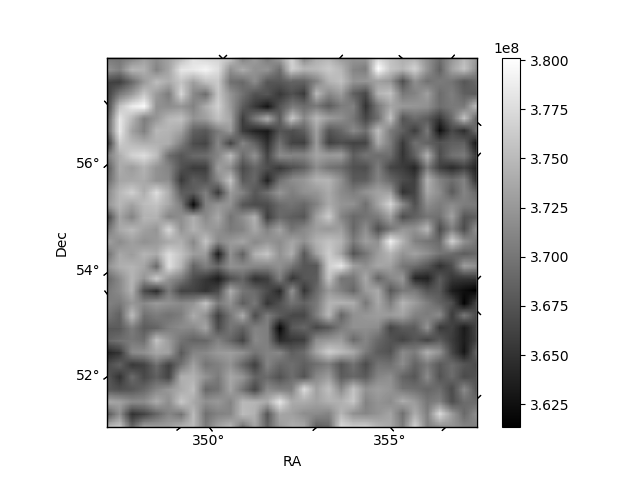
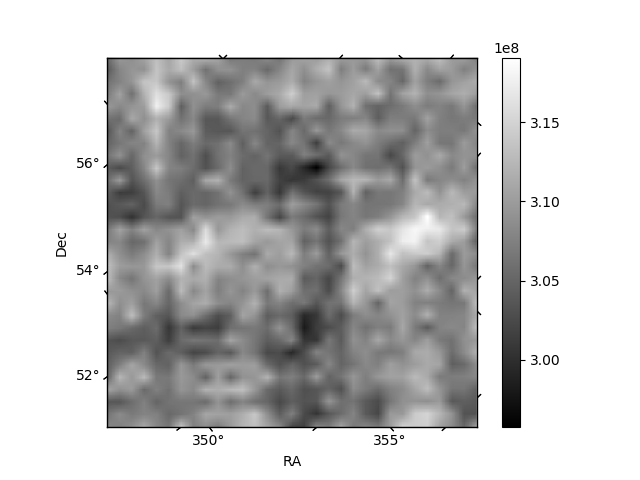
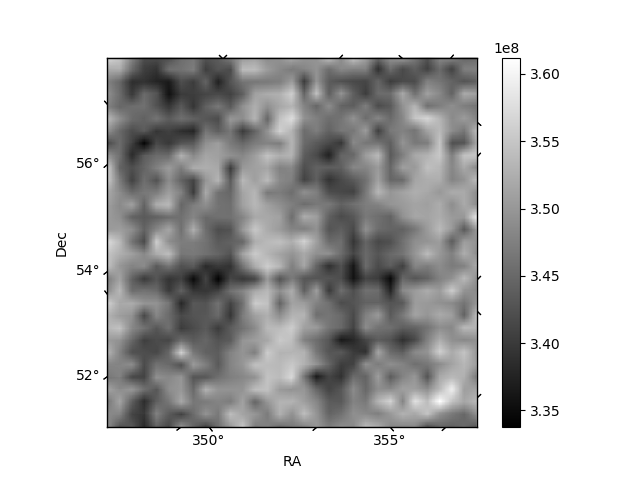
Histogram calculated using DETX and DETY for each event in the final _common_clean file
| Quadrant A | 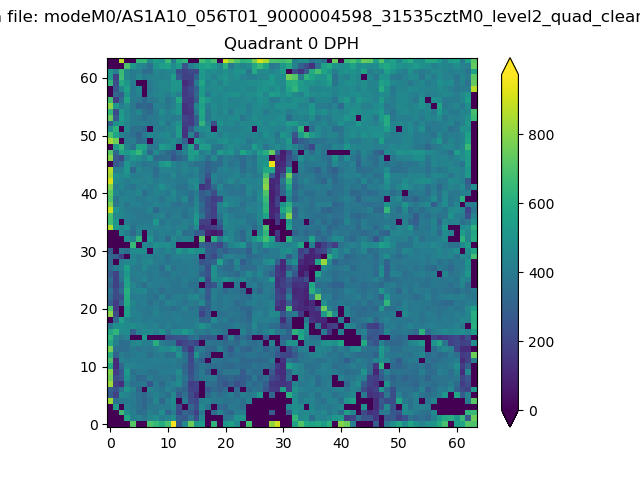 |
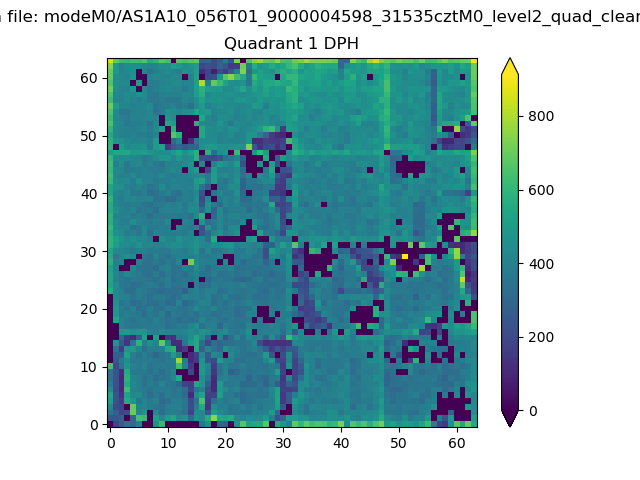 |
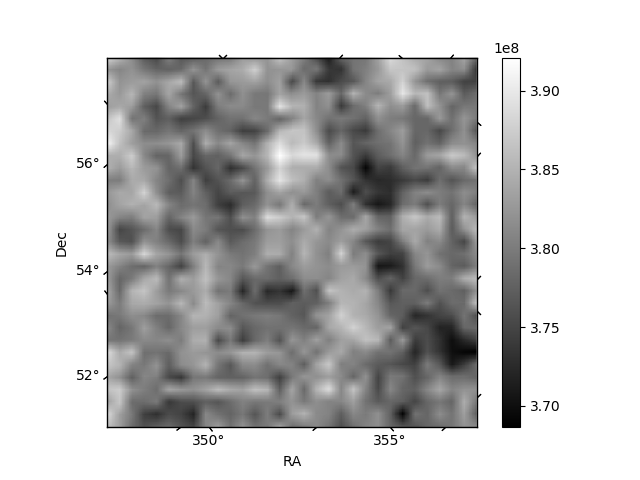
Quadrant B |
|---|---|---|---|
| Quadrant D | 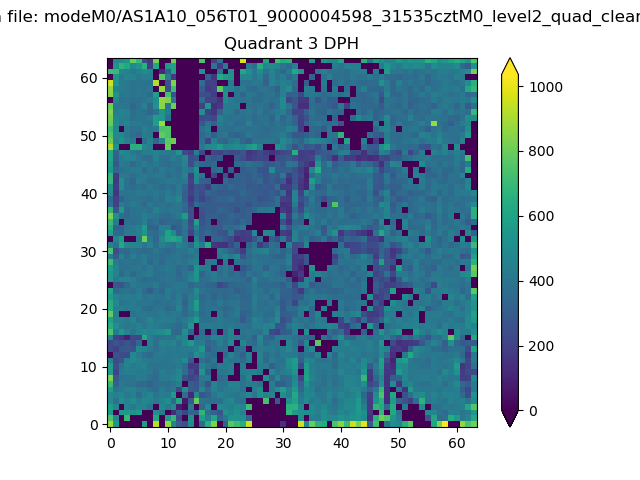 |
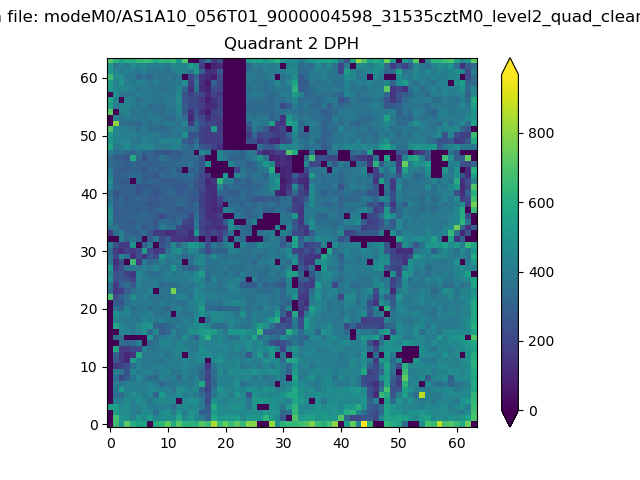 |
Quadrant C |
| Plot type | Count rate plots | Images |
|---|---|---|
| Comparison with Poisson distribution Blue bars denote a histogram of data divided into 1 sec bins. Red curve is a Poisson curve with rate = median count rate of data. |
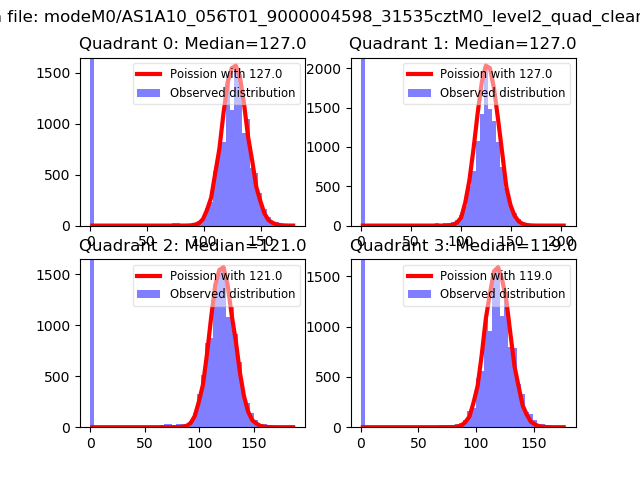 |
 |
| Quadrant-wise count rates Data is divided into 100 sec bins |
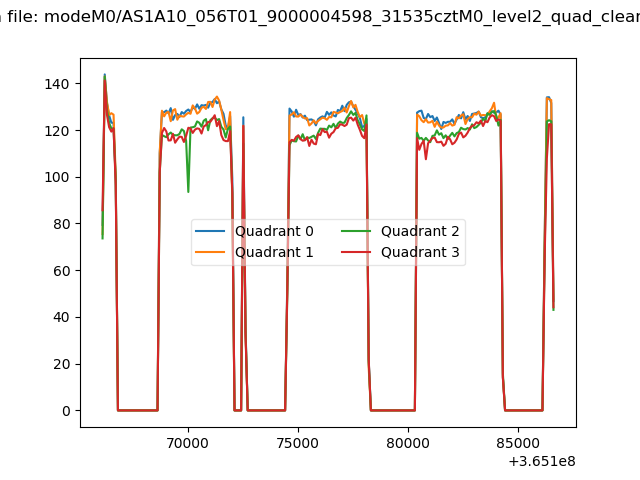 |
|
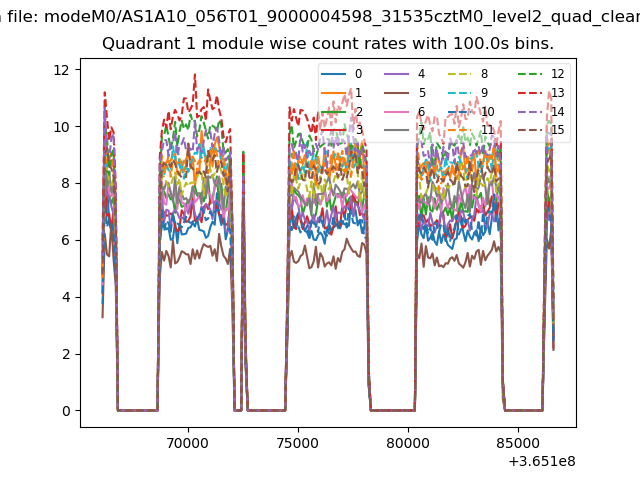
| Module-wise count rates for Quadrant A Data is divided into 100 sec bins |
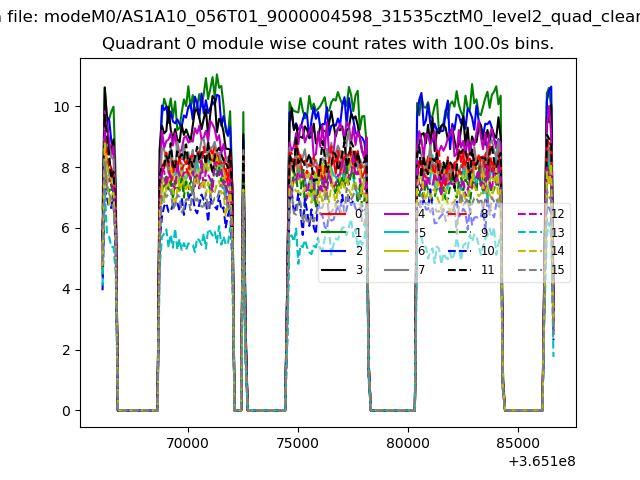 |
 |
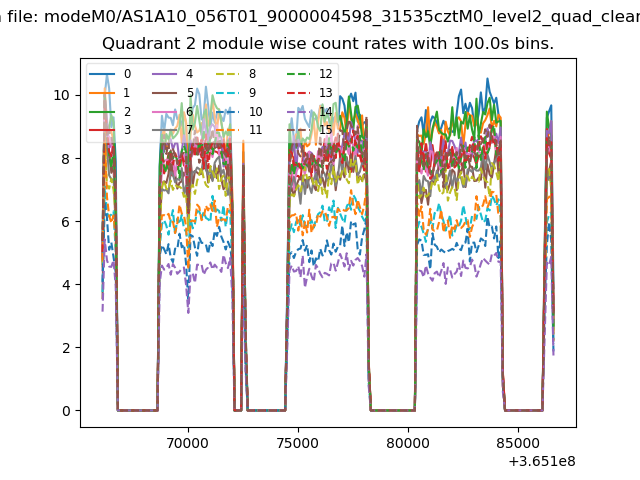
| Module-wise count rates for Quadrant B Data is divided into 100 sec bins |
 |
 |
| Module-wise count rates for Quadrant C Data is divided into 100 sec bins |
 |
 |
| Module-wise count rates for Quadrant D Data is divided into 100 sec bins |
 |
 |
| Parameter | Plot |
|---|---|
| CZT HV Monitor | 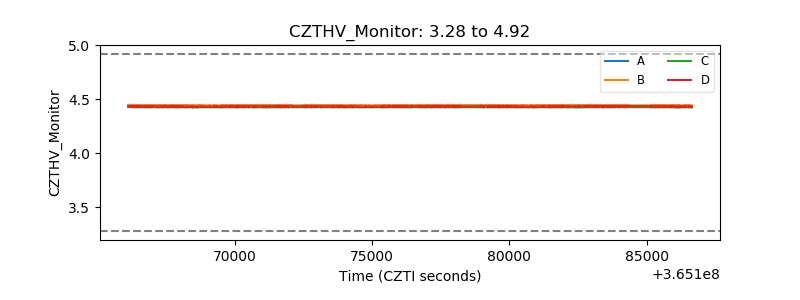 |
| D_VDD | 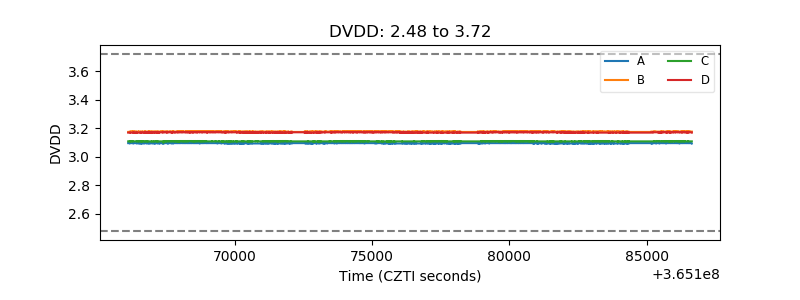 |
| Temperature 1 | 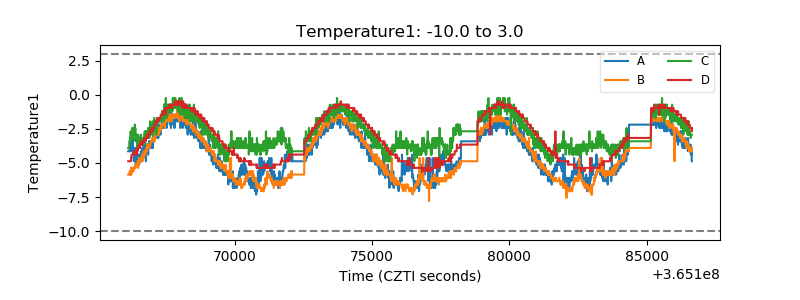 |
| Veto HV Monitor | 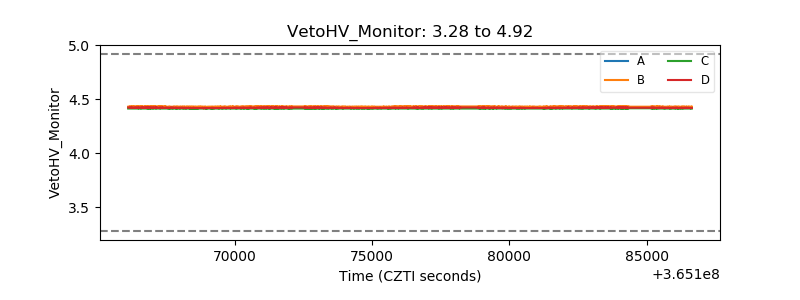 |
| Veto LLD |  |
| Alpha Counter | 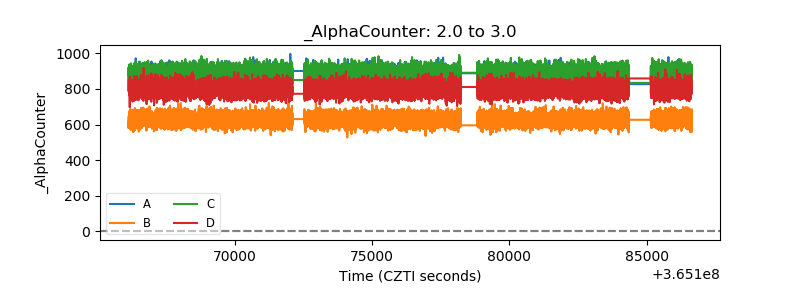 |
| _CPM_Rate | 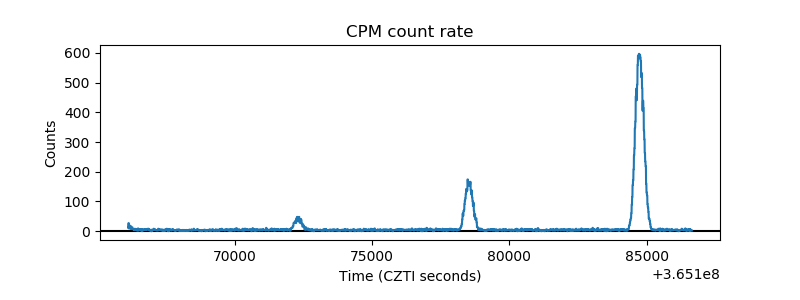 |
| CZT Counter | 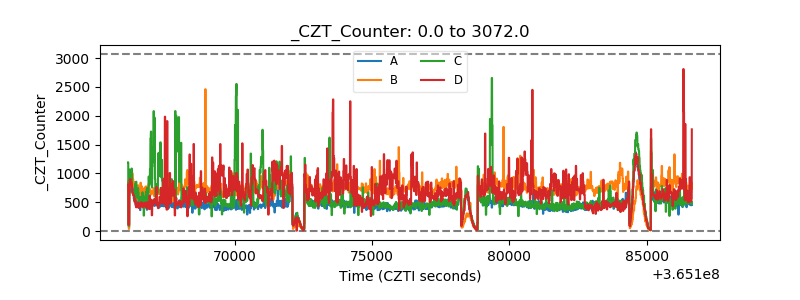 |
| +2.5 Volts monitor |  |
| +5 Volts monitor |  |
| _ROLL_ROT | 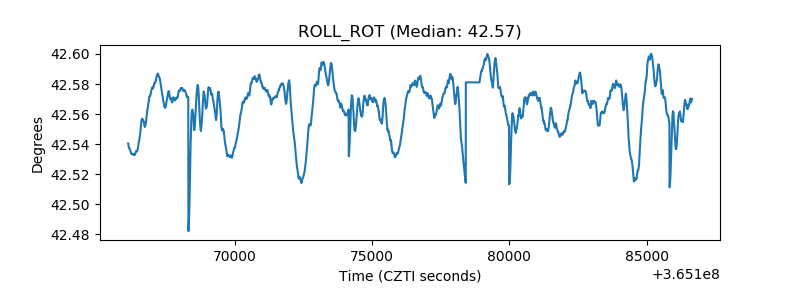 |
| _Roll_DEC | 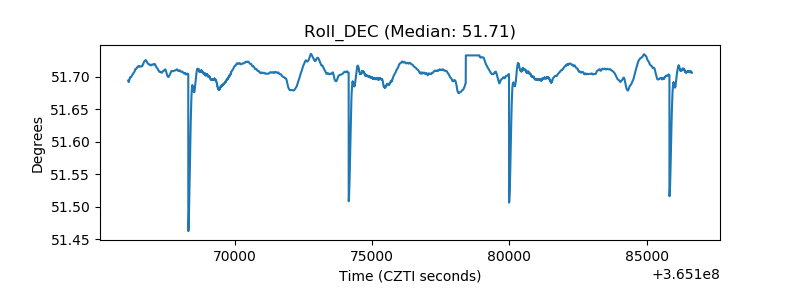 |
| _Roll_RA | 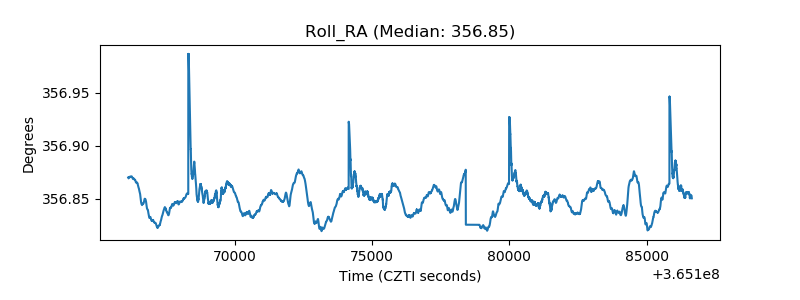 |
| Veto Counter | 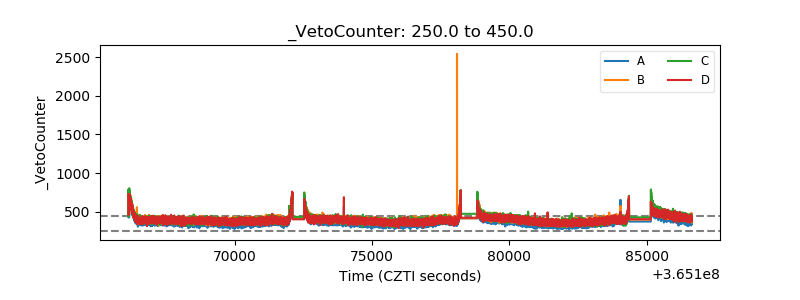 |