| Param | Original file | Final file |
|---|---|---|
| Filename | modeM0/AS1A10_056T01_9000004598_31536cztM0_level2.evt | modeM0/AS1A10_056T01_9000004598_31536cztM0_level2_quad_clean.evt |
| Size (bytes) | 531,676,800 | 90,745,920 |
| Size | 507.0 MB | 86.5 MB |
| Events in quadrant A | 3,043,965 | 591,642 |
| Events in quadrant B | 5,122,459 | 591,052 |
| Events in quadrant C | 3,304,359 | 563,628 |
| Events in quadrant D | 4,196,623 | 554,187 |
| Mode M0 | |||
|---|---|---|---|
| Quadrant | BADHDUFLAG | Total packets | Discarded packets |
| A | 0 | 13293 | 13 |
| B | 0 | 19903 | 16 |
| C | 0 | 13913 | 13 |
| D | 0 | 16819 | 2 |
| Mode M9 | |||
|---|---|---|---|
| Quadrant | BADHDUFLAG | Total packets | Discarded packets |
| A | 0 | 10 | 0 |
| B | 0 | 10 | 0 |
| C | 0 | 10 | 0 |
| D | 0 | 10 | 0 |
| Mode SS | |||
|---|---|---|---|
| Quadrant | BADHDUFLAG | Total packets | Discarded packets |
| A | 0 | 130 | 0 |
| B | 0 | 130 | 0 |
| C | 0 | 130 | 0 |
| D | 0 | 130 | 0 |
| Quadrant | Total seconds | Saturated seconds | Saturation percentage |
|---|---|---|---|
| A | 6413 | 40 | 0.623733% |
| B | 6414 | 106 | 1.652635% |
| C | 6414 | 127 | 1.980044% |
| D | 6419 | 96 | 1.495560% |
Noise dominated data is calculated using 1-second bins in cleaned event files. If a bin has >2000 counts, and if more than 50% of those come from <1% of pixels, then it is considered to be noise-dominated and hence unusable.
| Quadrant | # 1 sec bins | Bins with >0 counts | Bins with >2000 counts | High rate bins dominated by noise | Noise dominated (total time) | Noise dominated (detector-on time) | Marked lightcurve |
|---|---|---|---|---|---|---|---|
| A | 7374 | 6419 | 0 | 0 | 0.00% | 0.00% | 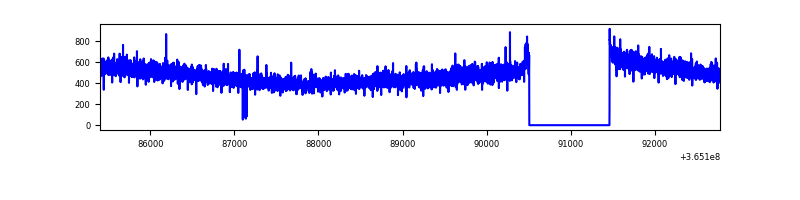 |
| B | 7374 | 6419 | 1 | 1 | 0.01% | 0.02% | 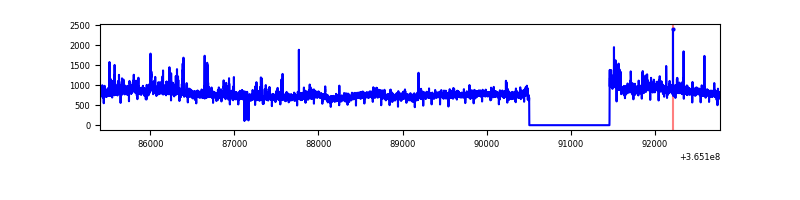 |
| C | 7375 | 6420 | 13 | 13 | 0.18% | 0.20% | 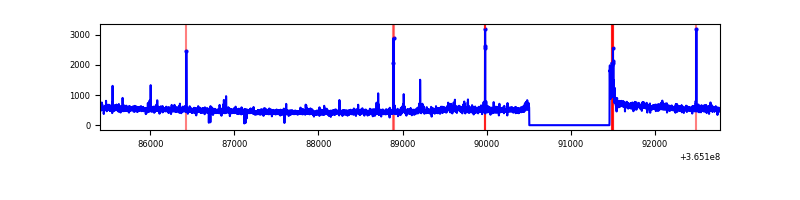 |
| D | 7374 | 6419 | 40 | 40 | 0.54% | 0.62% | 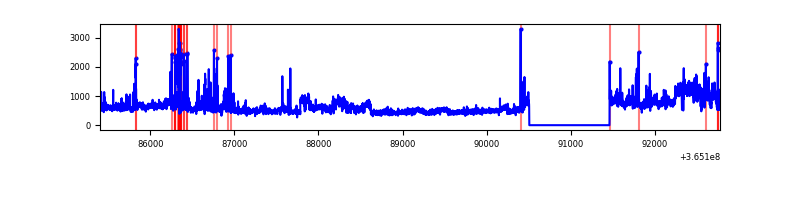 |
Top three noisy pixels from each quadrant. If the there are fewer than three noisy pixels in the level2.evt file, extra rows are filled as -1
| Pixel properties | Quadrant properties | ||||||
|---|---|---|---|---|---|---|---|
| Quadrant | DetID | PixID | Counts | Sigma | Mean | Median | Sigma |
| A | 13 | 254 | 12329 | 72.73 | 788 | 771 | 158.9 |
| A | 3 | 137 | 7933 | 45.07 | 788 | 771 | 158.9 |
| A | 0 | 226 | 6656 | 37.03 | 788 | 771 | 158.9 |
| B | 6 | 159 | 1812154 | 12121.26 | 782 | 761 | 149.4 |
| B | 4 | 80 | 156572 | 1042.64 | 782 | 761 | 149.4 |
| B | 0 | 190 | 31049 | 202.68 | 782 | 761 | 149.4 |
| C | 3 | 233 | 131582 | 744.74 | 754 | 758 | 175.7 |
| C | 14 | 238 | 123510 | 698.79 | 754 | 758 | 175.7 |
| C | 0 | 10 | 36117 | 201.29 | 754 | 758 | 175.7 |
| D | 8 | 195 | 979384 | 5419.79 | 763 | 742 | 180.6 |
| D | 13 | 249 | 156718 | 863.81 | 763 | 742 | 180.6 |
| D | 12 | 233 | 86664 | 475.84 | 763 | 742 | 180.6 |
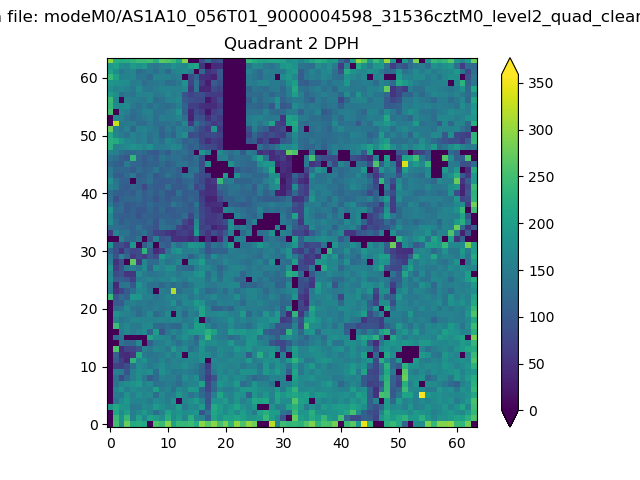
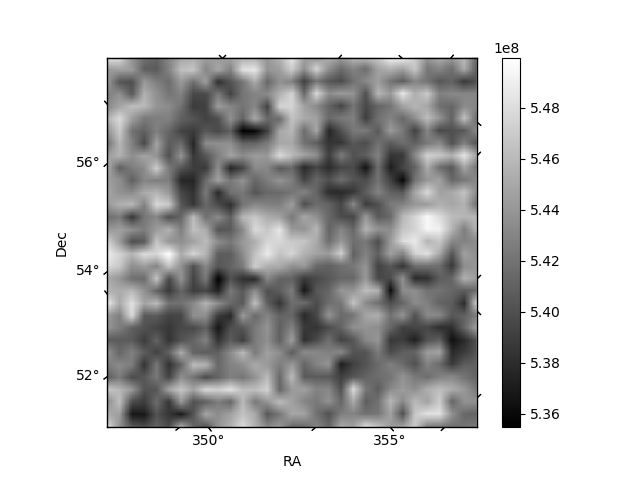
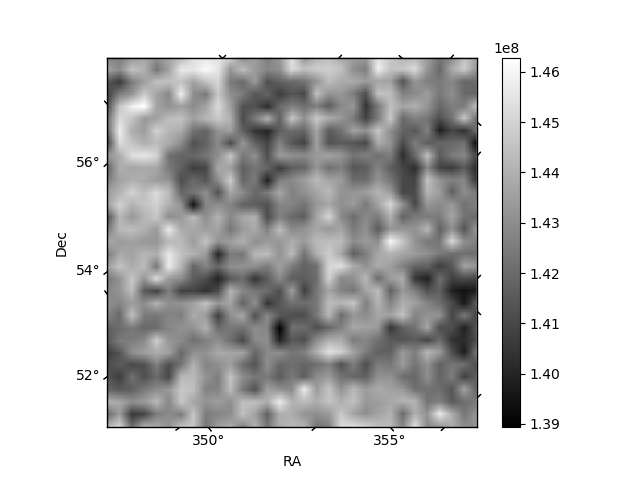
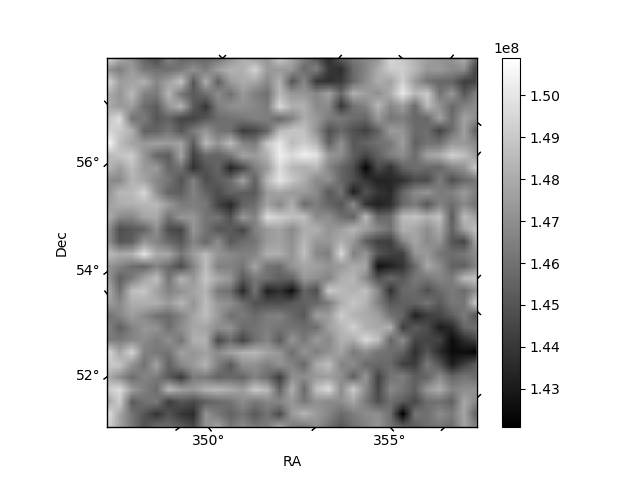
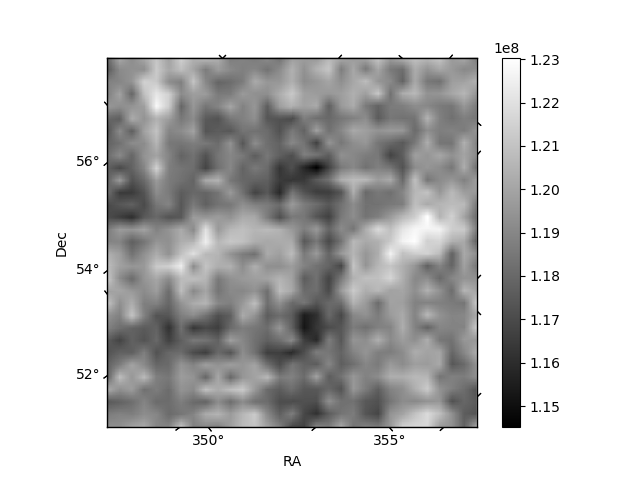
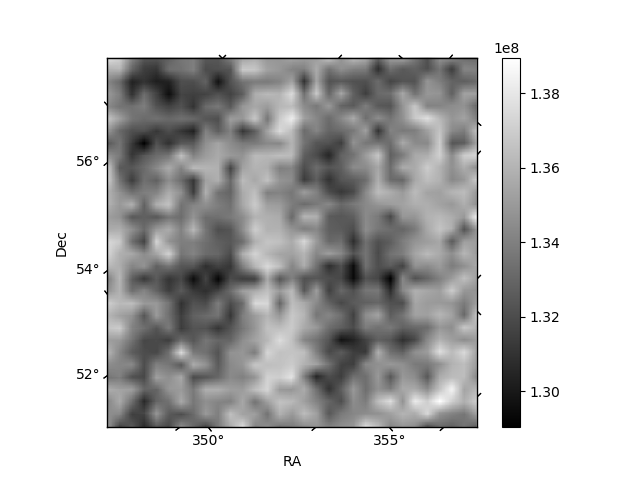
Histogram calculated using DETX and DETY for each event in the final _common_clean file
| Quadrant A | 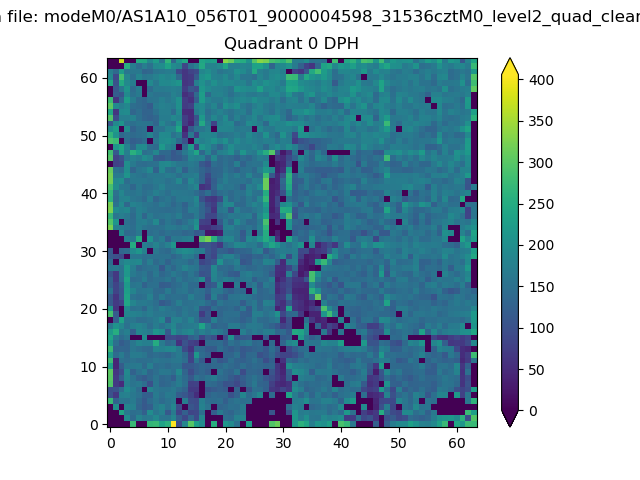 |
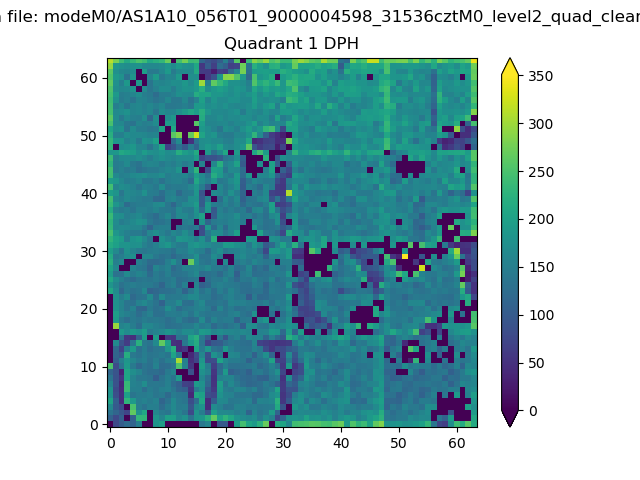 |
Quadrant B |
|---|---|---|---|
| Quadrant D | 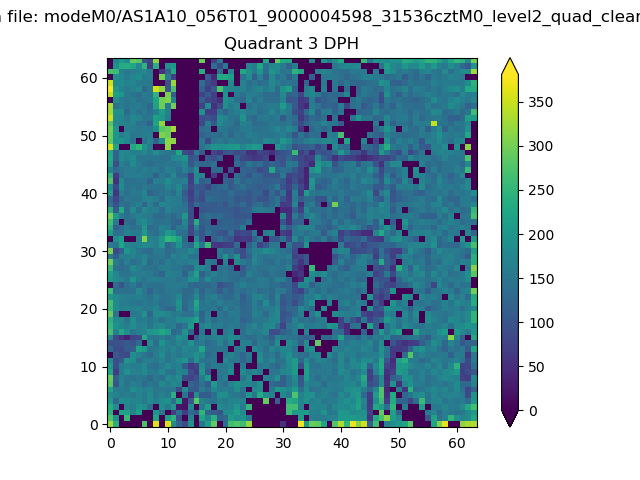 |
 |
Quadrant C |
| Plot type | Count rate plots | Images |
|---|---|---|
| Comparison with Poisson distribution Blue bars denote a histogram of data divided into 1 sec bins. Red curve is a Poisson curve with rate = median count rate of data. |
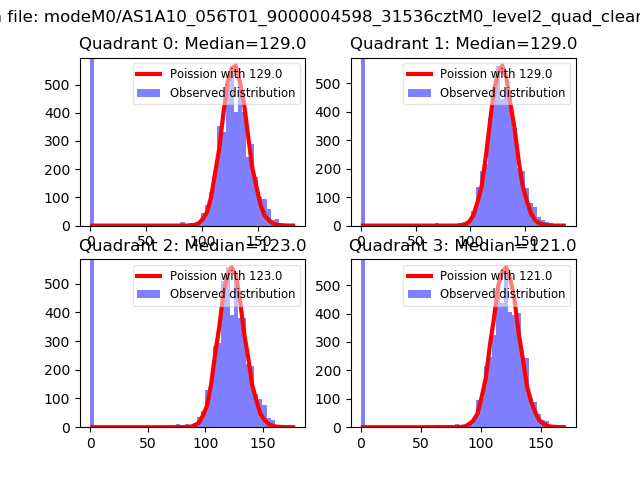 |
 |
| Quadrant-wise count rates Data is divided into 100 sec bins |
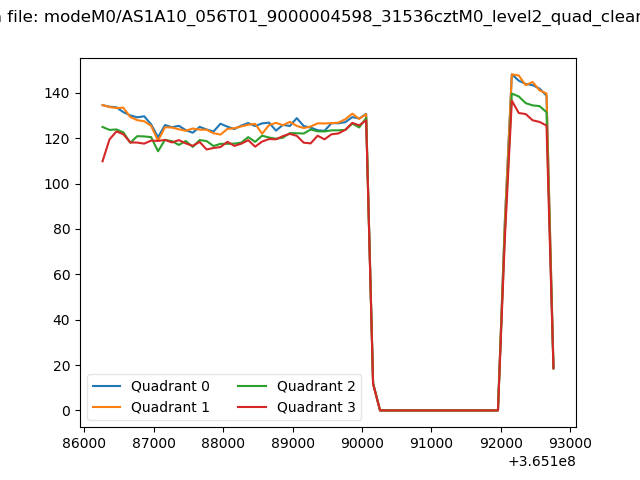 |
|
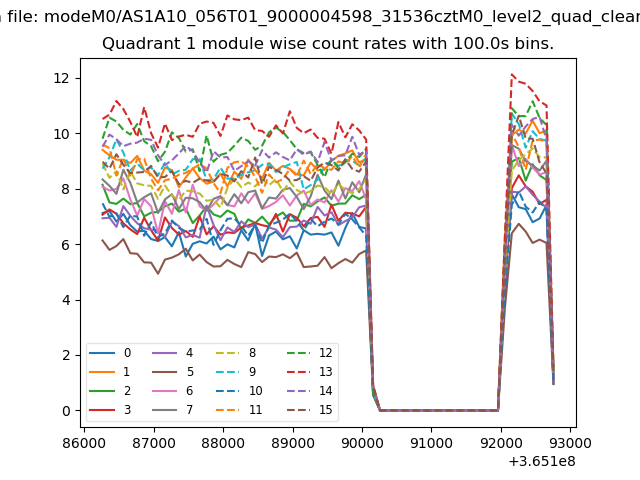
| Module-wise count rates for Quadrant A Data is divided into 100 sec bins |
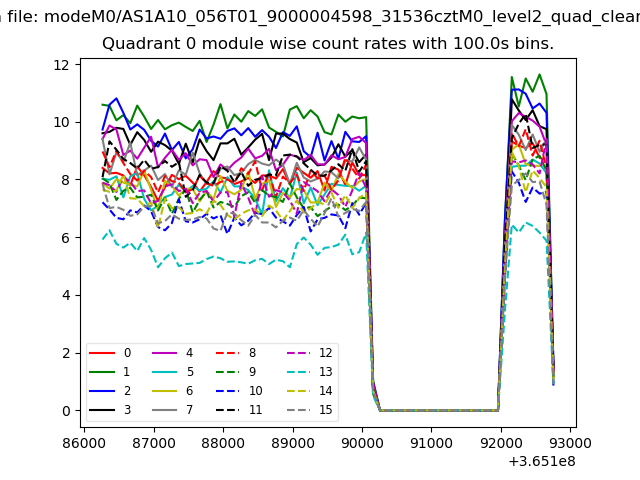 |
 |
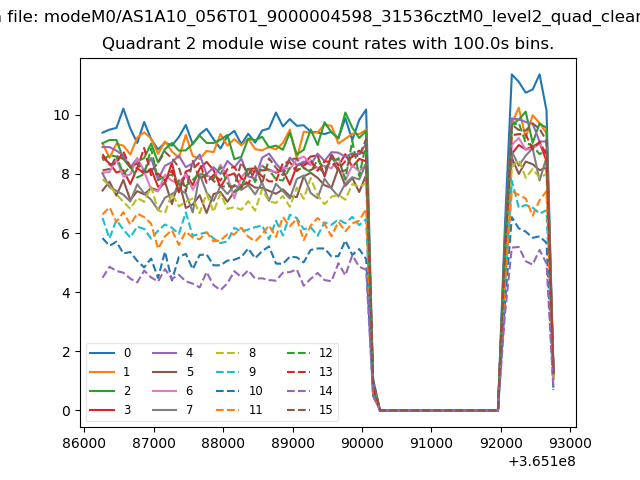
| Module-wise count rates for Quadrant B Data is divided into 100 sec bins |
 |
 |
| Module-wise count rates for Quadrant C Data is divided into 100 sec bins |
 |
 |
| Module-wise count rates for Quadrant D Data is divided into 100 sec bins |
 |
 |
| Parameter | Plot |
|---|---|
| CZT HV Monitor | 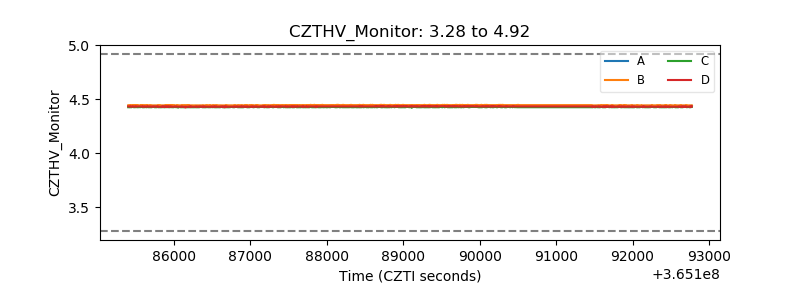 |
| D_VDD | 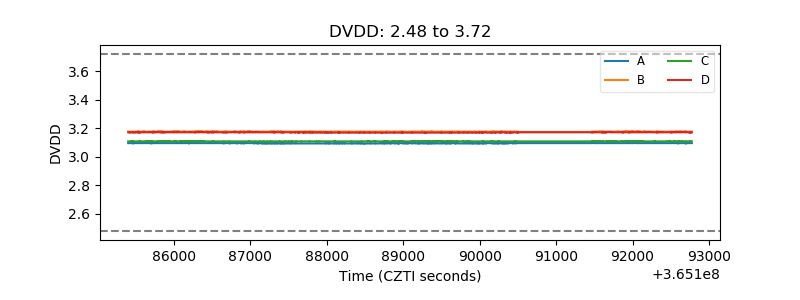 |
| Temperature 1 |  |
| Veto HV Monitor |  |
| Veto LLD | 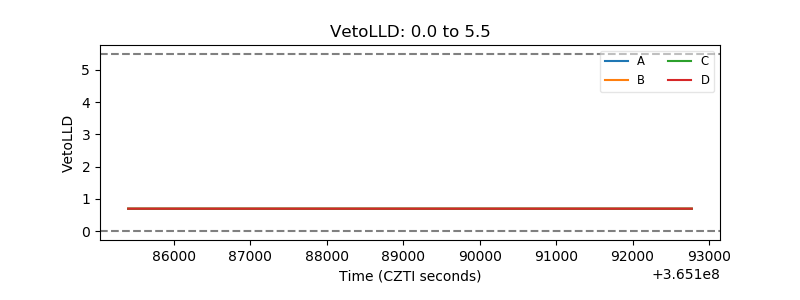 |
| Alpha Counter |  |
| _CPM_Rate | 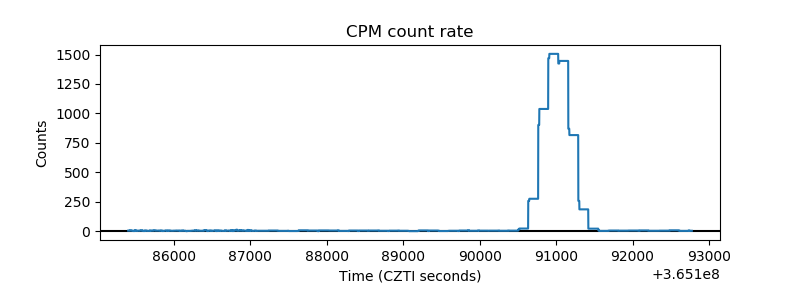 |
| CZT Counter | 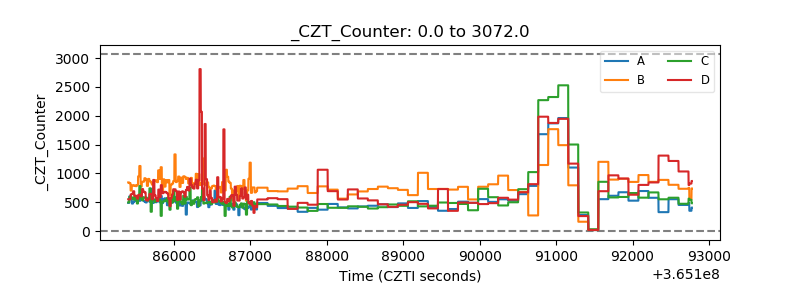 |
| +2.5 Volts monitor |  |
| +5 Volts monitor |  |
| _ROLL_ROT | 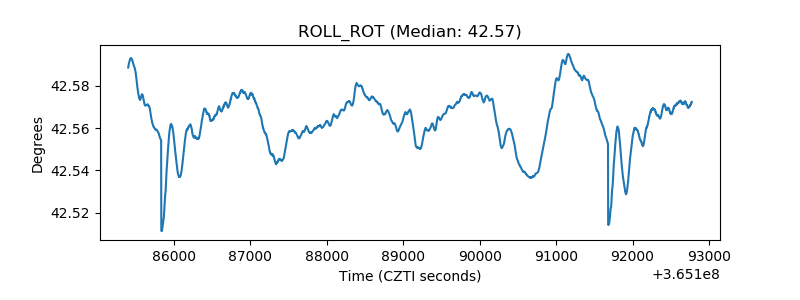 |
| _Roll_DEC |  |
| _Roll_RA | 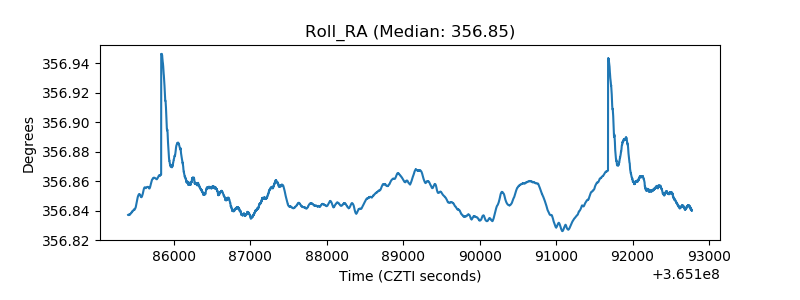 |
| Veto Counter |  |