| Param | Original file | Final file |
|---|---|---|
| Filename | modeM0/AS1A10_056T01_9000004598_31538cztM0_level2.evt | modeM0/AS1A10_056T01_9000004598_31538cztM0_level2_quad_clean.evt |
| Size (bytes) | 326,710,080 | 62,222,400 |
| Size | 311.6 MB | 59.3 MB |
| Events in quadrant A | 1,893,699 | 413,835 |
| Events in quadrant B | 3,043,898 | 412,214 |
| Events in quadrant C | 2,038,207 | 408,588 |
| Events in quadrant D | 2,655,316 | 376,744 |
| Mode M0 | |||
|---|---|---|---|
| Quadrant | BADHDUFLAG | Total packets | Discarded packets |
| A | 0 | 10307 | 2079 |
| B | 0 | 15155 | 3302 |
| C | 0 | 10698 | 2060 |
| D | 0 | 12824 | 2349 |
| Mode M9 | |||
|---|---|---|---|
| Quadrant | BADHDUFLAG | Total packets | Discarded packets |
| A | 0 | 10 | 0 |
| B | 0 | 11 | 1 |
| C | 0 | 10 | 0 |
| D | 0 | 10 | 0 |
| Mode SS | |||
|---|---|---|---|
| Quadrant | BADHDUFLAG | Total packets | Discarded packets |
| A | 0 | 102 | 20 |
| B | 0 | 105 | 23 |
| C | 0 | 103 | 25 |
| D | 0 | 101 | 23 |
| Quadrant | Total seconds | Saturated seconds | Saturation percentage |
|---|---|---|---|
| A | 3862 | 42 | 1.087519% |
| B | 3814 | 109 | 2.857892% |
| C | 3886 | 108 | 2.779207% |
| D | 3862 | 289 | 7.483169% |
Noise dominated data is calculated using 1-second bins in cleaned event files. If a bin has >2000 counts, and if more than 50% of those come from <1% of pixels, then it is considered to be noise-dominated and hence unusable.
| Quadrant | # 1 sec bins | Bins with >0 counts | Bins with >2000 counts | High rate bins dominated by noise | Noise dominated (total time) | Noise dominated (detector-on time) | Marked lightcurve |
|---|---|---|---|---|---|---|---|
| A | 6428 | 3968 | 0 | 0 | 0.00% | 0.00% | 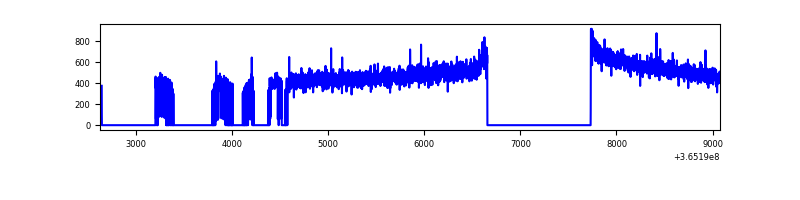 |
| B | 5866 | 3909 | 4 | 4 | 0.07% | 0.10% | 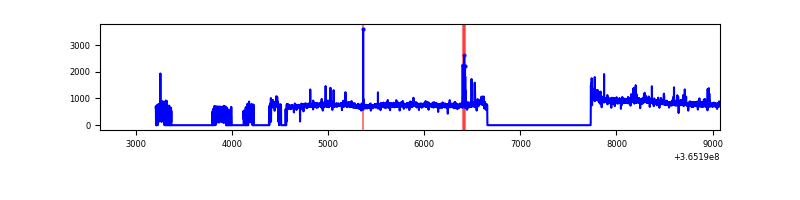 |
| C | 6446 | 4000 | 5 | 5 | 0.08% | 0.12% | 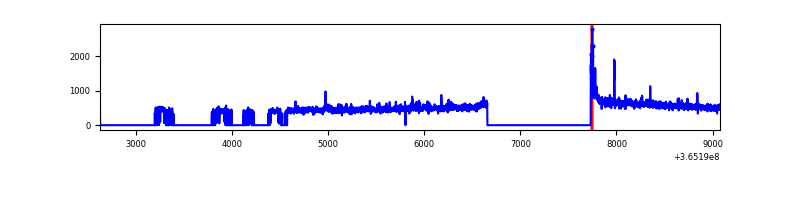 |
| D | 5865 | 3963 | 219 | 219 | 3.73% | 5.53% | 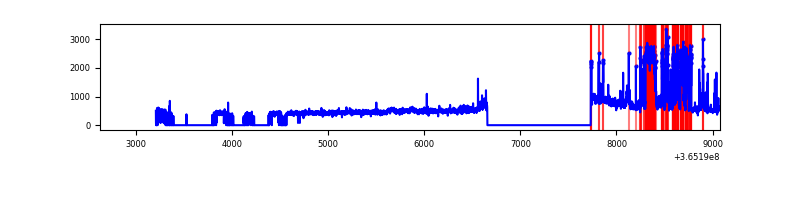 |
Top three noisy pixels from each quadrant. If the there are fewer than three noisy pixels in the level2.evt file, extra rows are filled as -1
| Pixel properties | Quadrant properties | ||||||
|---|---|---|---|---|---|---|---|
| Quadrant | DetID | PixID | Counts | Sigma | Mean | Median | Sigma |
| A | 13 | 254 | 6932 | 66.07 | 489 | 478 | 97.7 |
| A | 3 | 137 | 4985 | 46.14 | 489 | 478 | 97.7 |
| A | 0 | 226 | 4214 | 38.25 | 489 | 478 | 97.7 |
| B | 6 | 159 | 1057263 | 11482.06 | 480 | 469 | 92.0 |
| B | 4 | 80 | 74103 | 800.03 | 480 | 469 | 92.0 |
| B | 12 | 111 | 11168 | 116.24 | 480 | 469 | 92.0 |
| C | 14 | 238 | 77131 | 686.8 | 474 | 476 | 111.6 |
| C | 3 | 233 | 51512 | 457.26 | 474 | 476 | 111.6 |
| C | 0 | 10 | 33296 | 294.05 | 474 | 476 | 111.6 |
| D | 13 | 249 | 577041 | 5276.95 | 457 | 445 | 109.3 |
| D | 8 | 195 | 244268 | 2231.44 | 457 | 445 | 109.3 |
| D | 12 | 218 | 71462 | 649.94 | 457 | 445 | 109.3 |
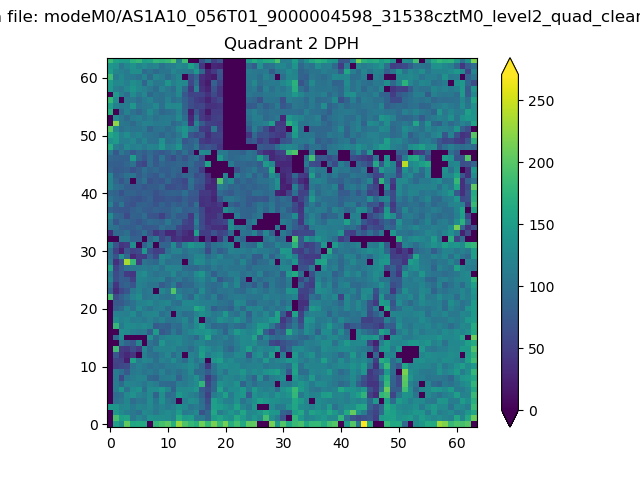
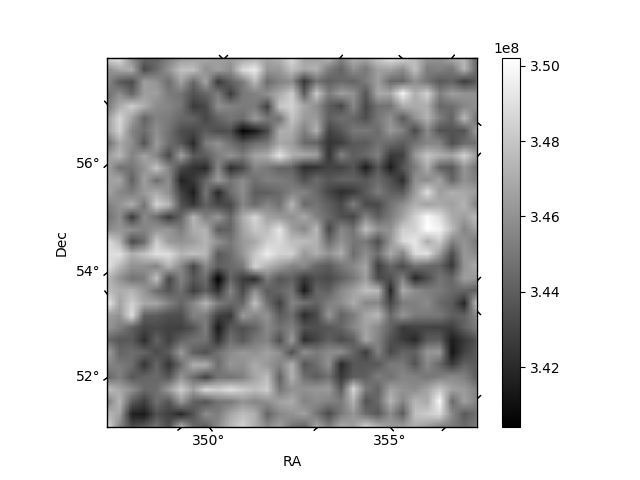
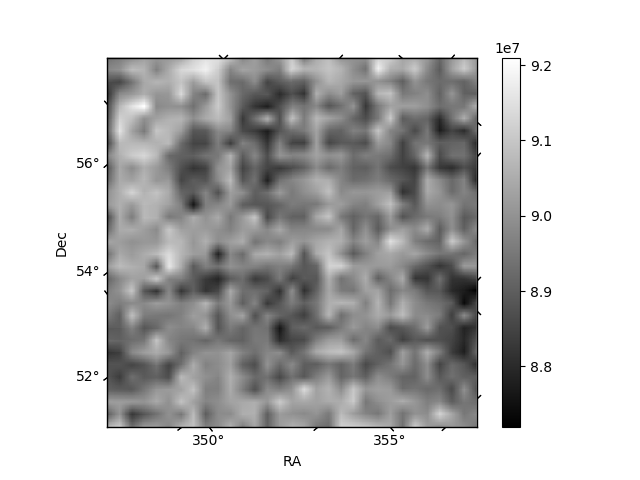
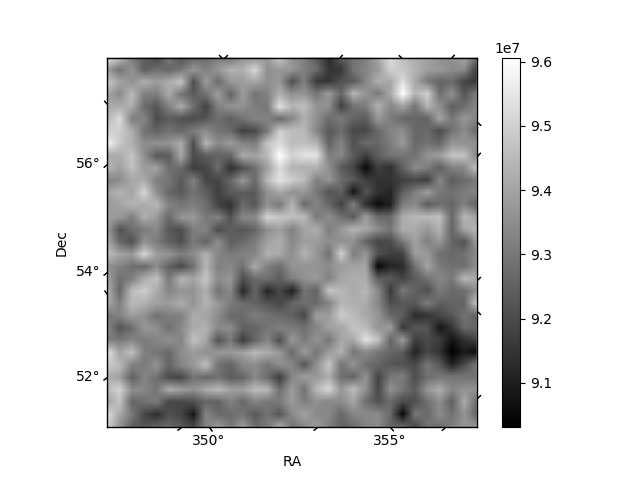
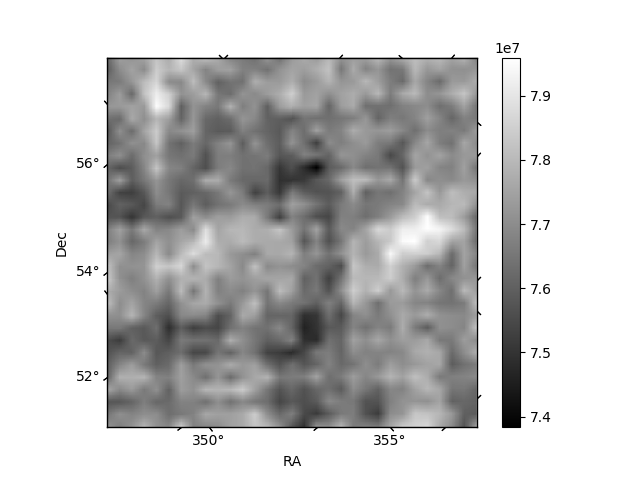
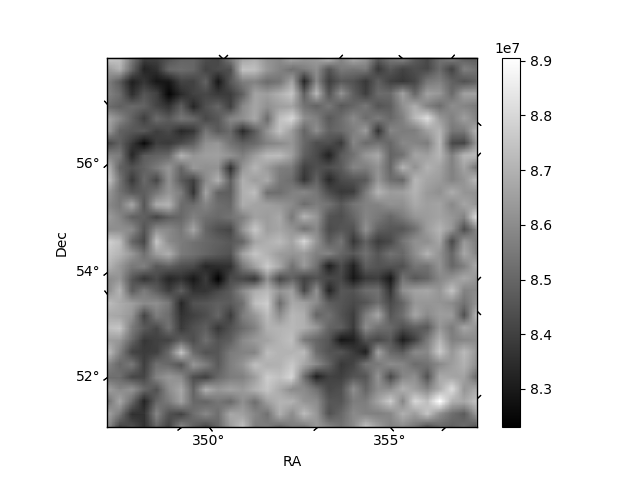
Histogram calculated using DETX and DETY for each event in the final _common_clean file
| Quadrant A | 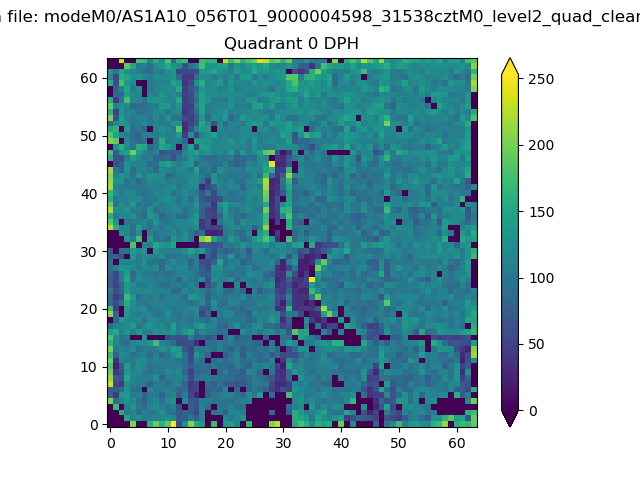 |
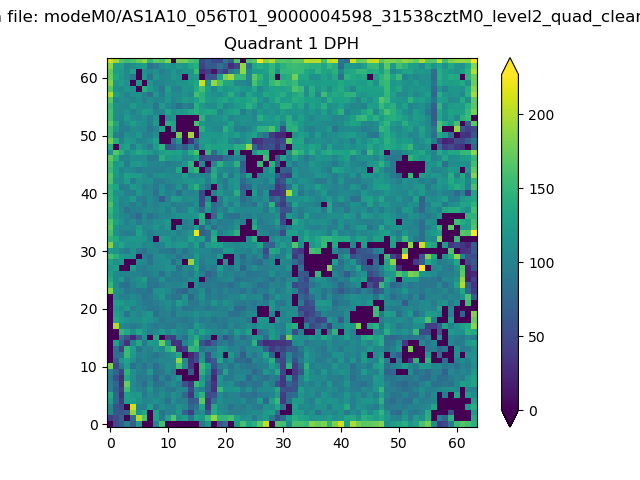 |
Quadrant B |
|---|---|---|---|
| Quadrant D | 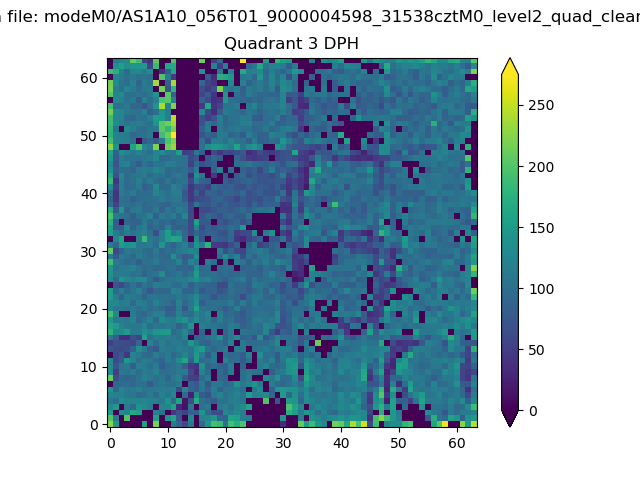 |
 |
Quadrant C |
| Plot type | Count rate plots | Images |
|---|---|---|
| Comparison with Poisson distribution Blue bars denote a histogram of data divided into 1 sec bins. Red curve is a Poisson curve with rate = median count rate of data. |
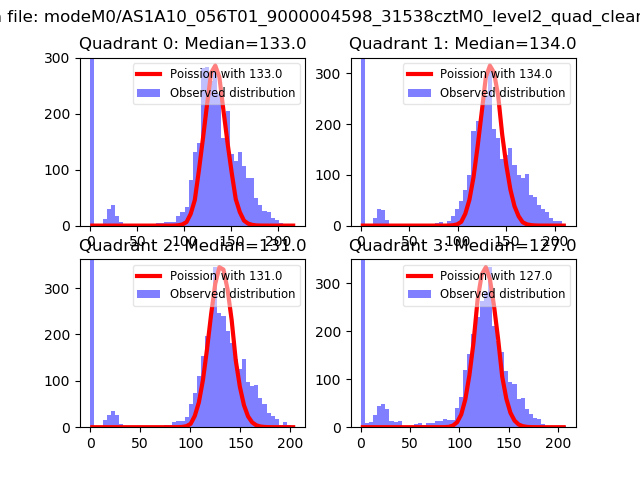 |
 |
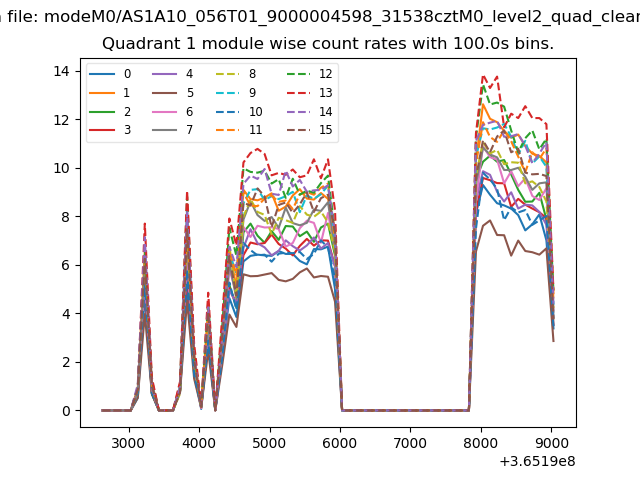
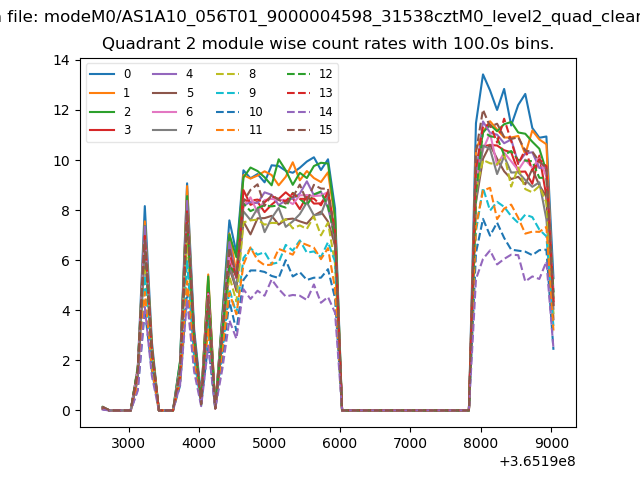
| Quadrant-wise count rates Data is divided into 100 sec bins |
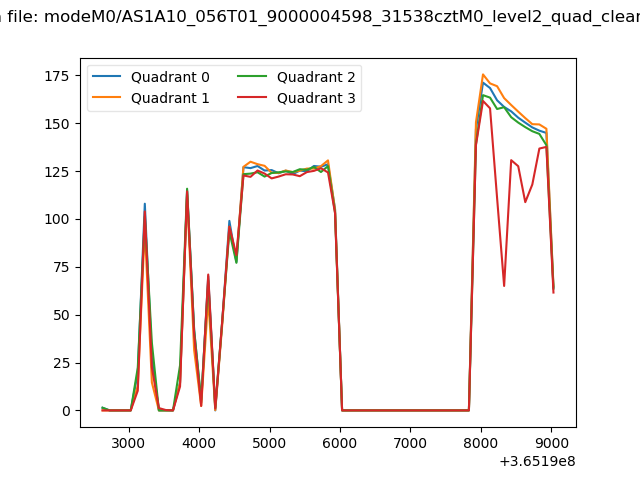 |
|
| Module-wise count rates for Quadrant A Data is divided into 100 sec bins |
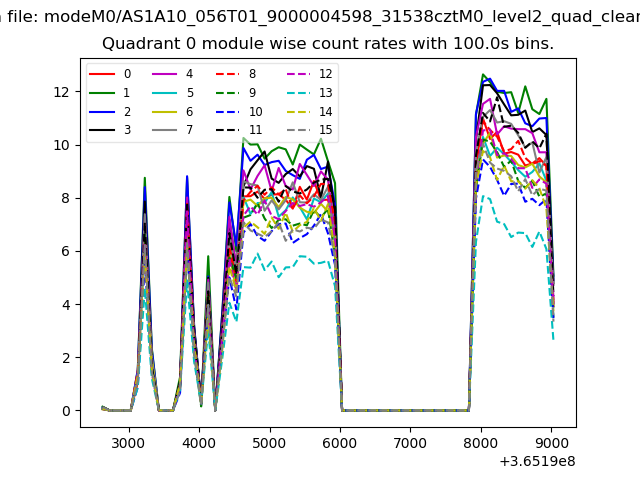 |
 |
| Module-wise count rates for Quadrant B Data is divided into 100 sec bins |
 |
 |
| Module-wise count rates for Quadrant C Data is divided into 100 sec bins |
 |
 |
| Module-wise count rates for Quadrant D Data is divided into 100 sec bins |
 |
 |
| Parameter | Plot |
|---|---|
| CZT HV Monitor | 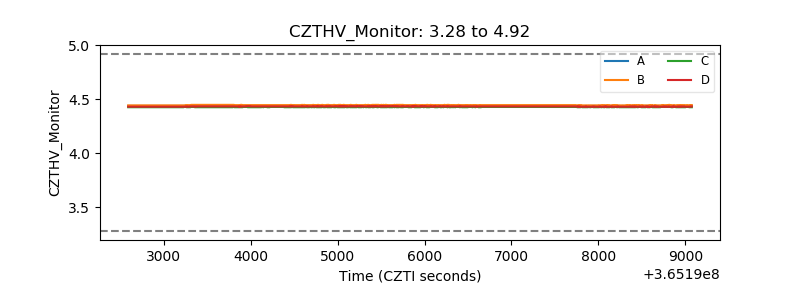 |
| D_VDD | 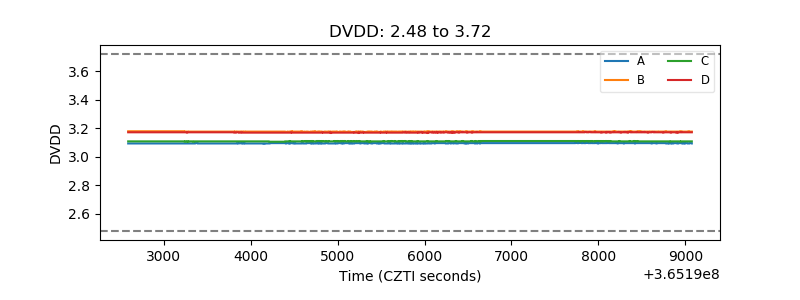 |
| Temperature 1 |  |
| Veto HV Monitor |  |
| Veto LLD | 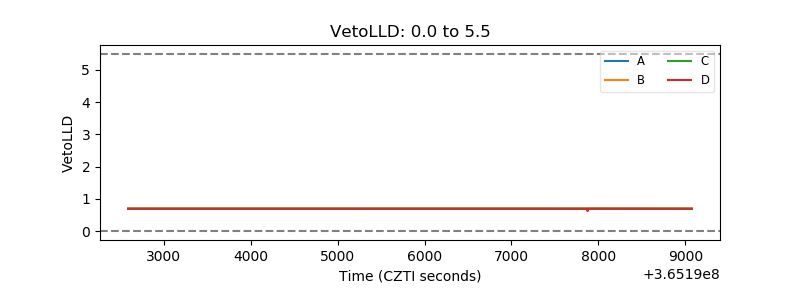 |
| Alpha Counter | 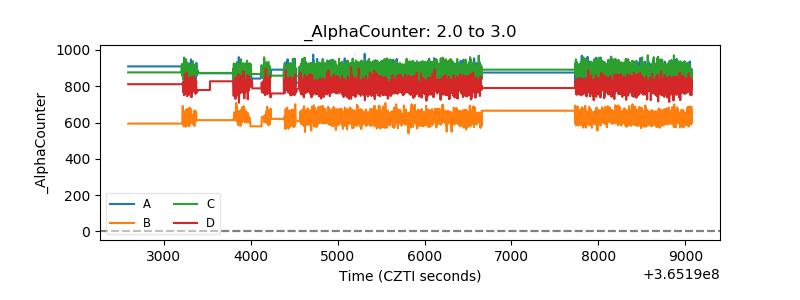 |
| _CPM_Rate | 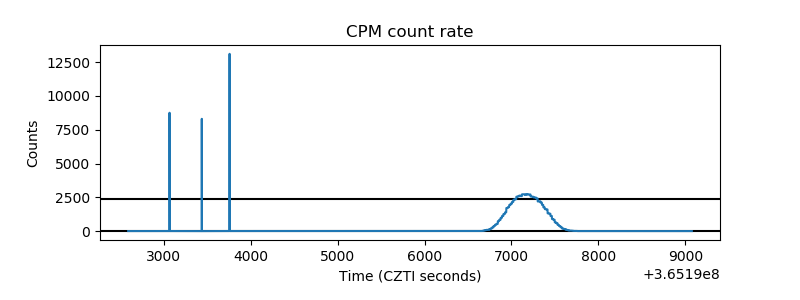 |
| CZT Counter | 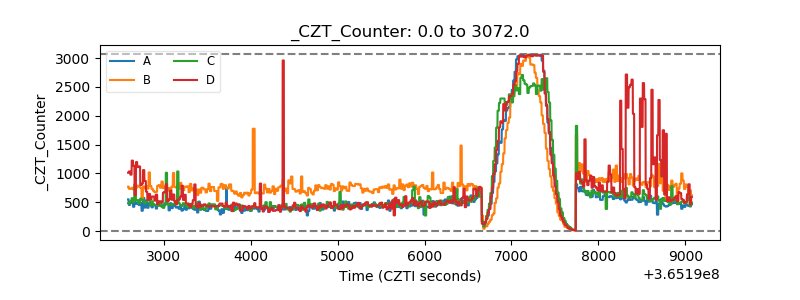 |
| +2.5 Volts monitor |  |
| +5 Volts monitor |  |
| _ROLL_ROT | 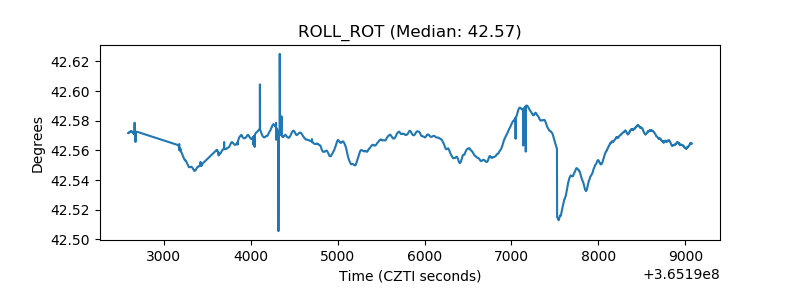 |
| _Roll_DEC | 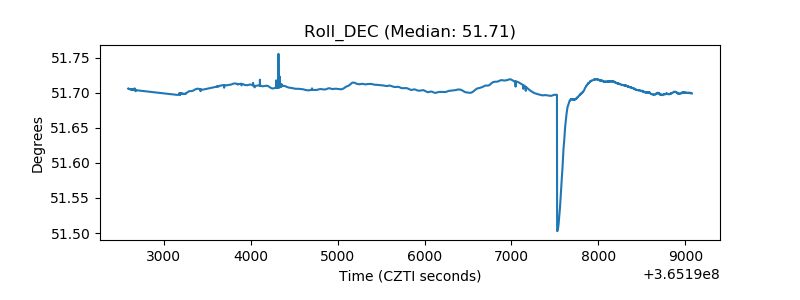 |
| _Roll_RA | 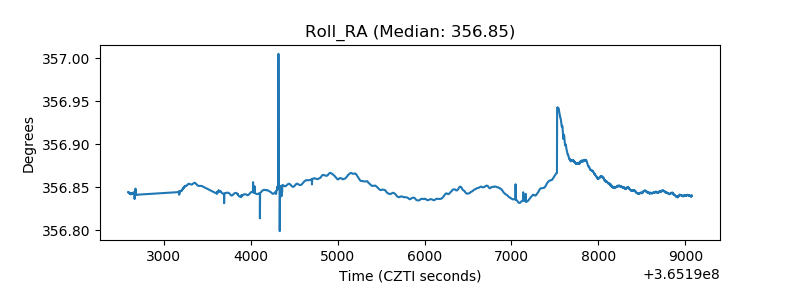 |
| Veto Counter |  |