| Param | Original file | Final file |
|---|---|---|
| Filename | modeM0/AS1A10_056T01_9000004598_31540cztM0_level2.evt | modeM0/AS1A10_056T01_9000004598_31540cztM0_level2_quad_clean.evt |
| Size (bytes) | 532,883,520 | 111,942,720 |
| Size | 508.2 MB | 106.8 MB |
| Events in quadrant A | 3,078,153 | 752,398 |
| Events in quadrant B | 5,061,927 | 772,496 |
| Events in quadrant C | 3,367,953 | 743,409 |
| Events in quadrant D | 4,213,131 | 691,930 |
| Mode M0 | |||
|---|---|---|---|
| Quadrant | BADHDUFLAG | Total packets | Discarded packets |
| A | 0 | 13152 | 2 |
| B | 0 | 19239 | 2 |
| C | 0 | 14012 | 2 |
| D | 0 | 16655 | 2 |
| Mode M9 | |||
|---|---|---|---|
| Quadrant | BADHDUFLAG | Total packets | Discarded packets |
| A | 0 | 26 | 0 |
| B | 0 | 26 | 0 |
| C | 0 | 26 | 0 |
| D | 0 | 26 | 0 |
| Mode SS | |||
|---|---|---|---|
| Quadrant | BADHDUFLAG | Total packets | Discarded packets |
| A | 0 | 126 | 0 |
| B | 0 | 126 | 0 |
| C | 0 | 126 | 0 |
| D | 0 | 126 | 0 |
| Quadrant | Total seconds | Saturated seconds | Saturation percentage |
|---|---|---|---|
| A | 6165 | 14 | 0.227088% |
| B | 6165 | 84 | 1.362530% |
| C | 6166 | 124 | 2.011028% |
| D | 6166 | 262 | 4.249108% |
Noise dominated data is calculated using 1-second bins in cleaned event files. If a bin has >2000 counts, and if more than 50% of those come from <1% of pixels, then it is considered to be noise-dominated and hence unusable.
| Quadrant | # 1 sec bins | Bins with >0 counts | Bins with >2000 counts | High rate bins dominated by noise | Noise dominated (total time) | Noise dominated (detector-on time) | Marked lightcurve |
|---|---|---|---|---|---|---|---|
| A | 8705 | 6167 | 0 | 0 | 0.00% | 0.00% | 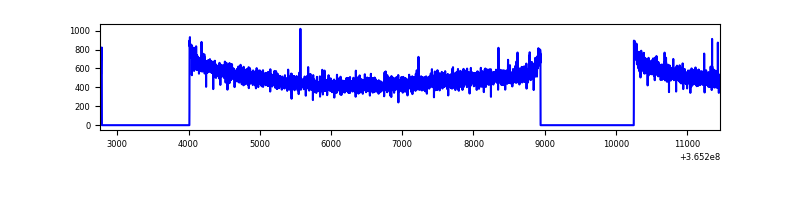 |
| B | 8705 | 6166 | 4 | 4 | 0.05% | 0.06% | 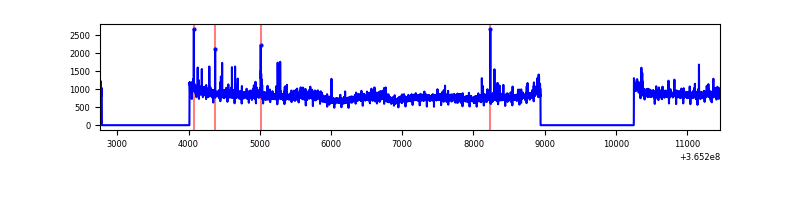 |
| C | 8706 | 6167 | 11 | 11 | 0.13% | 0.18% | 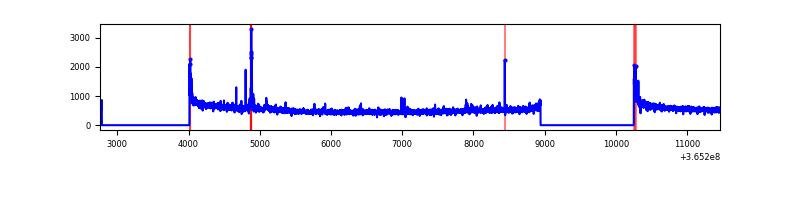 |
| D | 8706 | 6168 | 194 | 194 | 2.23% | 3.15% | 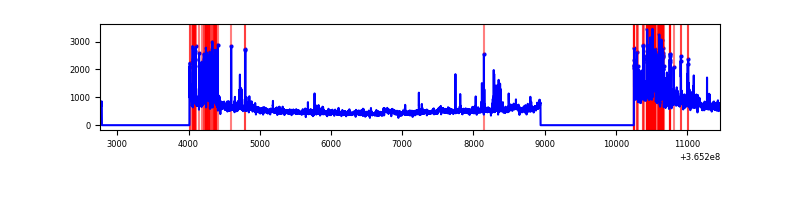 |
Top three noisy pixels from each quadrant. If the there are fewer than three noisy pixels in the level2.evt file, extra rows are filled as -1
| Pixel properties | Quadrant properties | ||||||
|---|---|---|---|---|---|---|---|
| Quadrant | DetID | PixID | Counts | Sigma | Mean | Median | Sigma |
| A | 13 | 254 | 10686 | 62.42 | 796 | 781 | 158.7 |
| A | 3 | 137 | 7483 | 42.23 | 796 | 781 | 158.7 |
| A | 0 | 226 | 6654 | 37.01 | 796 | 781 | 158.7 |
| B | 6 | 159 | 1745837 | 11756.13 | 802 | 784 | 148.4 |
| B | 4 | 80 | 114972 | 769.27 | 802 | 784 | 148.4 |
| B | 10 | 247 | 27190 | 177.89 | 802 | 784 | 148.4 |
| C | 14 | 238 | 128871 | 710.44 | 781 | 788 | 180.3 |
| C | 3 | 233 | 57891 | 316.74 | 781 | 788 | 180.3 |
| C | 0 | 10 | 49306 | 269.12 | 781 | 788 | 180.3 |
| D | 8 | 195 | 612176 | 3401.62 | 760 | 740 | 179.7 |
| D | 12 | 218 | 435250 | 2417.32 | 760 | 740 | 179.7 |
| D | 13 | 249 | 187016 | 1036.31 | 760 | 740 | 179.7 |
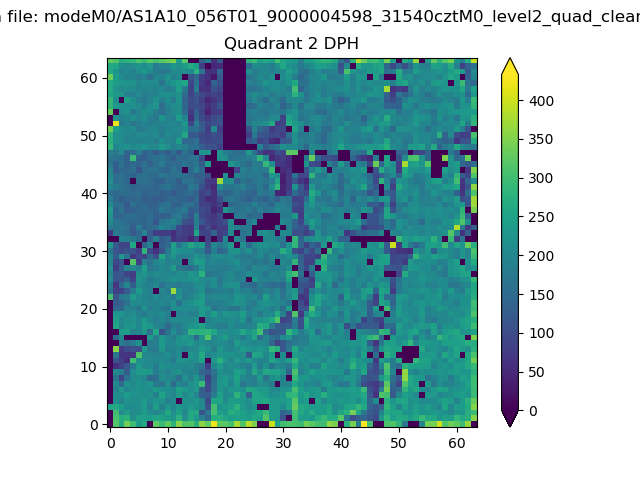
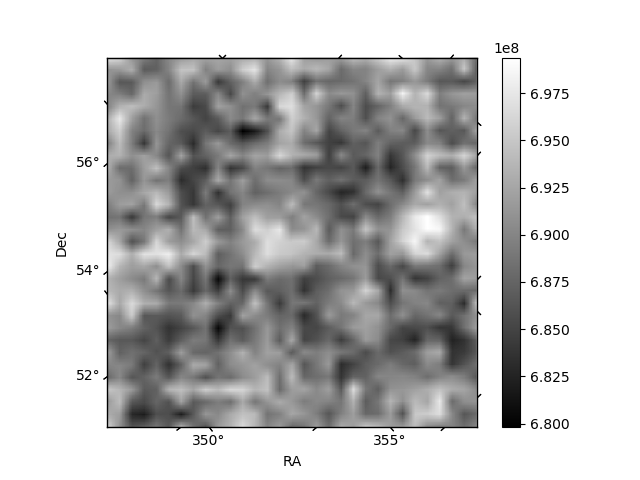
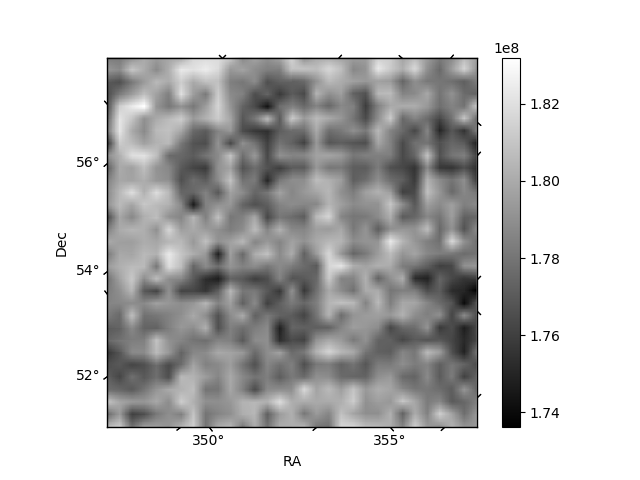
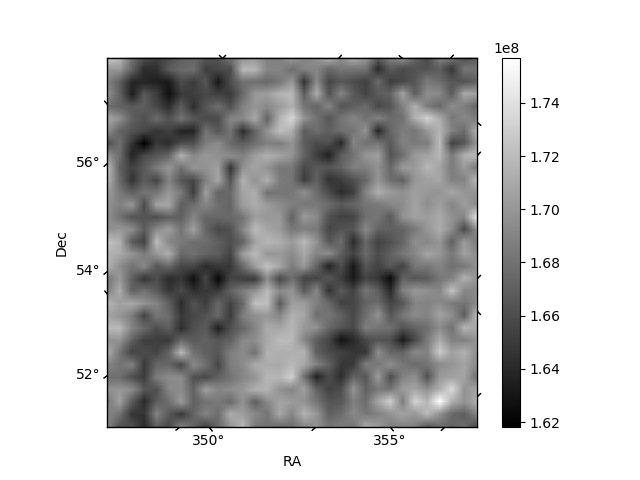
Histogram calculated using DETX and DETY for each event in the final _common_clean file
| Quadrant A | 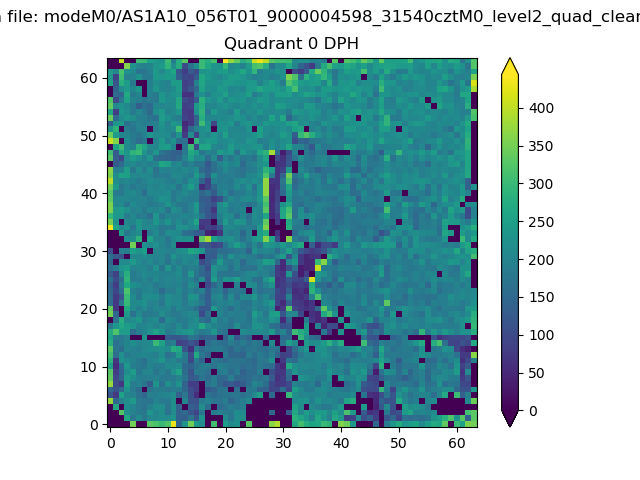 |
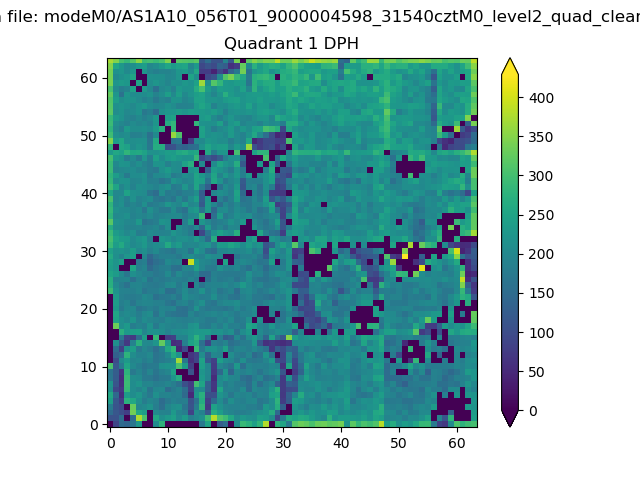 |
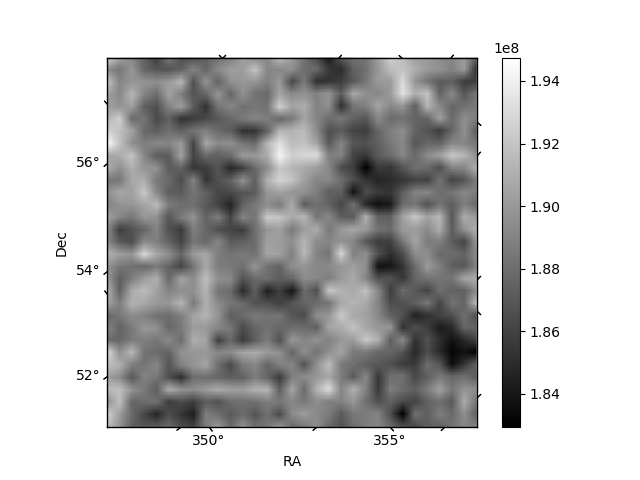
Quadrant B |
|---|---|---|---|
| Quadrant D | 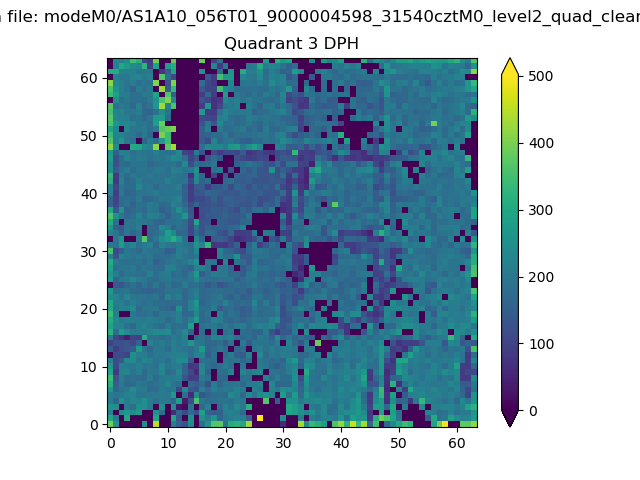 |
 |
Quadrant C |
| Plot type | Count rate plots | Images |
|---|---|---|
| Comparison with Poisson distribution Blue bars denote a histogram of data divided into 1 sec bins. Red curve is a Poisson curve with rate = median count rate of data. |
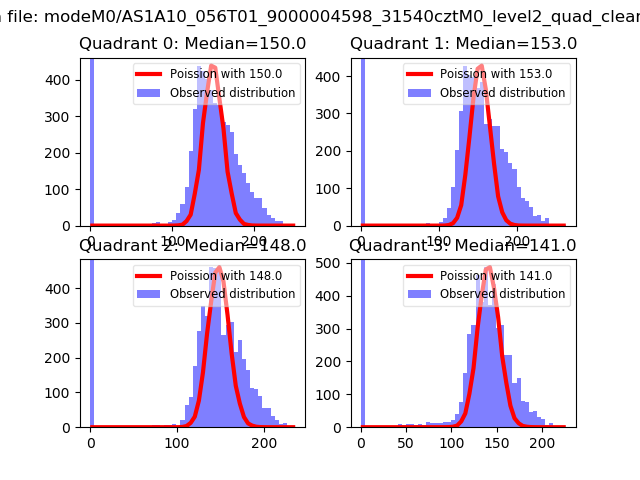 |
 |
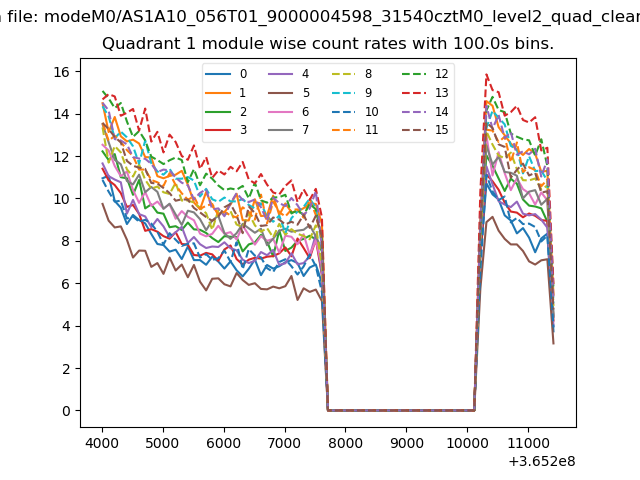
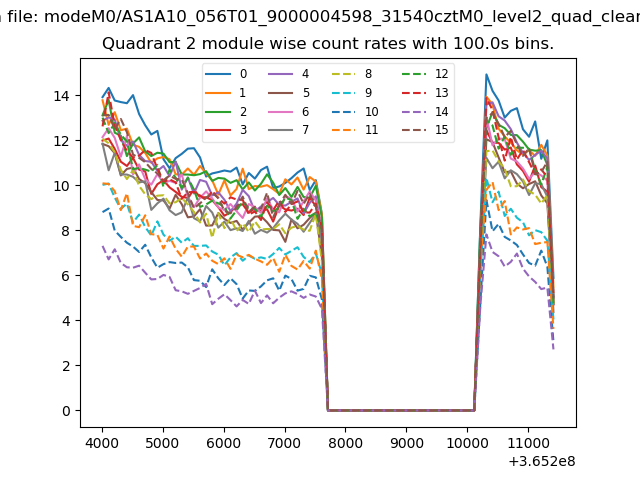
| Quadrant-wise count rates Data is divided into 100 sec bins |
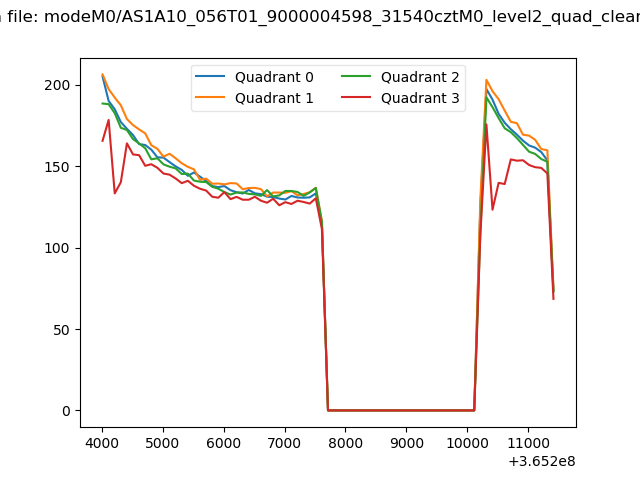 |
|
| Module-wise count rates for Quadrant A Data is divided into 100 sec bins |
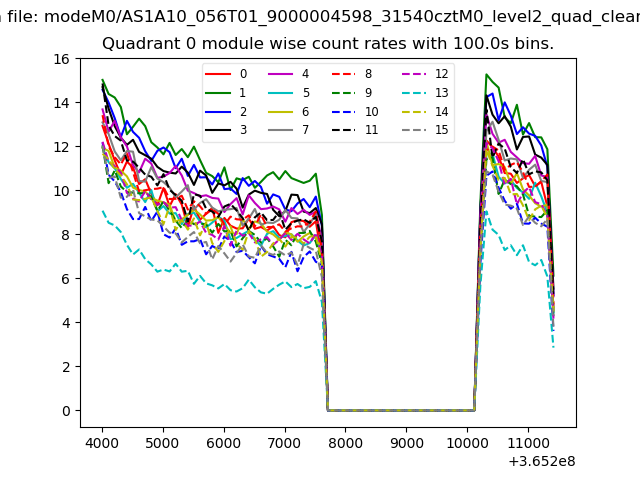 |
 |
| Module-wise count rates for Quadrant B Data is divided into 100 sec bins |
 |
 |
| Module-wise count rates for Quadrant C Data is divided into 100 sec bins |
 |
 |
| Module-wise count rates for Quadrant D Data is divided into 100 sec bins |
 |
 |
| Parameter | Plot |
|---|---|
| CZT HV Monitor |  |
| D_VDD | 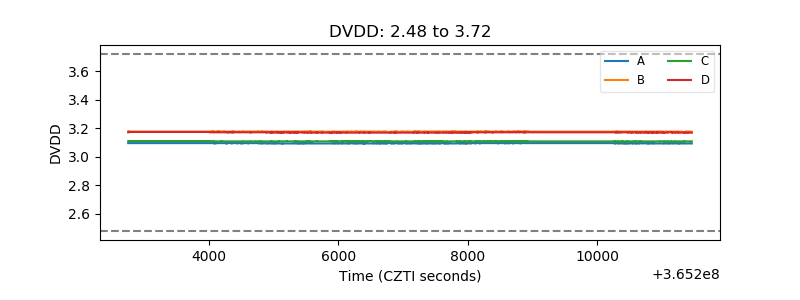 |
| Temperature 1 | 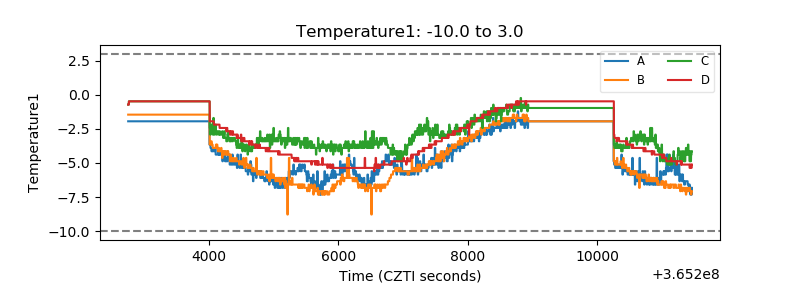 |
| Veto HV Monitor | 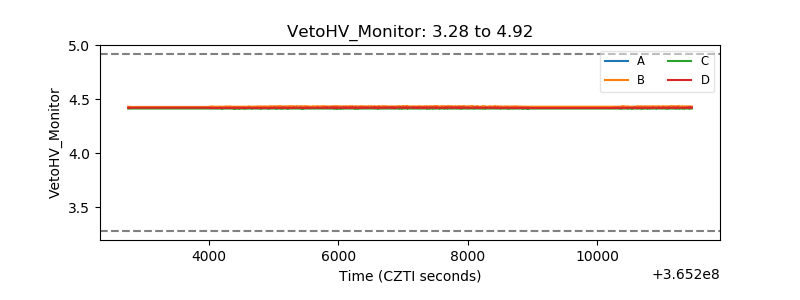 |
| Veto LLD | 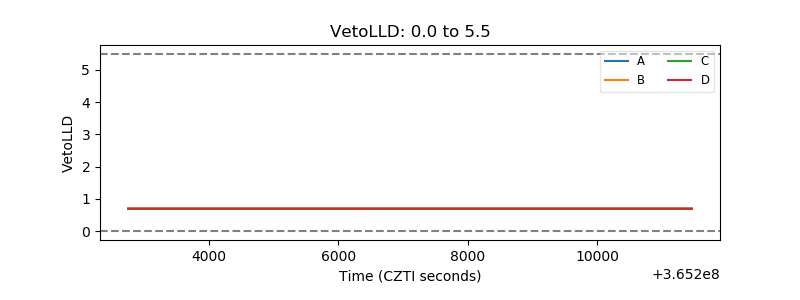 |
| Alpha Counter | 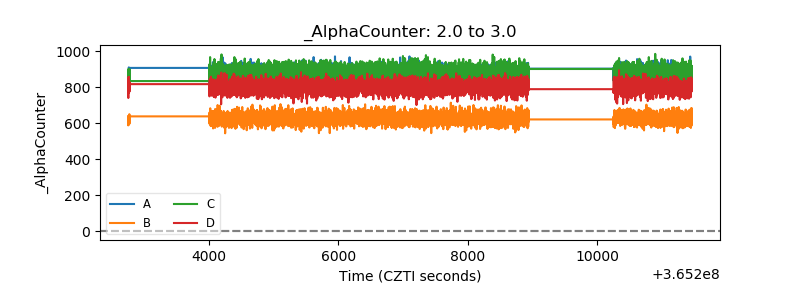 |
| _CPM_Rate | 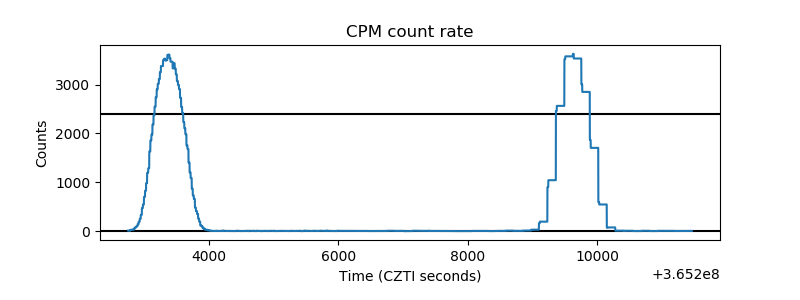 |
| CZT Counter | 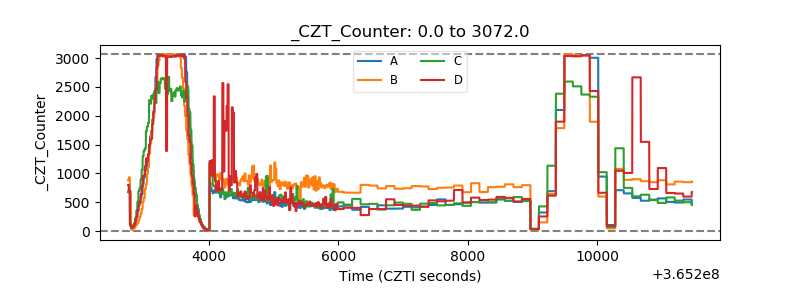 |
| +2.5 Volts monitor |  |
| +5 Volts monitor |  |
| _ROLL_ROT |  |
| _Roll_DEC |  |
| _Roll_RA | 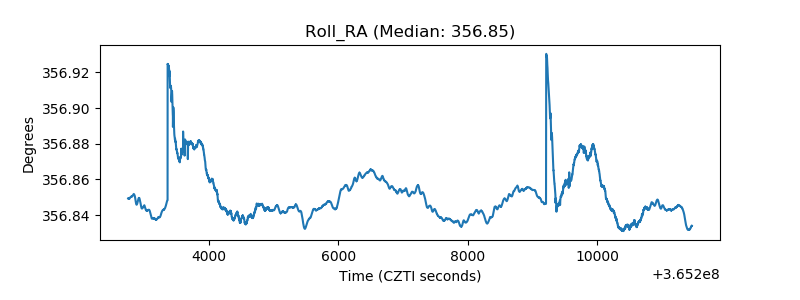 |
| Veto Counter |  |