| Param | Original file | Final file |
|---|---|---|
| Filename | modeM0/AS1A10_056T01_9000004598_31541cztM0_level2.evt | modeM0/AS1A10_056T01_9000004598_31541cztM0_level2_quad_clean.evt |
| Size (bytes) | 1,716,361,920 | 342,552,960 |
| Size | 1.6 GB | 326.7 MB |
| Events in quadrant A | 9,836,473 | 2,282,851 |
| Events in quadrant B | 16,340,247 | 2,319,292 |
| Events in quadrant C | 10,659,123 | 2,231,943 |
| Events in quadrant D | 13,758,841 | 2,125,442 |
| Mode M0 | |||
|---|---|---|---|
| Quadrant | BADHDUFLAG | Total packets | Discarded packets |
| A | 0 | 42925 | 4 |
| B | 0 | 63571 | 4 |
| C | 0 | 44978 | 6 |
| D | 0 | 54904 | 5 |
| Mode M9 | |||
|---|---|---|---|
| Quadrant | BADHDUFLAG | Total packets | Discarded packets |
| A | 0 | 49 | 0 |
| B | 0 | 49 | 0 |
| C | 0 | 49 | 0 |
| D | 0 | 49 | 0 |
| Mode SS | |||
|---|---|---|---|
| Quadrant | BADHDUFLAG | Total packets | Discarded packets |
| A | 0 | 420 | 0 |
| B | 0 | 420 | 0 |
| C | 0 | 420 | 0 |
| D | 0 | 420 | 0 |
| Quadrant | Total seconds | Saturated seconds | Saturation percentage |
|---|---|---|---|
| A | 20571 | 86 | 0.418064% |
| B | 20571 | 338 | 1.643090% |
| C | 20570 | 427 | 2.075839% |
| D | 20571 | 675 | 3.281318% |
Noise dominated data is calculated using 1-second bins in cleaned event files. If a bin has >2000 counts, and if more than 50% of those come from <1% of pixels, then it is considered to be noise-dominated and hence unusable.
| Quadrant | # 1 sec bins | Bins with >0 counts | Bins with >2000 counts | High rate bins dominated by noise | Noise dominated (total time) | Noise dominated (detector-on time) | Marked lightcurve |
|---|---|---|---|---|---|---|---|
| A | 25501 | 20574 | 0 | 0 | 0.00% | 0.00% | 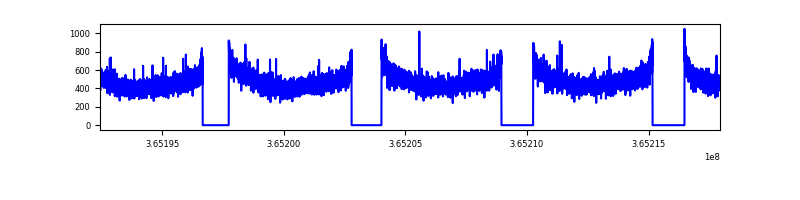 |
| B | 25501 | 20572 | 25 | 25 | 0.10% | 0.12% | 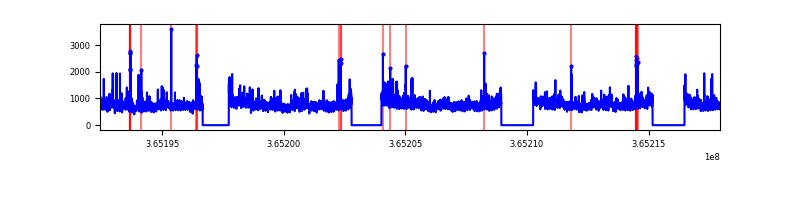 |
| C | 25501 | 20572 | 92 | 92 | 0.36% | 0.45% | 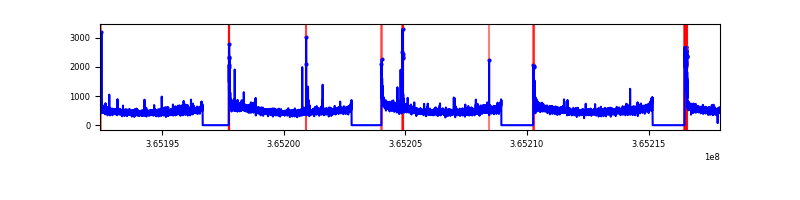 |
| D | 25501 | 20574 | 437 | 437 | 1.71% | 2.12% | 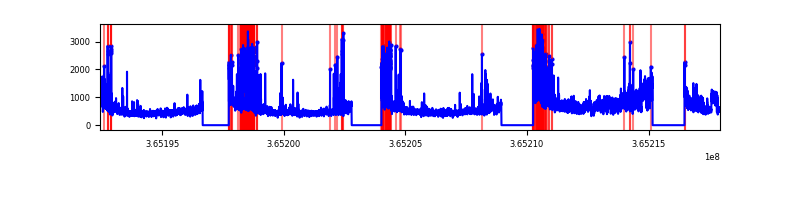 |
Top three noisy pixels from each quadrant. If the there are fewer than three noisy pixels in the level2.evt file, extra rows are filled as -1
| Pixel properties | Quadrant properties | ||||||
|---|---|---|---|---|---|---|---|
| Quadrant | DetID | PixID | Counts | Sigma | Mean | Median | Sigma |
| A | 13 | 254 | 35898 | 67.06 | 2545 | 2499 | 498.1 |
| A | 3 | 137 | 24893 | 44.96 | 2545 | 2499 | 498.1 |
| A | 0 | 226 | 21189 | 37.53 | 2545 | 2499 | 498.1 |
| B | 6 | 159 | 5712194 | 12094.46 | 2554 | 2497 | 472.1 |
| B | 4 | 80 | 403685 | 849.81 | 2554 | 2497 | 472.1 |
| B | 0 | 190 | 78176 | 160.31 | 2554 | 2497 | 472.1 |
| C | 14 | 238 | 405524 | 707.89 | 2468 | 2486 | 569.3 |
| C | 0 | 10 | 274856 | 478.39 | 2468 | 2486 | 569.3 |
| C | 3 | 233 | 168351 | 291.32 | 2468 | 2486 | 569.3 |
| D | 8 | 195 | 2945600 | 5101.42 | 2436 | 2372 | 576.9 |
| D | 13 | 249 | 785781 | 1357.86 | 2436 | 2372 | 576.9 |
| D | 12 | 218 | 524666 | 905.28 | 2436 | 2372 | 576.9 |
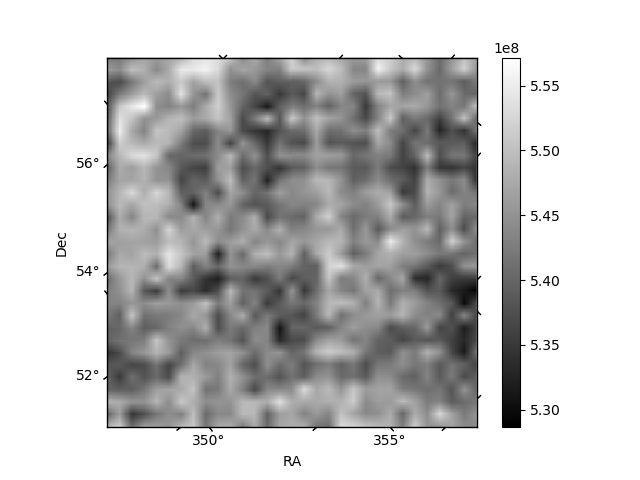
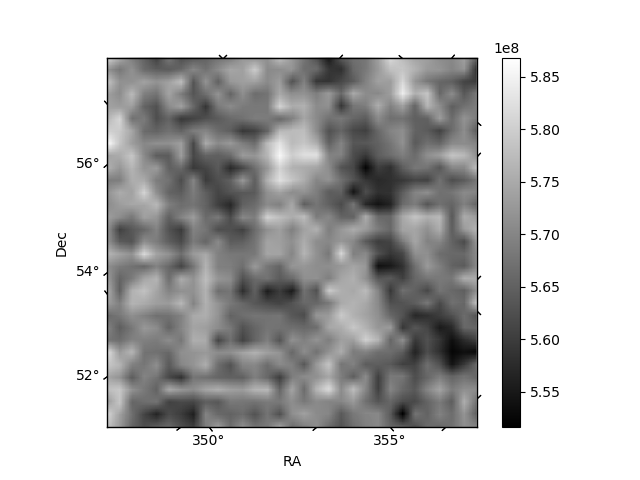
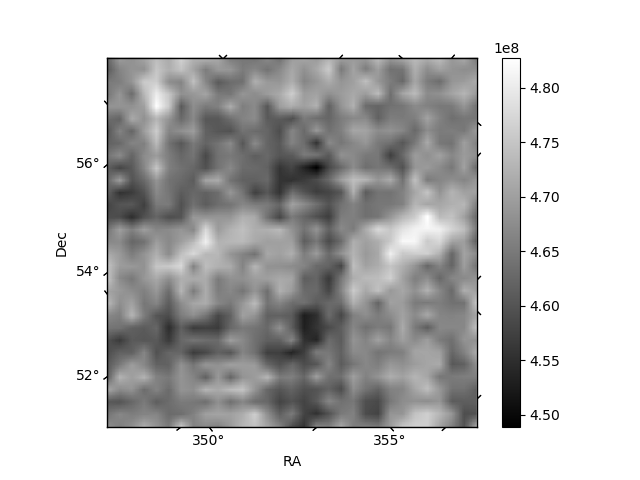
Histogram calculated using DETX and DETY for each event in the final _common_clean file
| Quadrant A | 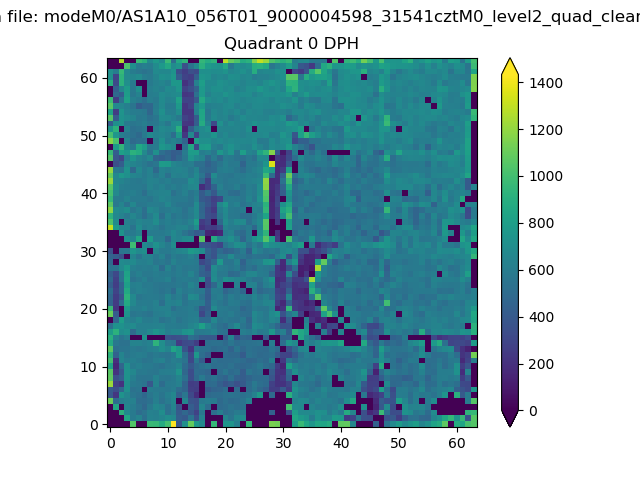 |
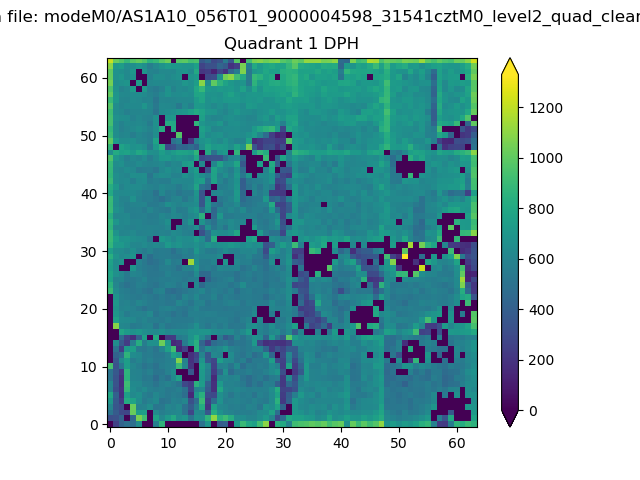 |
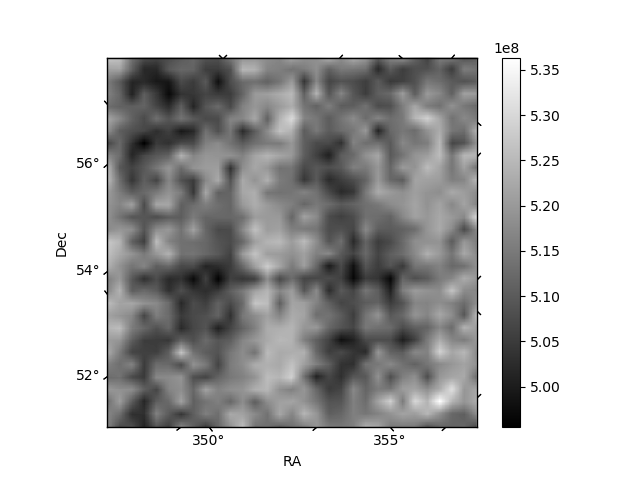
Quadrant B |
|---|---|---|---|
| Quadrant D |  |
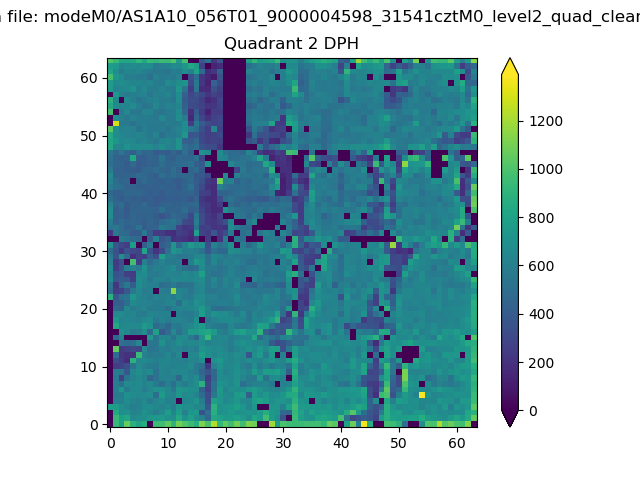 |
Quadrant C |
| Plot type | Count rate plots | Images |
|---|---|---|
| Comparison with Poisson distribution Blue bars denote a histogram of data divided into 1 sec bins. Red curve is a Poisson curve with rate = median count rate of data. |
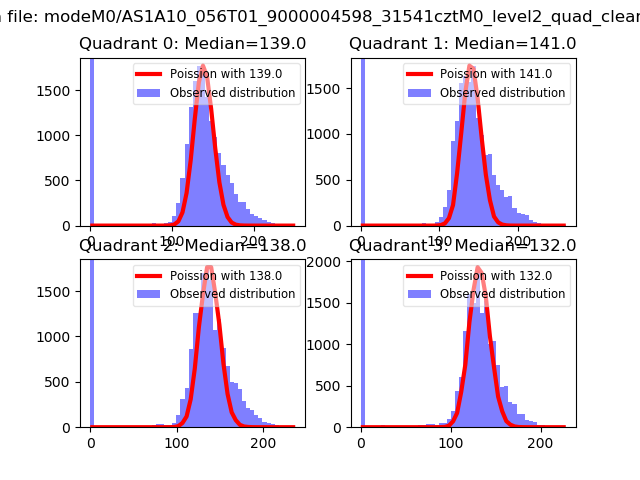 |
 |
| Quadrant-wise count rates Data is divided into 100 sec bins |
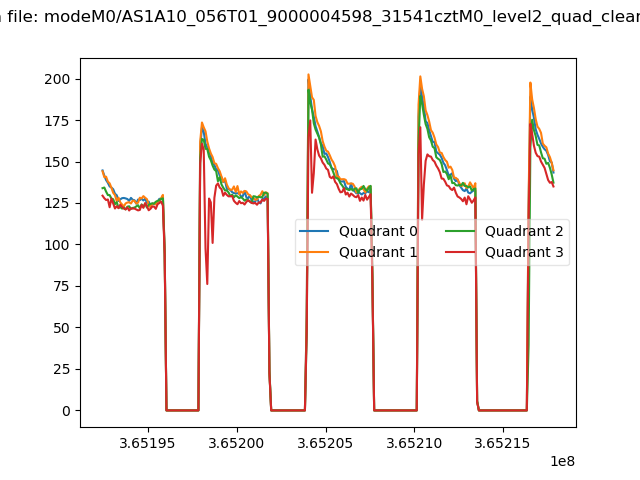 |
|
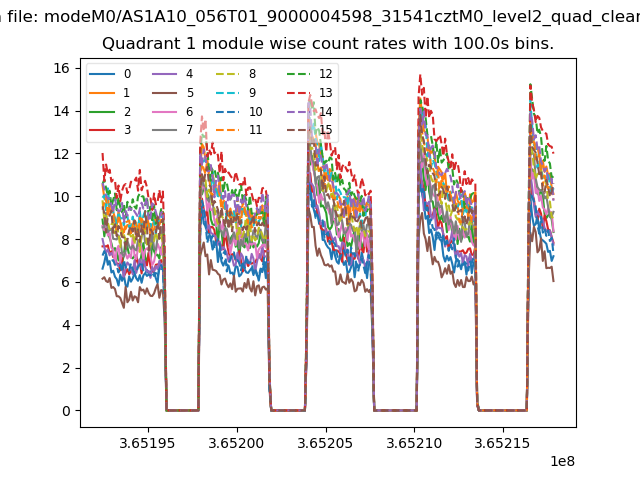
| Module-wise count rates for Quadrant A Data is divided into 100 sec bins |
 |
 |
| Module-wise count rates for Quadrant B Data is divided into 100 sec bins |
 |
 |
| Module-wise count rates for Quadrant C Data is divided into 100 sec bins |
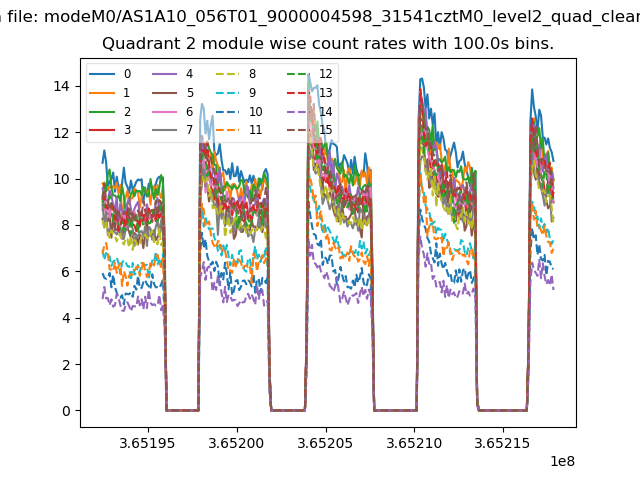 |
 |
| Module-wise count rates for Quadrant D Data is divided into 100 sec bins |
 |
 |
| Parameter | Plot |
|---|---|
| CZT HV Monitor | 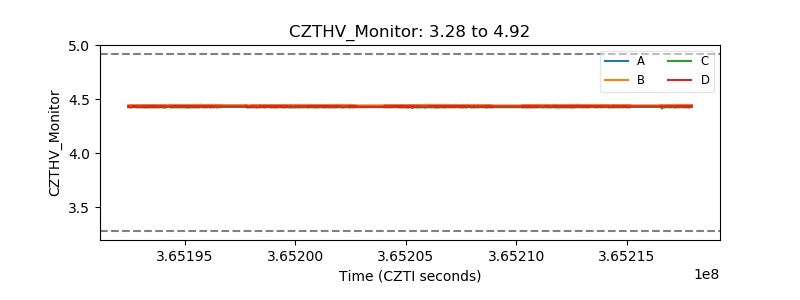 |
| D_VDD | 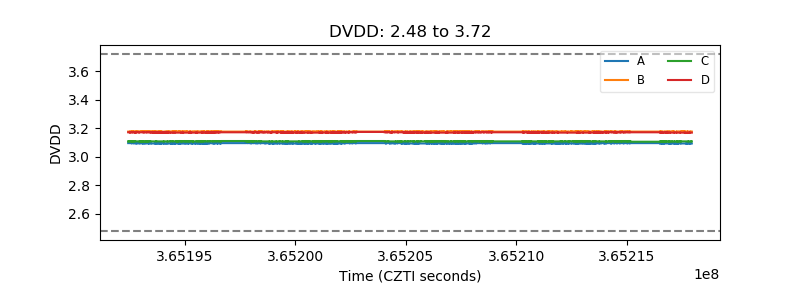 |
| Temperature 1 | 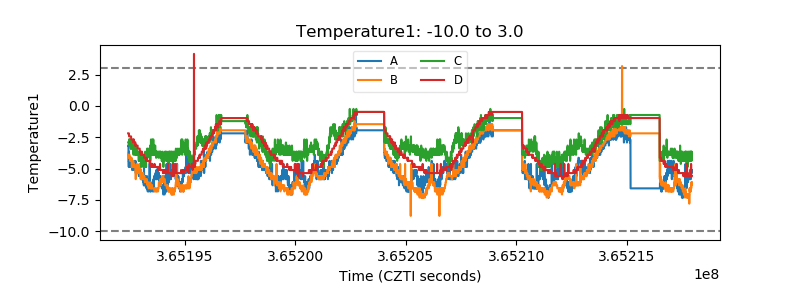 |
| Veto HV Monitor | 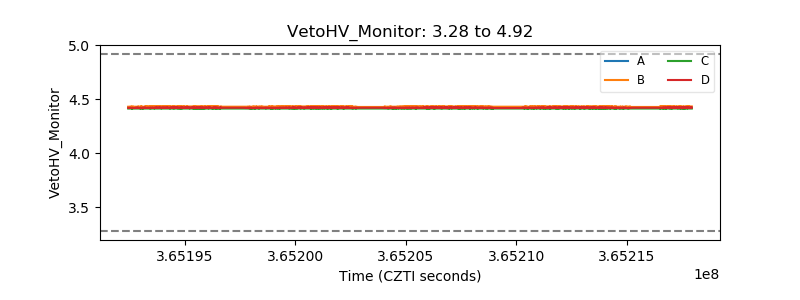 |
| Veto LLD |  |
| Alpha Counter | 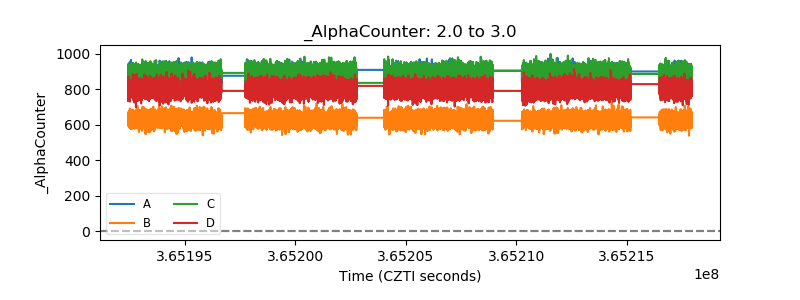 |
| _CPM_Rate | 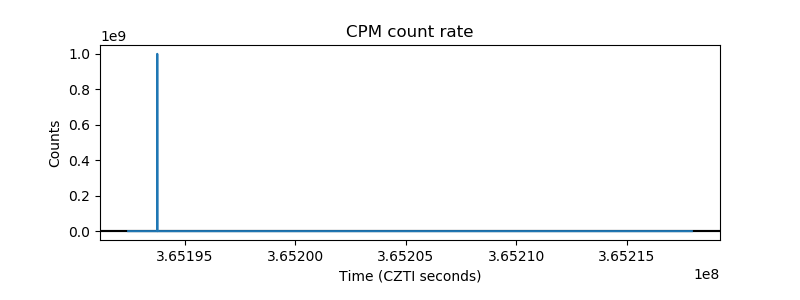 |
| CZT Counter | 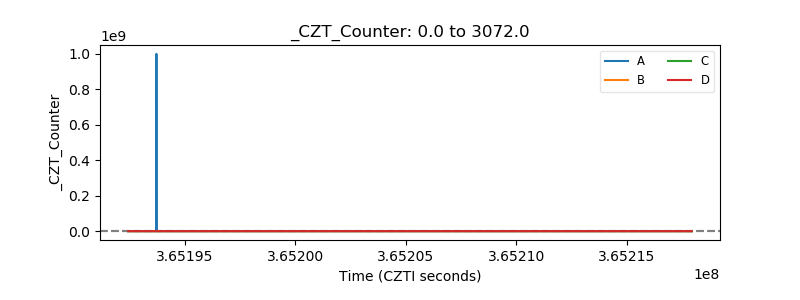 |
| +2.5 Volts monitor |  |
| +5 Volts monitor | 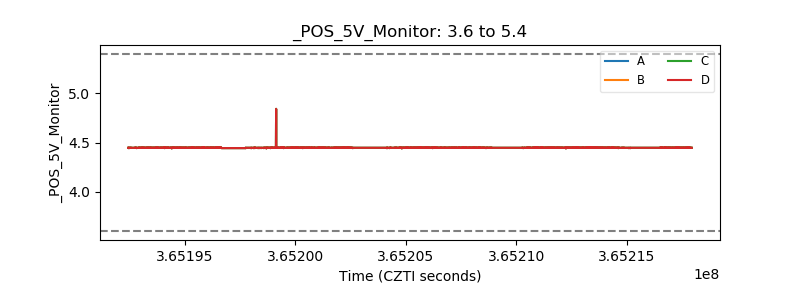 |
| _ROLL_ROT | 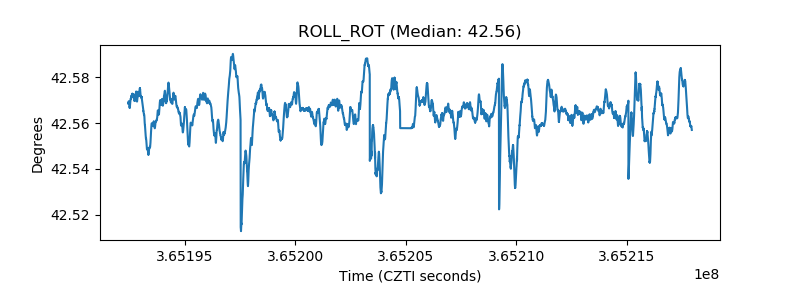 |
| _Roll_DEC | 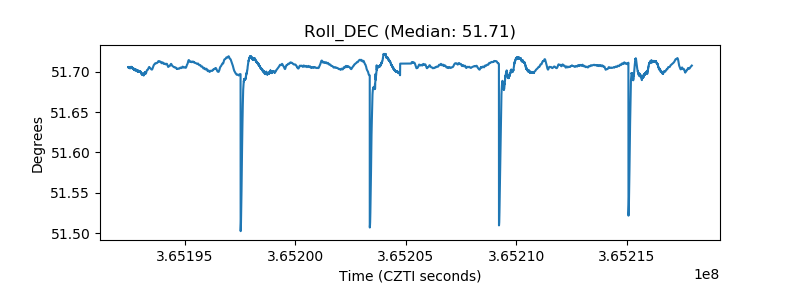 |
| _Roll_RA | 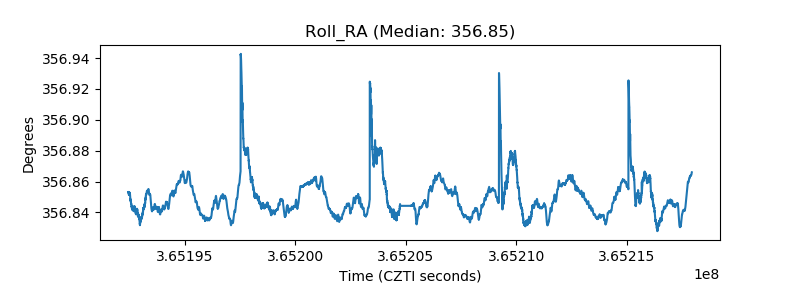 |
| Veto Counter | 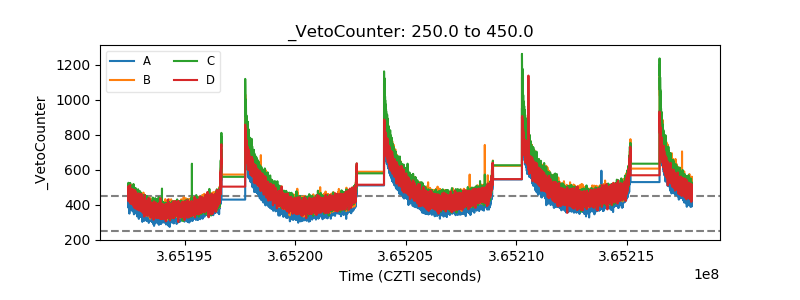 |