| Param | Original file | Final file |
|---|---|---|
| Filename | modeM0/AS1A10_056T01_9000004598_31542cztM0_level2.evt | modeM0/AS1A10_056T01_9000004598_31542cztM0_level2_quad_clean.evt |
| Size (bytes) | 560,093,760 | 103,472,640 |
| Size | 534.1 MB | 98.7 MB |
| Events in quadrant A | 3,199,782 | 688,621 |
| Events in quadrant B | 5,158,438 | 702,444 |
| Events in quadrant C | 3,812,925 | 648,229 |
| Events in quadrant D | 4,349,693 | 639,471 |
| Mode M0 | |||
|---|---|---|---|
| Quadrant | BADHDUFLAG | Total packets | Discarded packets |
| A | 0 | 13589 | 2 |
| B | 0 | 20041 | 2 |
| C | 0 | 15328 | 2 |
| D | 0 | 17234 | 2 |
| Mode M9 | |||
|---|---|---|---|
| Quadrant | BADHDUFLAG | Total packets | Discarded packets |
| A | 0 | 22 | 1 |
| B | 0 | 23 | 3 |
| C | 0 | 23 | 1 |
| D | 0 | 23 | 2 |
| Mode SS | |||
|---|---|---|---|
| Quadrant | BADHDUFLAG | Total packets | Discarded packets |
| A | 0 | 132 | 0 |
| B | 0 | 132 | 0 |
| C | 0 | 132 | 0 |
| D | 0 | 132 | 0 |
| Quadrant | Total seconds | Saturated seconds | Saturation percentage |
|---|---|---|---|
| A | 6524 | 29 | 0.444513% |
| B | 6524 | 130 | 1.992643% |
| C | 6524 | 291 | 4.460454% |
| D | 6524 | 35 | 0.536481% |
Noise dominated data is calculated using 1-second bins in cleaned event files. If a bin has >2000 counts, and if more than 50% of those come from <1% of pixels, then it is considered to be noise-dominated and hence unusable.
| Quadrant | # 1 sec bins | Bins with >0 counts | Bins with >2000 counts | High rate bins dominated by noise | Noise dominated (total time) | Noise dominated (detector-on time) | Marked lightcurve |
|---|---|---|---|---|---|---|---|
| A | 7829 | 6525 | 0 | 0 | 0.00% | 0.00% | 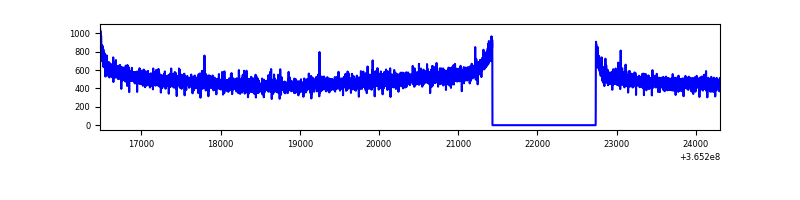 |
| B | 7829 | 6525 | 2 | 2 | 0.03% | 0.03% | 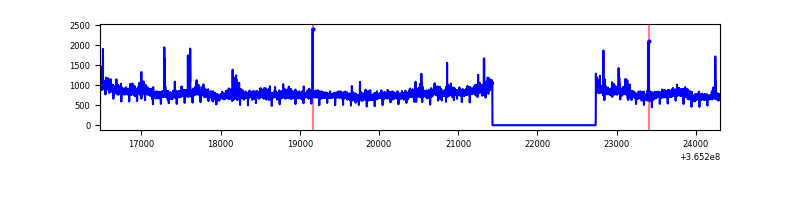 |
| C | 7829 | 6525 | 164 | 164 | 2.09% | 2.51% | 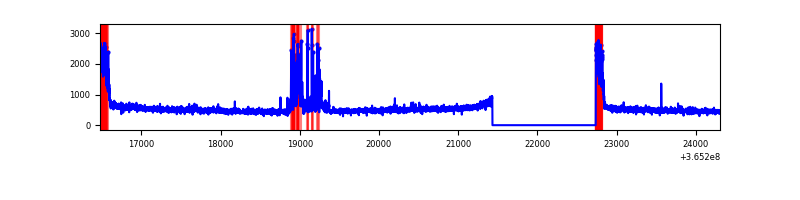 |
| D | 7829 | 6525 | 14 | 14 | 0.18% | 0.21% | 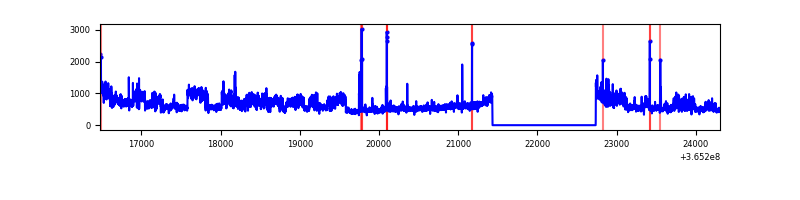 |
Top three noisy pixels from each quadrant. If the there are fewer than three noisy pixels in the level2.evt file, extra rows are filled as -1
| Pixel properties | Quadrant properties | ||||||
|---|---|---|---|---|---|---|---|
| Quadrant | DetID | PixID | Counts | Sigma | Mean | Median | Sigma |
| A | 13 | 254 | 11609 | 65.9 | 827 | 813 | 163.8 |
| A | 3 | 137 | 7965 | 43.66 | 827 | 813 | 163.8 |
| A | 0 | 226 | 6718 | 36.05 | 827 | 813 | 163.8 |
| B | 6 | 159 | 1763645 | 11429.55 | 829 | 809 | 154.2 |
| B | 4 | 80 | 71892 | 460.87 | 829 | 809 | 154.2 |
| B | 0 | 190 | 30582 | 193.04 | 829 | 809 | 154.2 |
| C | 0 | 10 | 362364 | 2017.22 | 780 | 788 | 179.2 |
| C | 10 | 22 | 227923 | 1267.18 | 780 | 788 | 179.2 |
| C | 14 | 238 | 127934 | 709.34 | 780 | 788 | 179.2 |
| D | 8 | 195 | 1271290 | 6862.87 | 790 | 768 | 185.1 |
| D | 2 | 250 | 53026 | 282.28 | 790 | 768 | 185.1 |
| D | 2 | 234 | 25431 | 133.22 | 790 | 768 | 185.1 |
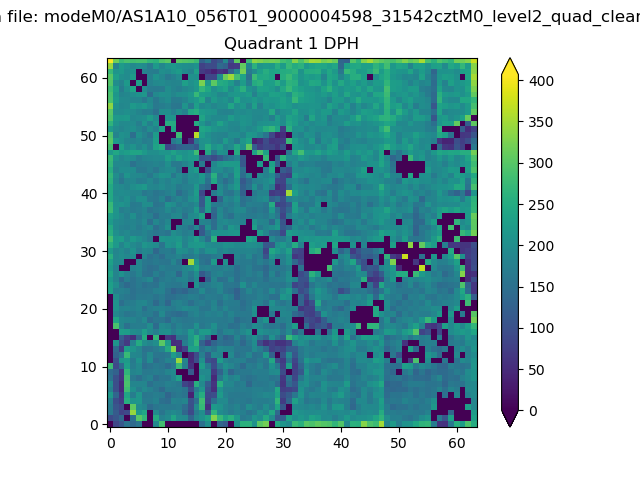
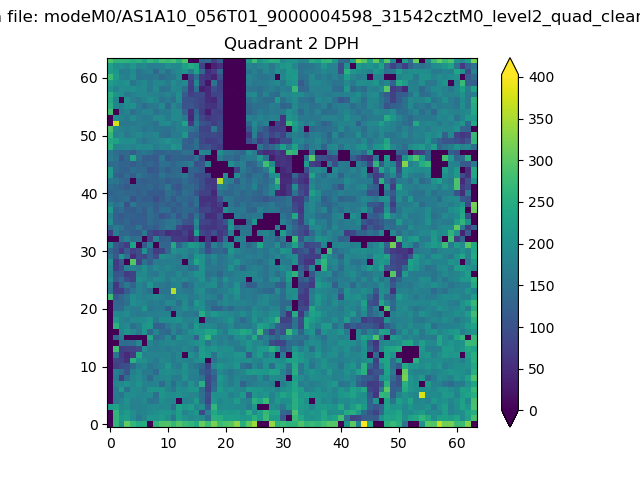
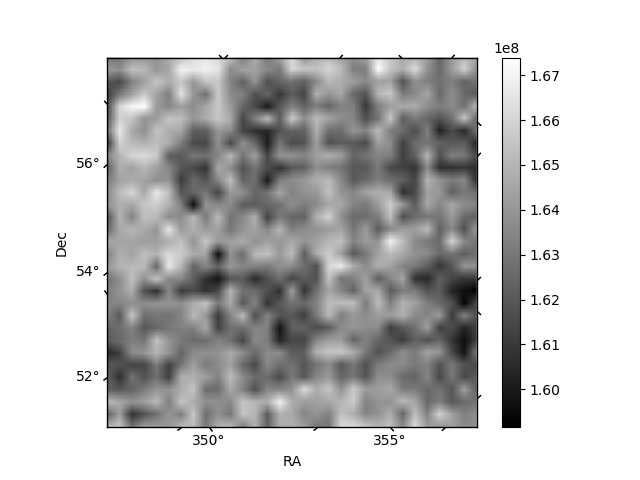
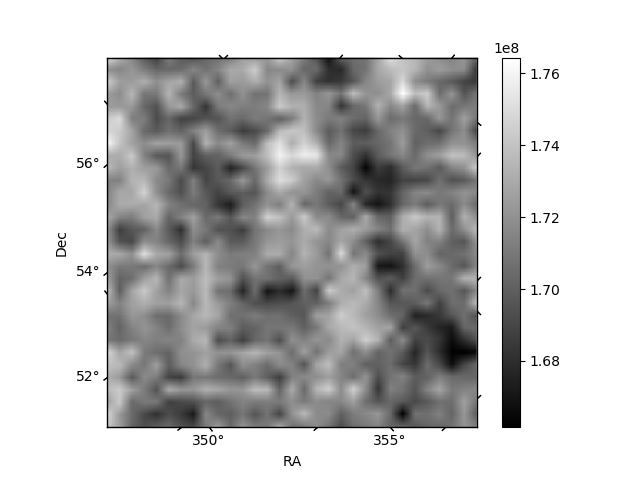
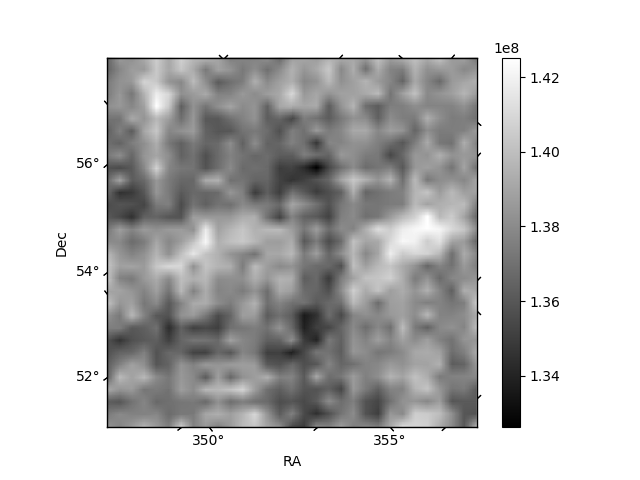
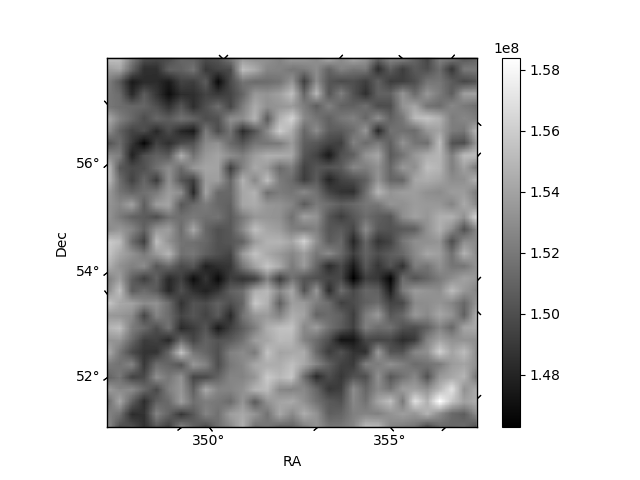
Histogram calculated using DETX and DETY for each event in the final _common_clean file
| Quadrant A |  |
 |
Quadrant B |
|---|---|---|---|
| Quadrant D |  |
 |
Quadrant C |
| Plot type | Count rate plots | Images |
|---|---|---|
| Comparison with Poisson distribution Blue bars denote a histogram of data divided into 1 sec bins. Red curve is a Poisson curve with rate = median count rate of data. |
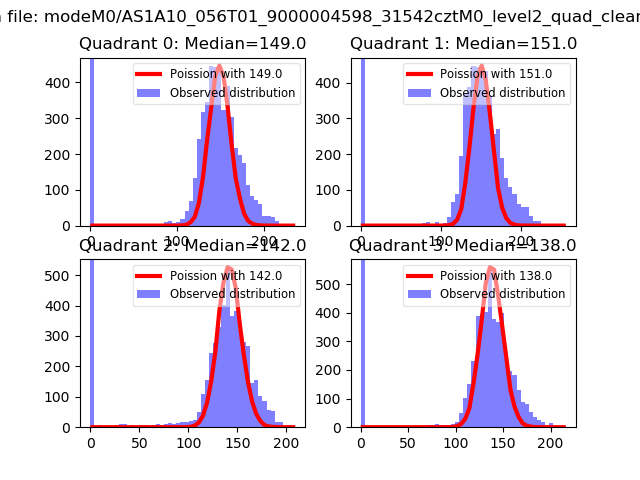 |
 |
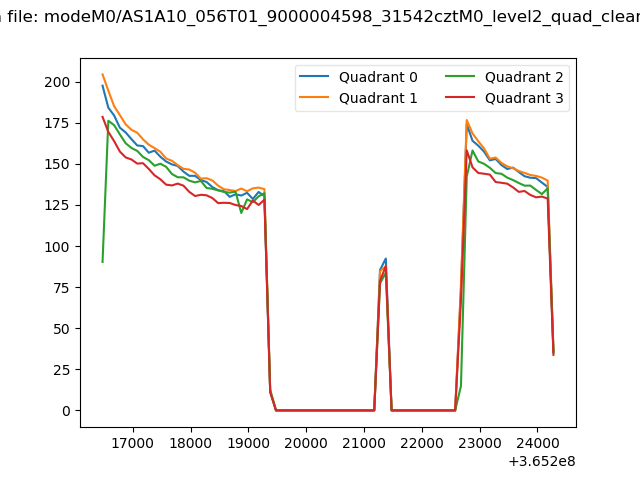
| Quadrant-wise count rates Data is divided into 100 sec bins |
 |
|
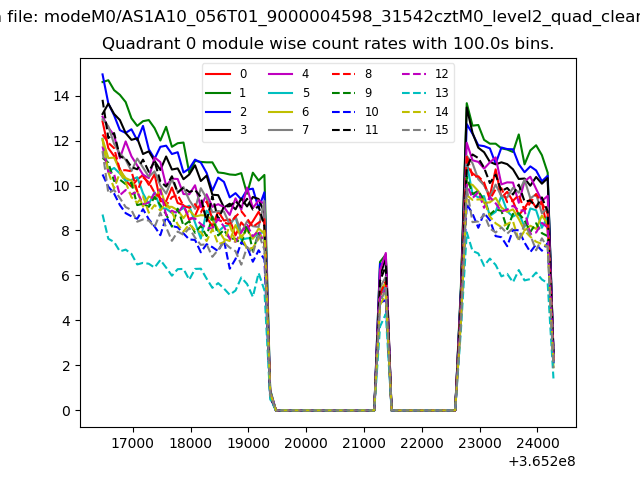
| Module-wise count rates for Quadrant A Data is divided into 100 sec bins |
 |
 |
| Module-wise count rates for Quadrant B Data is divided into 100 sec bins |
 |
 |
| Module-wise count rates for Quadrant C Data is divided into 100 sec bins |
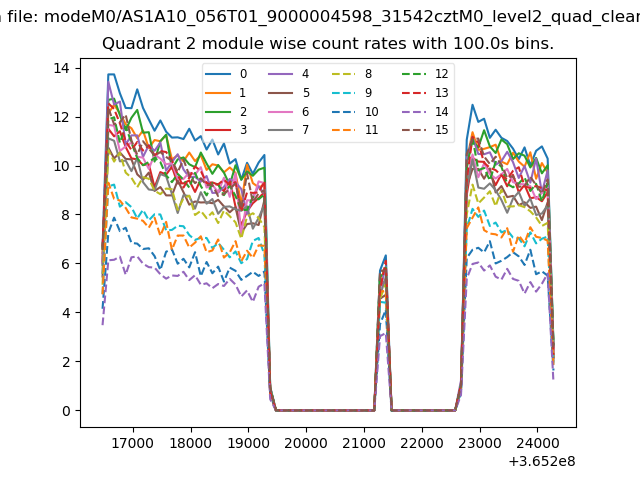 |
 |
| Module-wise count rates for Quadrant D Data is divided into 100 sec bins |
 |
 |
| Parameter | Plot |
|---|---|
| CZT HV Monitor |  |
| D_VDD | 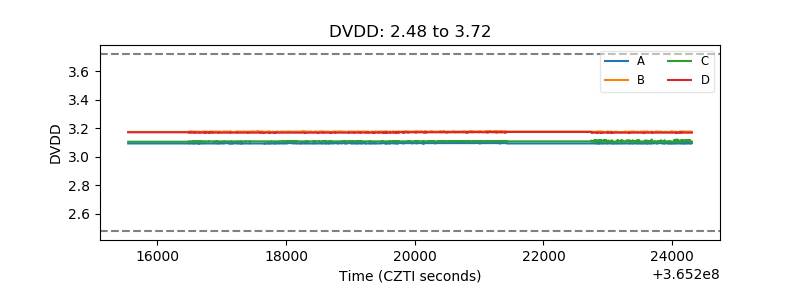 |
| Temperature 1 | 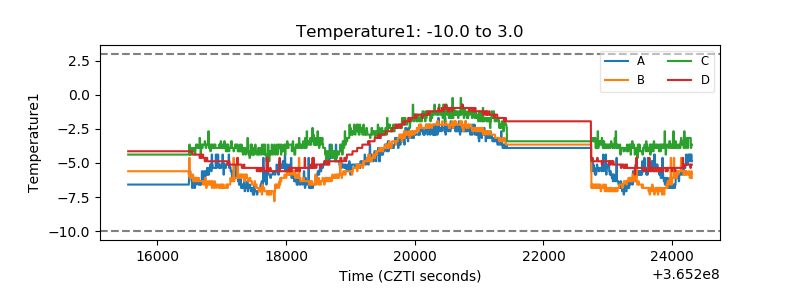 |
| Veto HV Monitor | 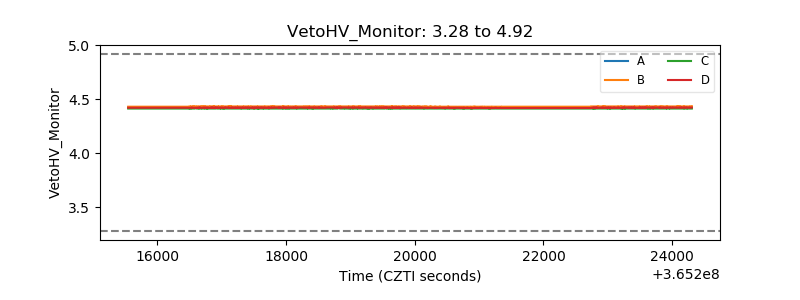 |
| Veto LLD | 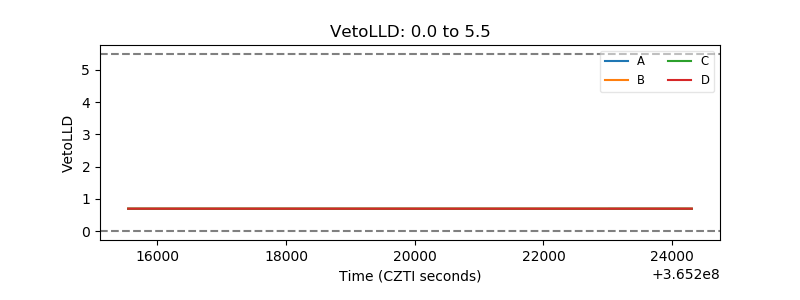 |
| Alpha Counter | 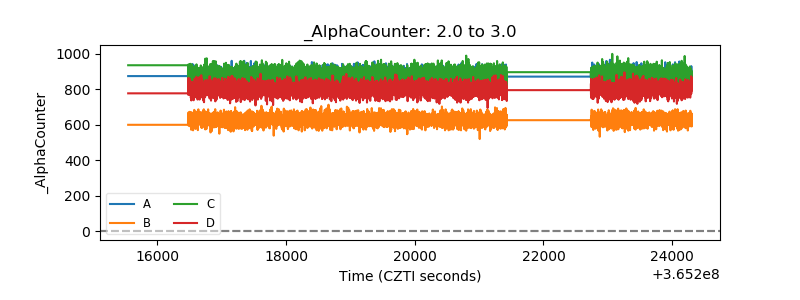 |
| _CPM_Rate | 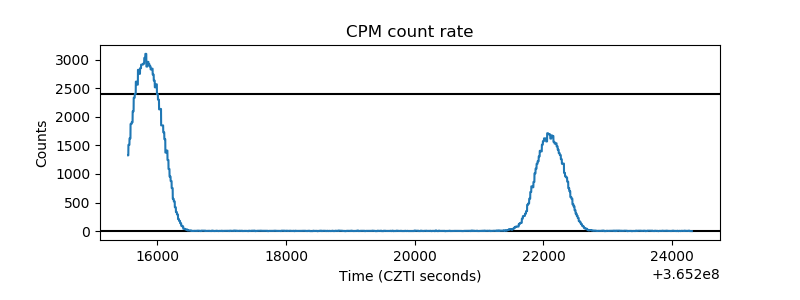 |
| CZT Counter |  |
| +2.5 Volts monitor |  |
| +5 Volts monitor |  |
| _ROLL_ROT | 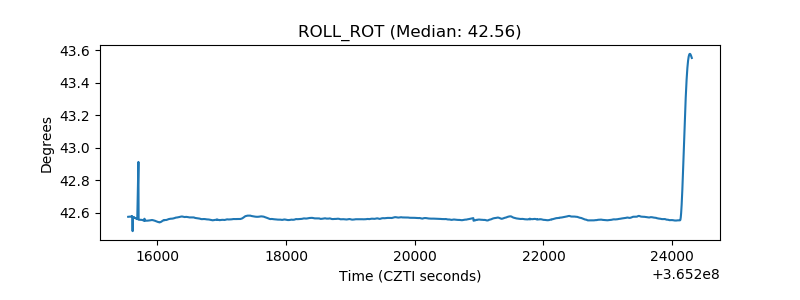 |
| _Roll_DEC | 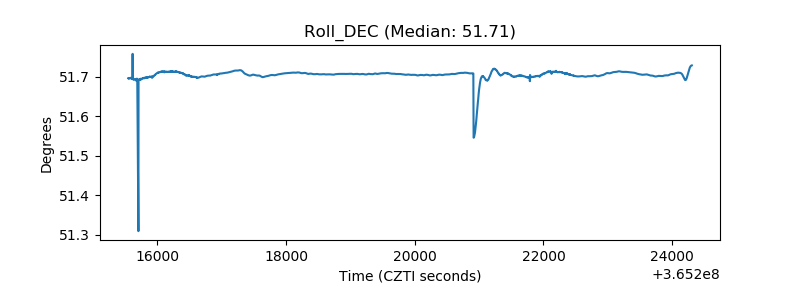 |
| _Roll_RA | 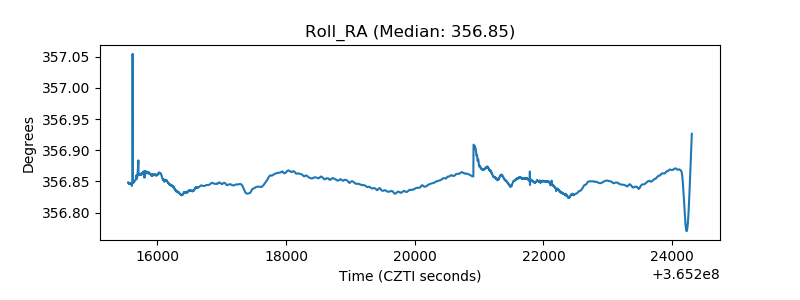 |
| Veto Counter | 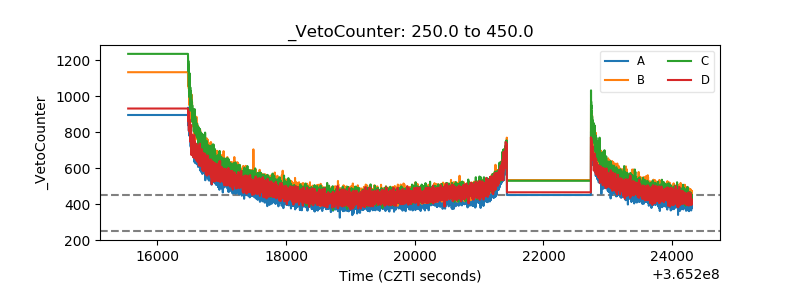 |