| Param | Original file | Final file |
|---|---|---|
| Filename | modeM0/AS1A10_056T01_9000004598_31543cztM0_level2.evt | modeM0/AS1A10_056T01_9000004598_31543cztM0_level2_quad_clean.evt |
| Size (bytes) | 457,882,560 | 83,306,880 |
| Size | 436.7 MB | 79.4 MB |
| Events in quadrant A | 2,737,484 | 538,592 |
| Events in quadrant B | 4,501,224 | 547,373 |
| Events in quadrant C | 2,910,042 | 520,045 |
| Events in quadrant D | 3,321,386 | 508,148 |
| Mode M0 | |||
|---|---|---|---|
| Quadrant | BADHDUFLAG | Total packets | Discarded packets |
| A | 0 | 11972 | 1 |
| B | 0 | 17841 | 1 |
| C | 0 | 12368 | 2 |
| D | 0 | 13646 | 1 |
| Mode M9 | |||
|---|---|---|---|
| Quadrant | BADHDUFLAG | Total packets | Discarded packets |
| A | 0 | 12 | 0 |
| B | 0 | 12 | 0 |
| C | 0 | 12 | 0 |
| D | 0 | 12 | 0 |
| Mode SS | |||
|---|---|---|---|
| Quadrant | BADHDUFLAG | Total packets | Discarded packets |
| A | 0 | 118 | 0 |
| B | 0 | 118 | 0 |
| C | 0 | 118 | 0 |
| D | 0 | 118 | 0 |
| Quadrant | Total seconds | Saturated seconds | Saturation percentage |
|---|---|---|---|
| A | 5850 | 9 | 0.153846% |
| B | 5851 | 51 | 0.871646% |
| C | 5850 | 82 | 1.401709% |
| D | 5850 | 18 | 0.307692% |
Noise dominated data is calculated using 1-second bins in cleaned event files. If a bin has >2000 counts, and if more than 50% of those come from <1% of pixels, then it is considered to be noise-dominated and hence unusable.
| Quadrant | # 1 sec bins | Bins with >0 counts | Bins with >2000 counts | High rate bins dominated by noise | Noise dominated (total time) | Noise dominated (detector-on time) | Marked lightcurve |
|---|---|---|---|---|---|---|---|
| A | 7010 | 5851 | 0 | 0 | 0.00% | 0.00% | 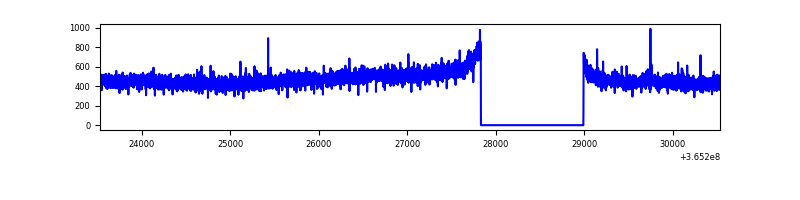 |
| B | 7011 | 5852 | 5 | 5 | 0.07% | 0.09% | 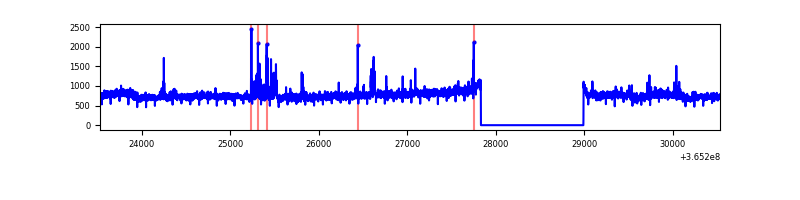 |
| C | 7010 | 5851 | 29 | 29 | 0.41% | 0.50% | 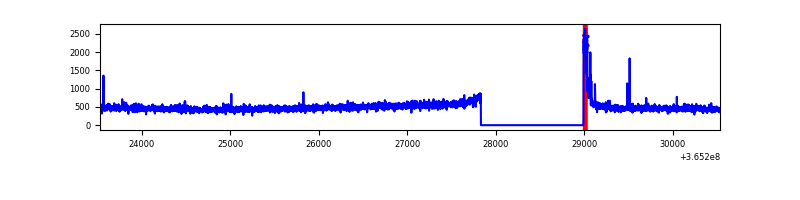 |
| D | 7010 | 5851 | 4 | 4 | 0.06% | 0.07% | 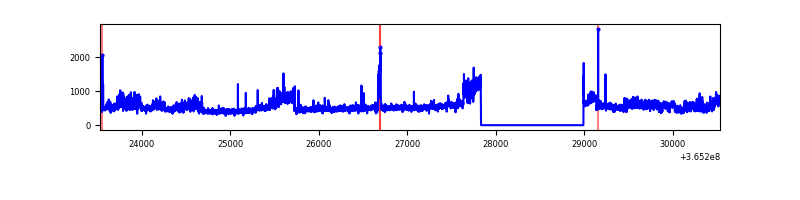 |
Top three noisy pixels from each quadrant. If the there are fewer than three noisy pixels in the level2.evt file, extra rows are filled as -1
| Pixel properties | Quadrant properties | ||||||
|---|---|---|---|---|---|---|---|
| Quadrant | DetID | PixID | Counts | Sigma | Mean | Median | Sigma |
| A | 13 | 254 | 8991 | 57.76 | 710 | 697 | 143.6 |
| A | 3 | 137 | 7172 | 45.09 | 710 | 697 | 143.6 |
| A | 0 | 226 | 5812 | 35.62 | 710 | 697 | 143.6 |
| B | 6 | 159 | 1569969 | 11657.46 | 706 | 688 | 134.6 |
| B | 0 | 190 | 69955 | 514.55 | 706 | 688 | 134.6 |
| B | 4 | 80 | 49399 | 361.85 | 706 | 688 | 134.6 |
| C | 14 | 238 | 110457 | 703.0 | 673 | 678 | 156.2 |
| C | 0 | 10 | 102174 | 649.96 | 673 | 678 | 156.2 |
| C | 4 | 175 | 19485 | 120.44 | 673 | 678 | 156.2 |
| D | 8 | 195 | 699930 | 4426.72 | 677 | 661 | 158.0 |
| D | 10 | 253 | 32179 | 199.52 | 677 | 661 | 158.0 |
| D | 2 | 234 | 23029 | 141.6 | 677 | 661 | 158.0 |
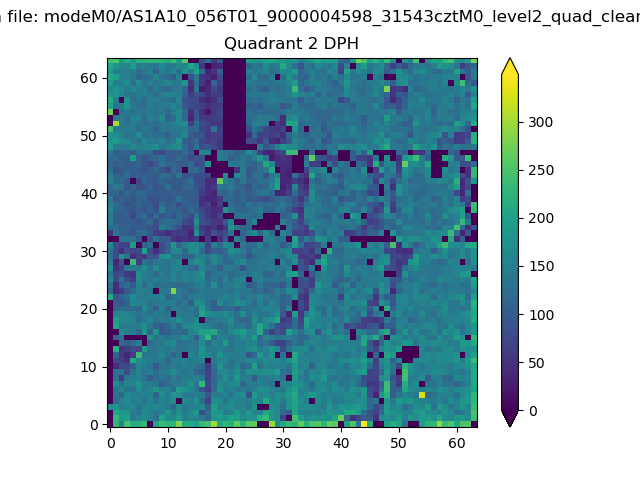
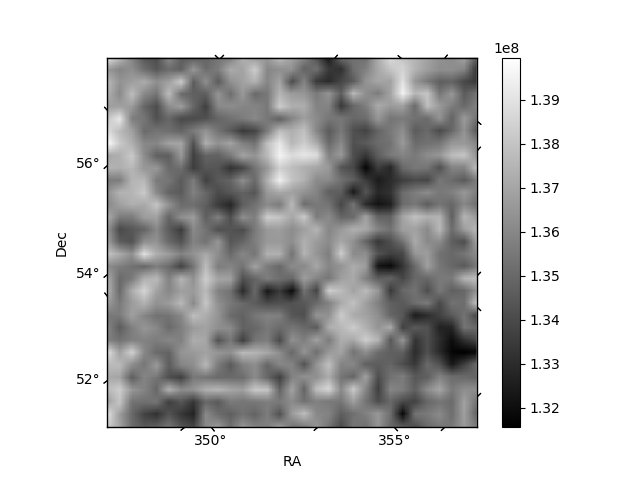
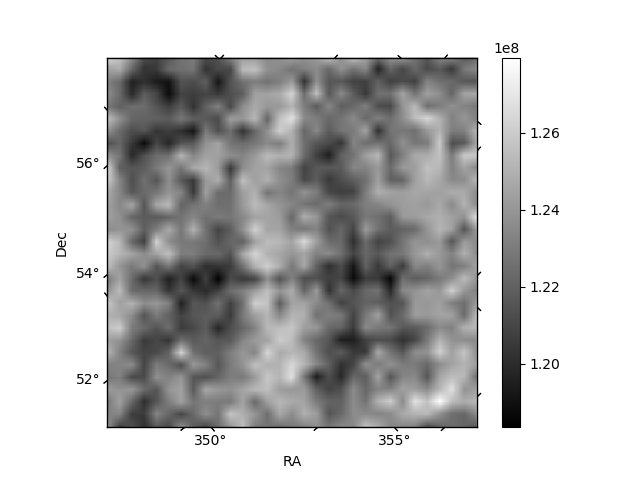
Histogram calculated using DETX and DETY for each event in the final _common_clean file
| Quadrant A | 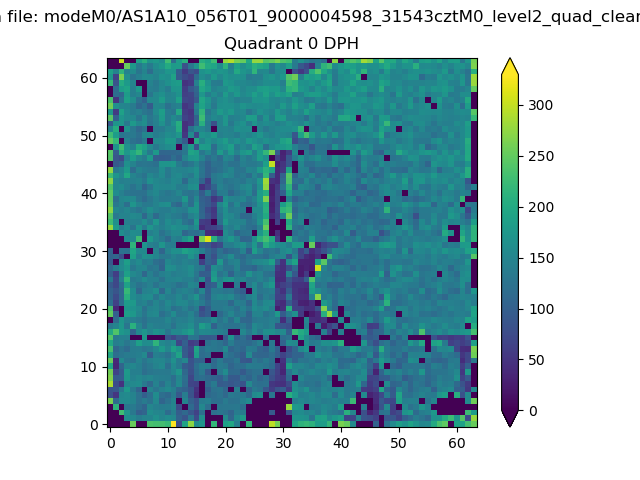 |
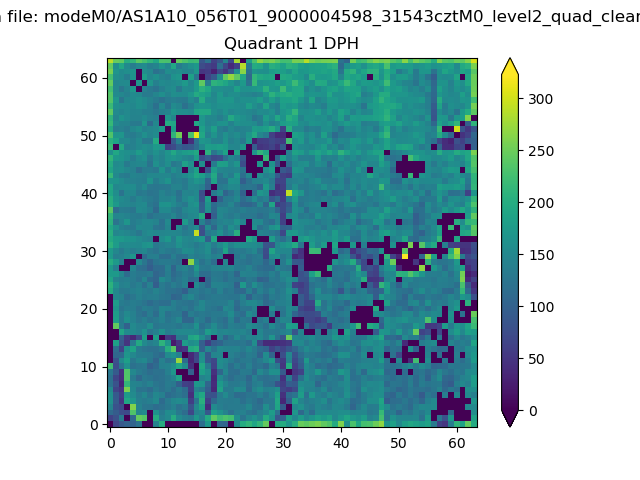 |
Quadrant B |
|---|---|---|---|
| Quadrant D | 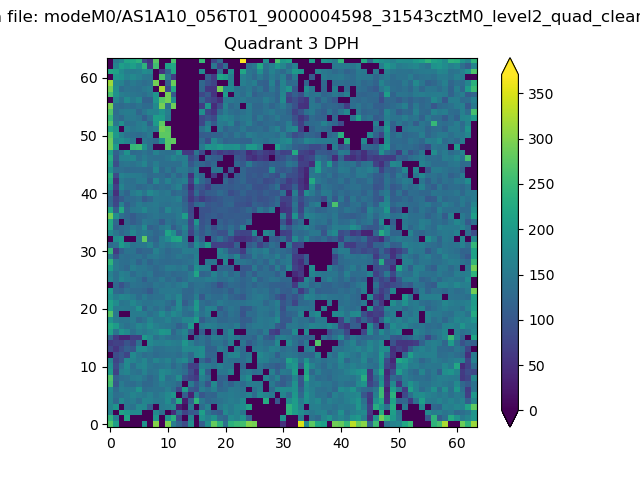 |
 |
Quadrant C |
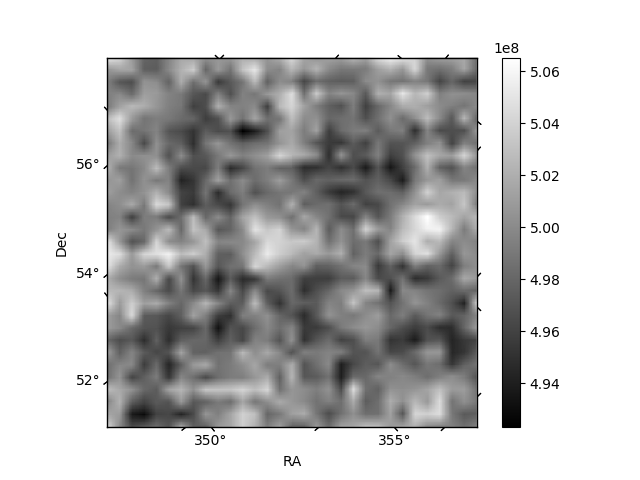
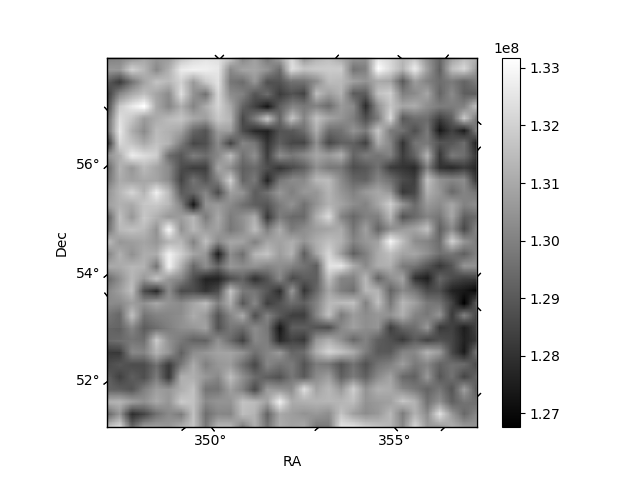
| Plot type | Count rate plots | Images |
|---|---|---|
| Comparison with Poisson distribution Blue bars denote a histogram of data divided into 1 sec bins. Red curve is a Poisson curve with rate = median count rate of data. |
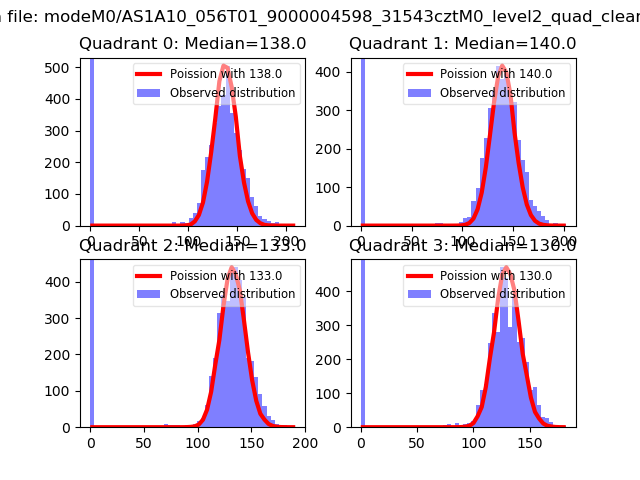 |
 |
| Quadrant-wise count rates Data is divided into 100 sec bins |
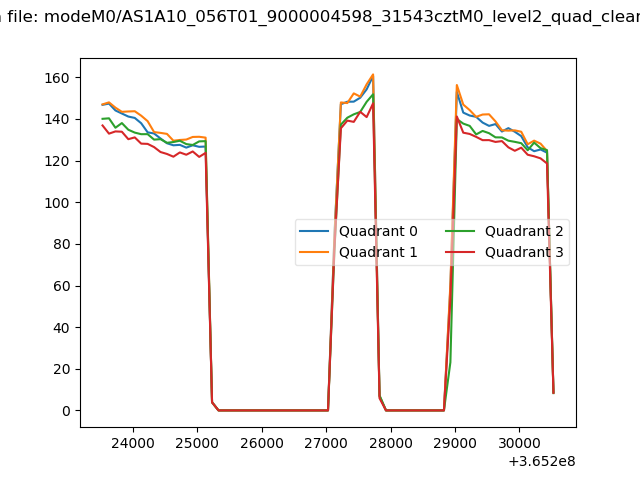 |
|
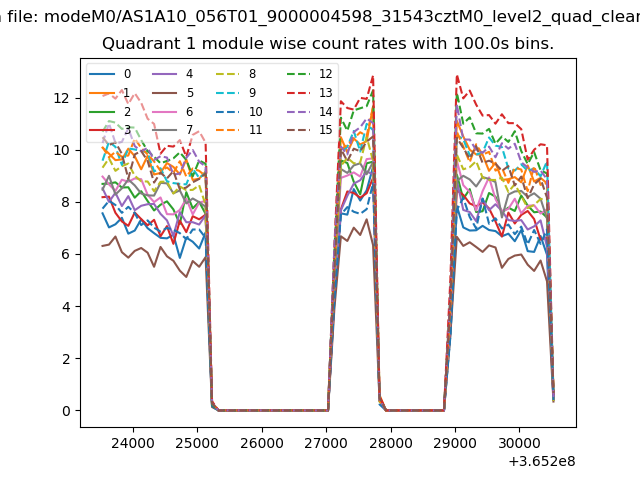
| Module-wise count rates for Quadrant A Data is divided into 100 sec bins |
 |
 |
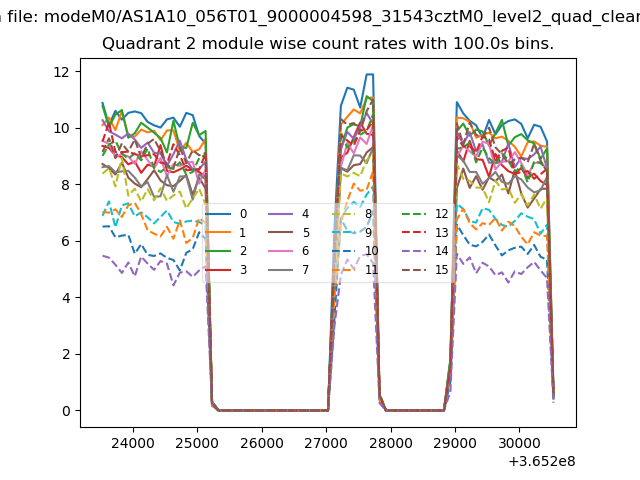
| Module-wise count rates for Quadrant B Data is divided into 100 sec bins |
 |
 |
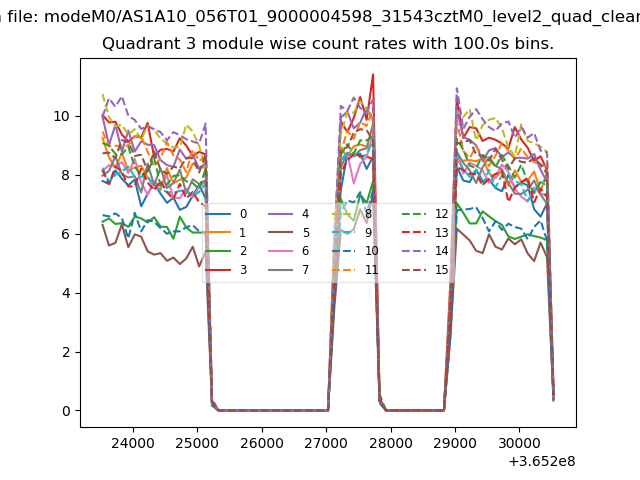
| Module-wise count rates for Quadrant C Data is divided into 100 sec bins |
 |
 |
| Module-wise count rates for Quadrant D Data is divided into 100 sec bins |
 |
 |
| Parameter | Plot |
|---|---|
| CZT HV Monitor | 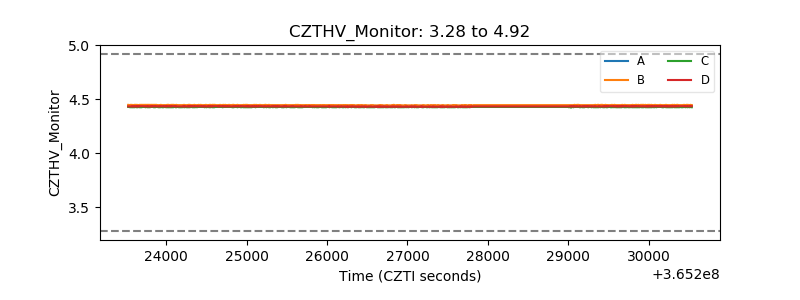 |
| D_VDD | 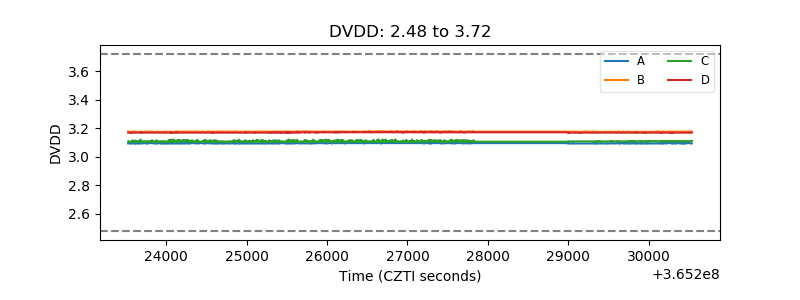 |
| Temperature 1 | 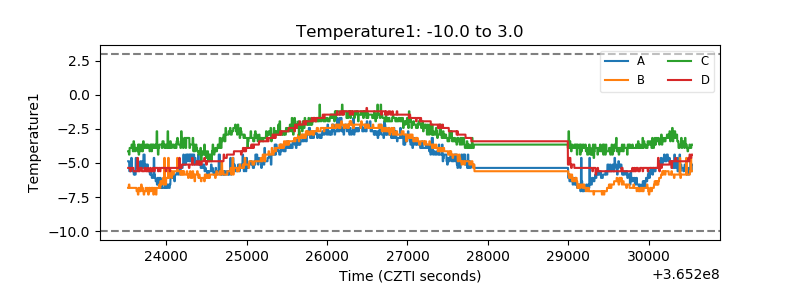 |
| Veto HV Monitor | 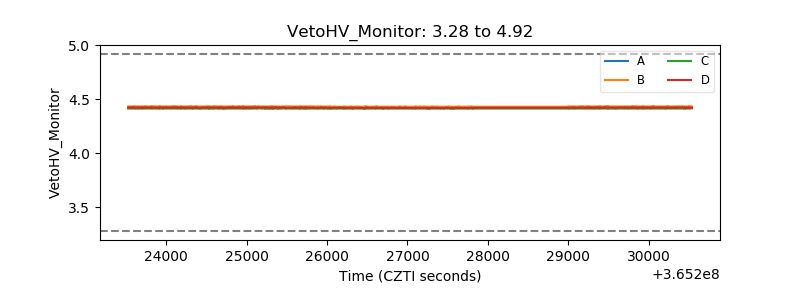 |
| Veto LLD | 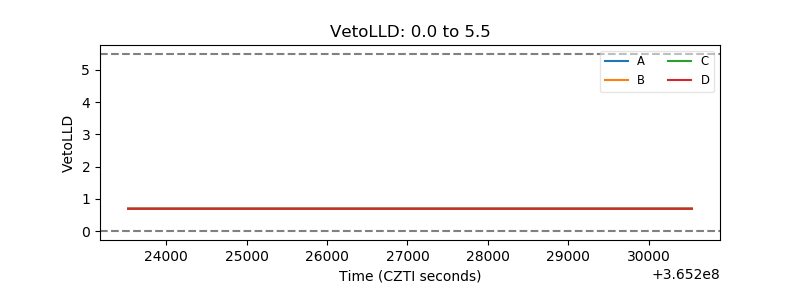 |
| Alpha Counter | 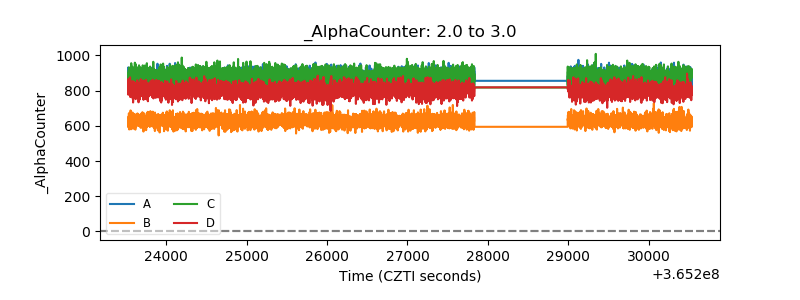 |
| _CPM_Rate | 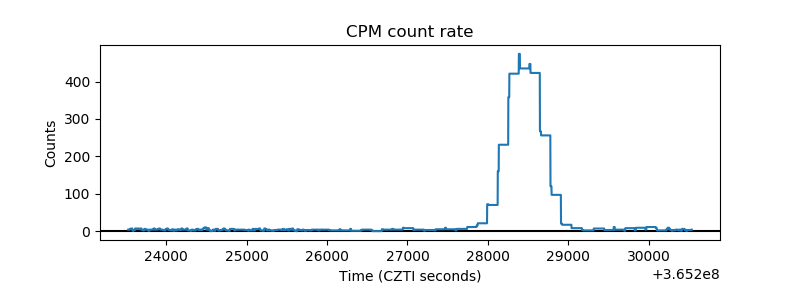 |
| CZT Counter | 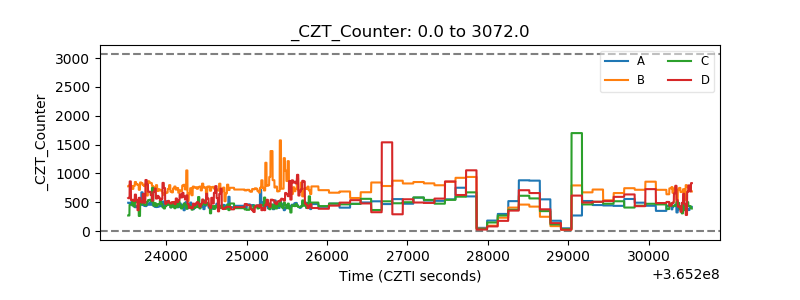 |
| +2.5 Volts monitor |  |
| +5 Volts monitor |  |
| _ROLL_ROT |  |
| _Roll_DEC |  |
| _Roll_RA | 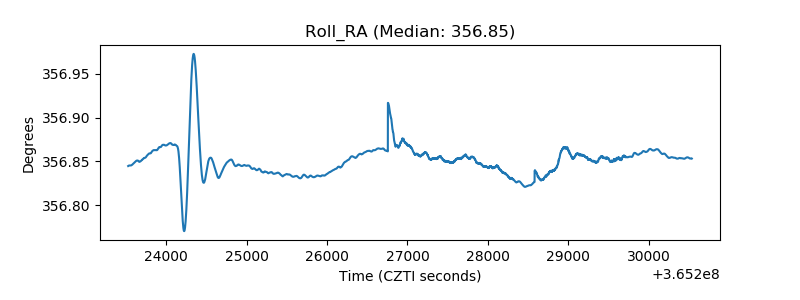 |
| Veto Counter |  |