| Param | Original file | Final file |
|---|---|---|
| Filename | modeM0/AS1A10_056T01_9000004598_31545cztM0_level2.evt | modeM0/AS1A10_056T01_9000004598_31545cztM0_level2_quad_clean.evt |
| Size (bytes) | 958,164,480 | 156,591,360 |
| Size | 913.8 MB | 149.3 MB |
| Events in quadrant A | 5,464,316 | 998,915 |
| Events in quadrant B | 8,833,093 | 1,008,135 |
| Events in quadrant C | 6,432,118 | 968,033 |
| Events in quadrant D | 7,493,353 | 952,759 |
| Mode M0 | |||
|---|---|---|---|
| Quadrant | BADHDUFLAG | Total packets | Discarded packets |
| A | 0 | 24074 | 2 |
| B | 0 | 35675 | 2 |
| C | 0 | 26684 | 2 |
| D | 0 | 30672 | 2 |
| Mode M9 | |||
|---|---|---|---|
| Quadrant | BADHDUFLAG | Total packets | Discarded packets |
| A | 0 | 11 | 0 |
| B | 0 | 11 | 0 |
| C | 0 | 11 | 0 |
| D | 0 | 11 | 0 |
| Mode SS | |||
|---|---|---|---|
| Quadrant | BADHDUFLAG | Total packets | Discarded packets |
| A | 0 | 238 | 0 |
| B | 0 | 238 | 0 |
| C | 0 | 238 | 0 |
| D | 0 | 238 | 0 |
| Quadrant | Total seconds | Saturated seconds | Saturation percentage |
|---|---|---|---|
| A | 11778 | 193 | 1.638648% |
| B | 11778 | 341 | 2.895228% |
| C | 11778 | 545 | 4.627271% |
| D | 11779 | 217 | 1.842262% |
Noise dominated data is calculated using 1-second bins in cleaned event files. If a bin has >2000 counts, and if more than 50% of those come from <1% of pixels, then it is considered to be noise-dominated and hence unusable.
| Quadrant | # 1 sec bins | Bins with >0 counts | Bins with >2000 counts | High rate bins dominated by noise | Noise dominated (total time) | Noise dominated (detector-on time) | Marked lightcurve |
|---|---|---|---|---|---|---|---|
| A | 12868 | 11778 | 0 | 0 | 0.00% | 0.00% | 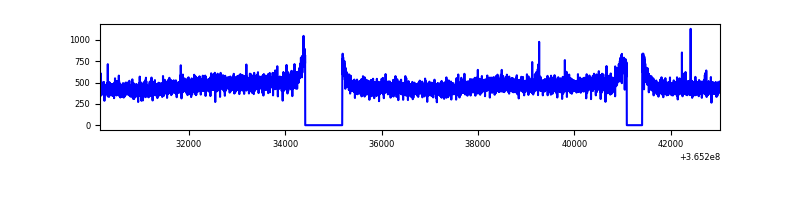 |
| B | 12868 | 11778 | 15 | 15 | 0.12% | 0.13% | 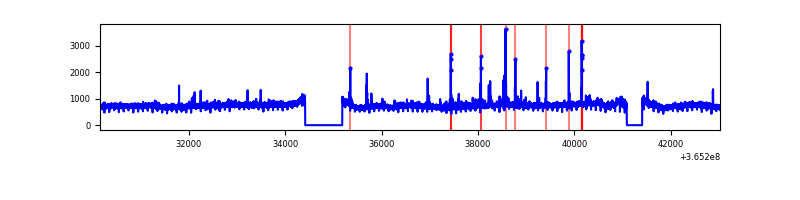 |
| C | 12868 | 11778 | 94 | 94 | 0.73% | 0.80% | 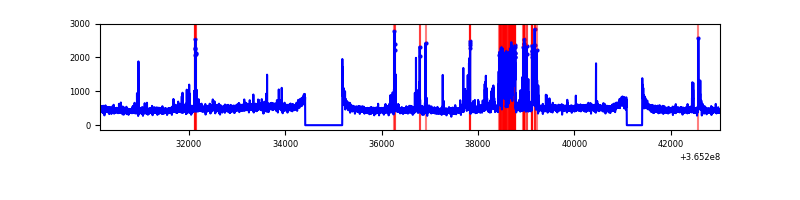 |
| D | 12869 | 11780 | 57 | 57 | 0.44% | 0.48% | 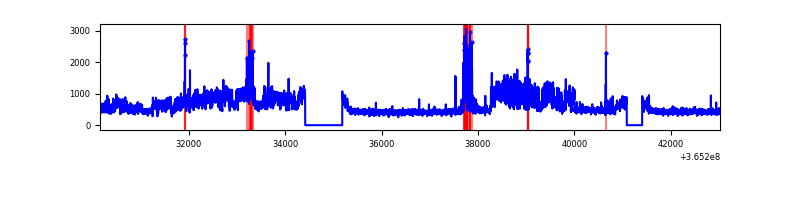 |
Top three noisy pixels from each quadrant. If the there are fewer than three noisy pixels in the level2.evt file, extra rows are filled as -1
| Pixel properties | Quadrant properties | ||||||
|---|---|---|---|---|---|---|---|
| Quadrant | DetID | PixID | Counts | Sigma | Mean | Median | Sigma |
| A | 13 | 254 | 19233 | 62.89 | 1416 | 1386 | 283.8 |
| A | 3 | 137 | 14751 | 47.09 | 1416 | 1386 | 283.8 |
| A | 0 | 226 | 11970 | 37.3 | 1416 | 1386 | 283.8 |
| B | 6 | 159 | 3114354 | 11624.57 | 1400 | 1363 | 267.8 |
| B | 4 | 80 | 81526 | 299.35 | 1400 | 1363 | 267.8 |
| B | 10 | 247 | 58767 | 214.36 | 1400 | 1363 | 267.8 |
| C | 10 | 22 | 763812 | 2440.74 | 1342 | 1349 | 312.4 |
| C | 14 | 238 | 216540 | 688.85 | 1342 | 1349 | 312.4 |
| C | 0 | 10 | 73191 | 229.98 | 1342 | 1349 | 312.4 |
| D | 8 | 195 | 2017671 | 6182.96 | 1367 | 1326 | 326.1 |
| D | 12 | 233 | 189664 | 577.52 | 1367 | 1326 | 326.1 |
| D | 12 | 218 | 53380 | 159.62 | 1367 | 1326 | 326.1 |
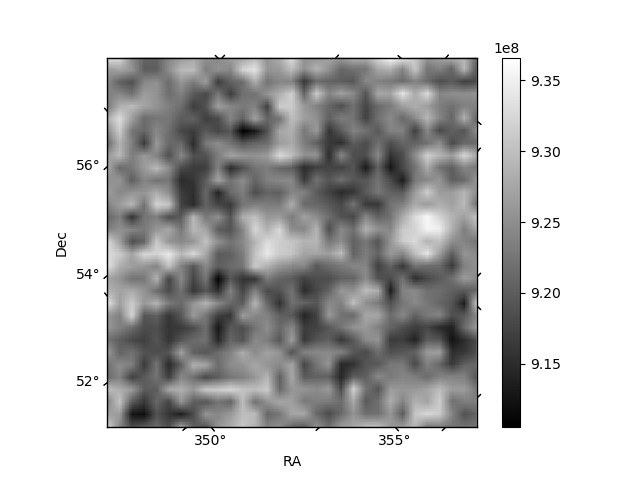
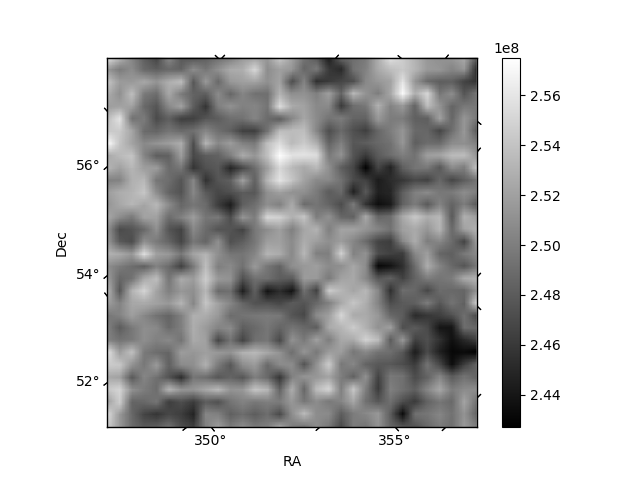
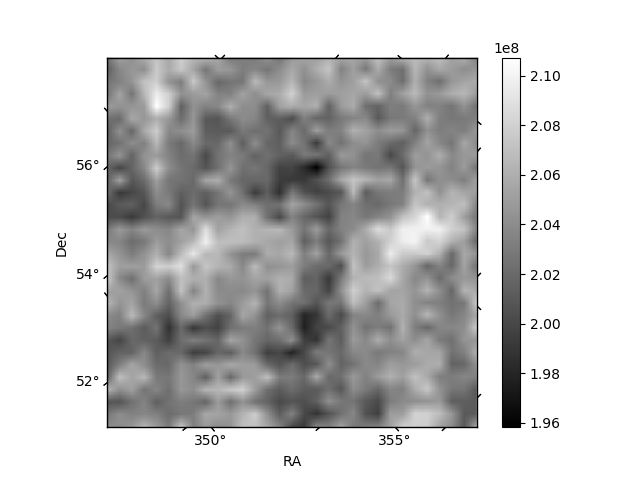
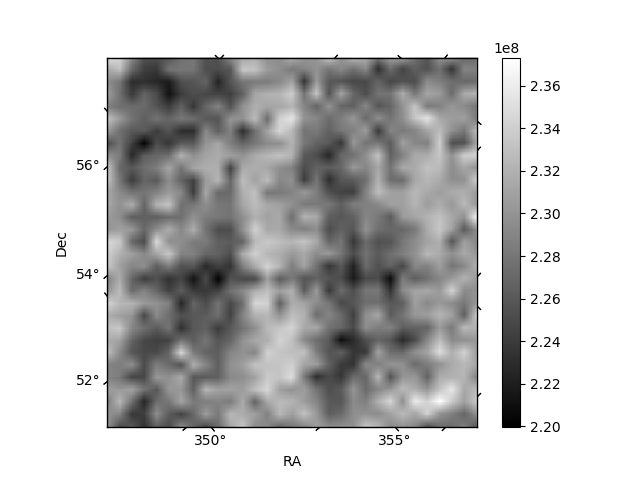
Histogram calculated using DETX and DETY for each event in the final _common_clean file
| Quadrant A | 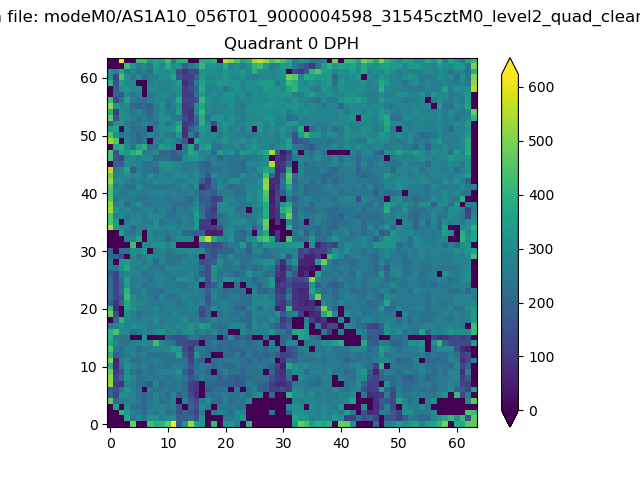 |
 |
Quadrant B |
|---|---|---|---|
| Quadrant D | 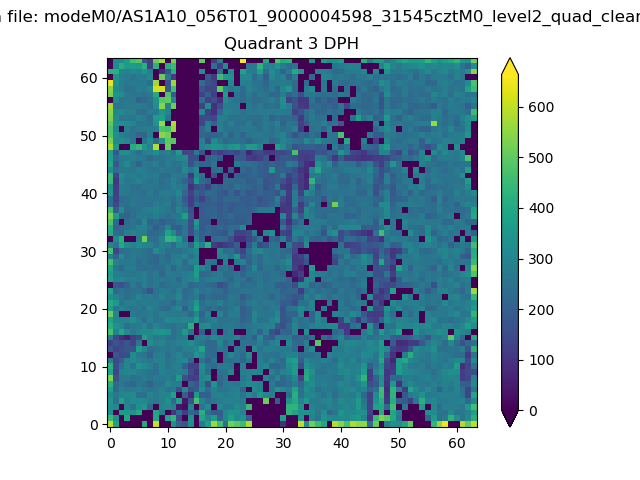 |
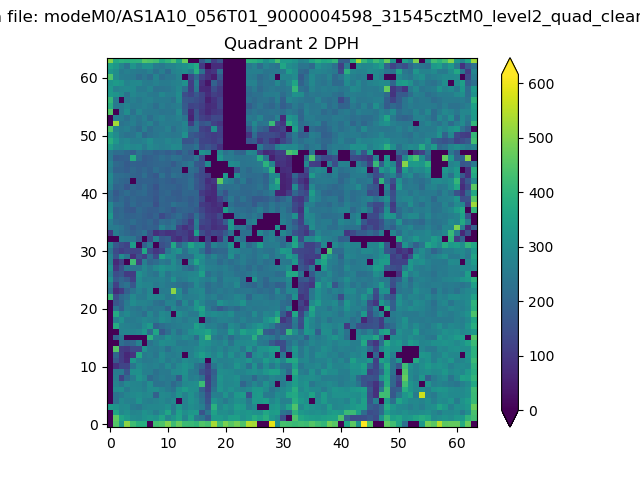 |
Quadrant C |
| Plot type | Count rate plots | Images |
|---|---|---|
| Comparison with Poisson distribution Blue bars denote a histogram of data divided into 1 sec bins. Red curve is a Poisson curve with rate = median count rate of data. |
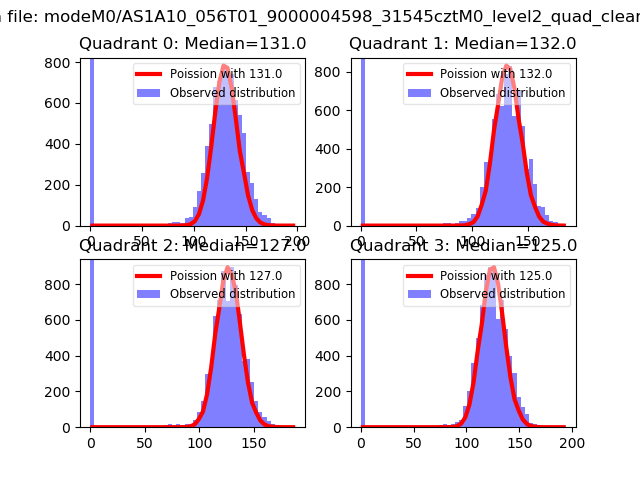 |
 |
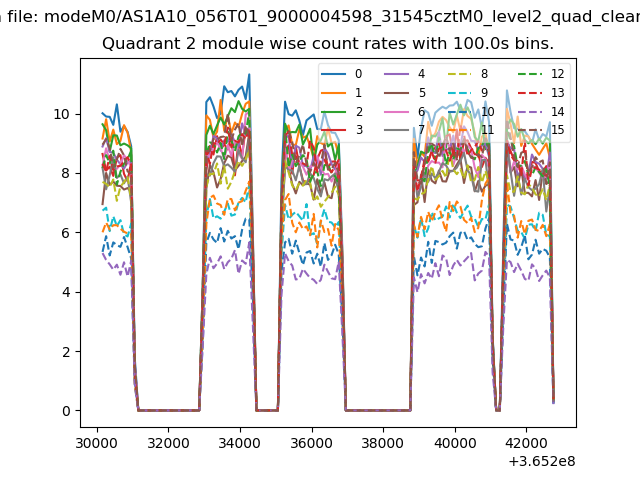
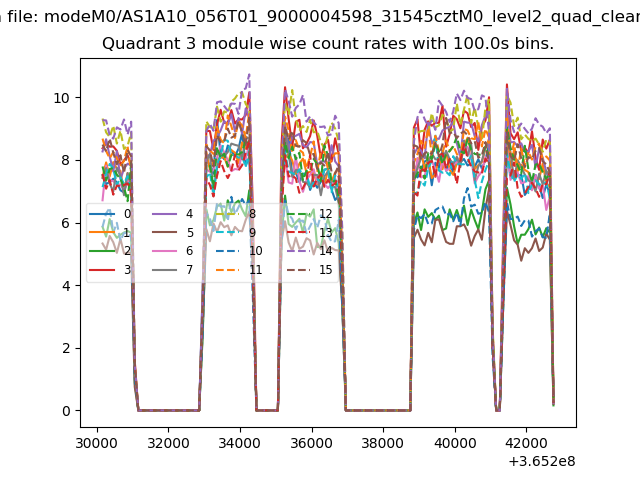
| Quadrant-wise count rates Data is divided into 100 sec bins |
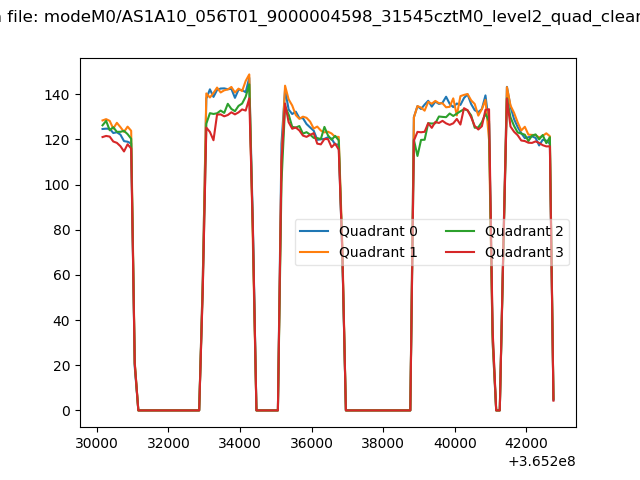 |
|
| Module-wise count rates for Quadrant A Data is divided into 100 sec bins |
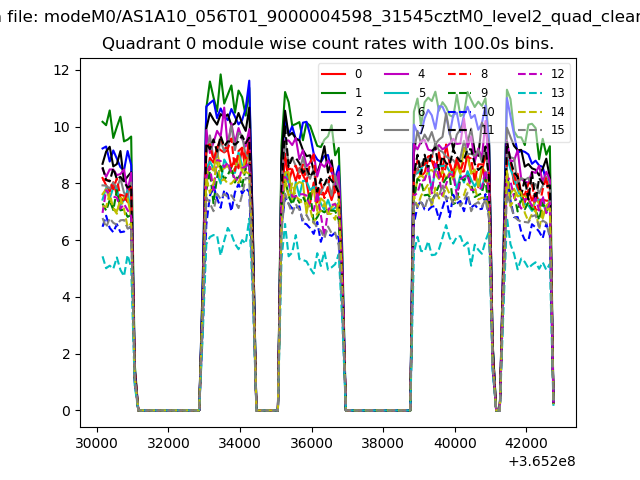 |
 |
| Module-wise count rates for Quadrant B Data is divided into 100 sec bins |
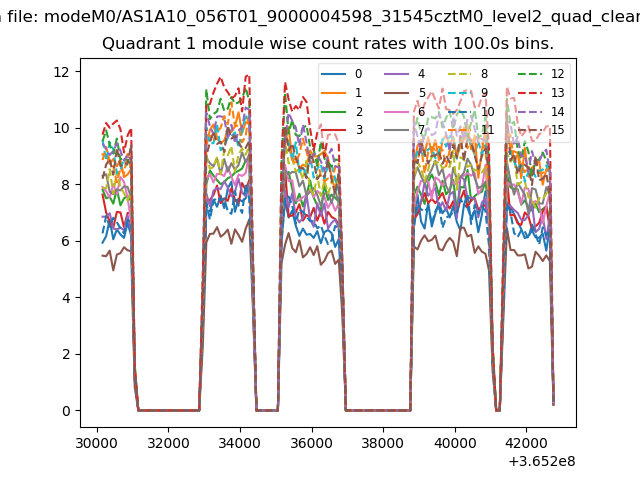 |
 |
| Module-wise count rates for Quadrant C Data is divided into 100 sec bins |
 |
 |
| Module-wise count rates for Quadrant D Data is divided into 100 sec bins |
 |
 |
| Parameter | Plot |
|---|---|
| CZT HV Monitor | 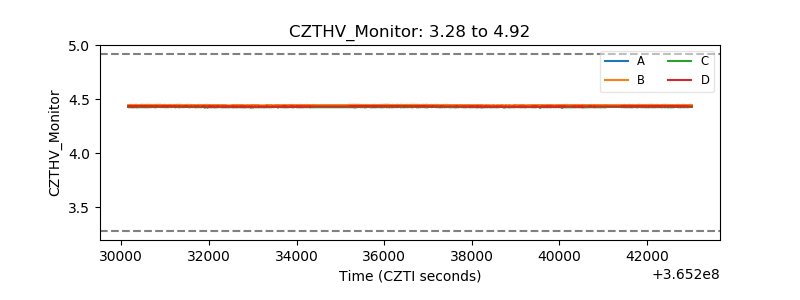 |
| D_VDD | 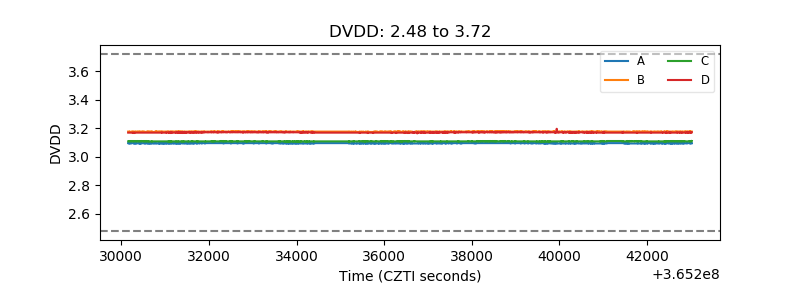 |
| Temperature 1 | 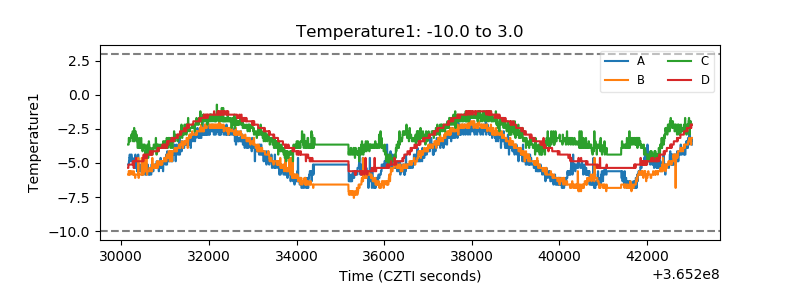 |
| Veto HV Monitor | 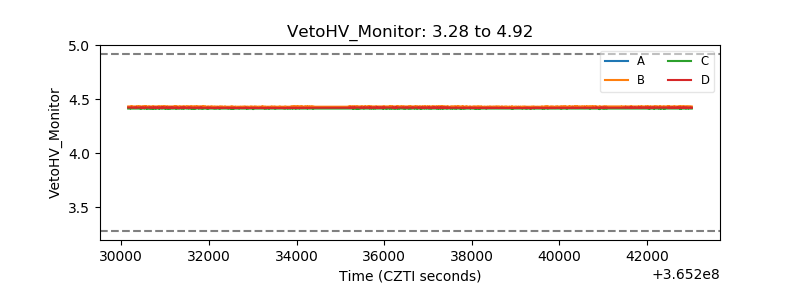 |
| Veto LLD | 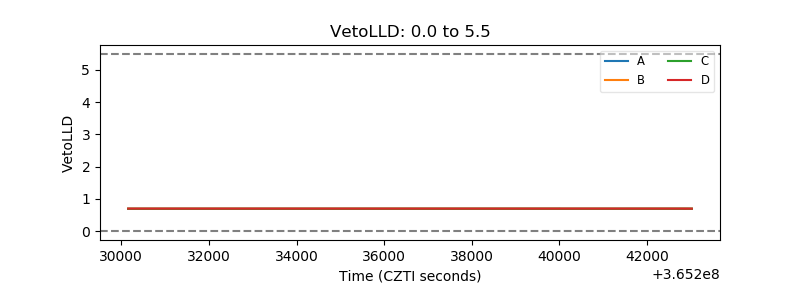 |
| Alpha Counter | 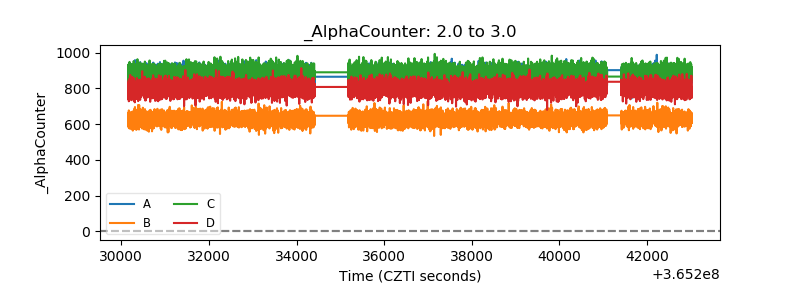 |
| _CPM_Rate | 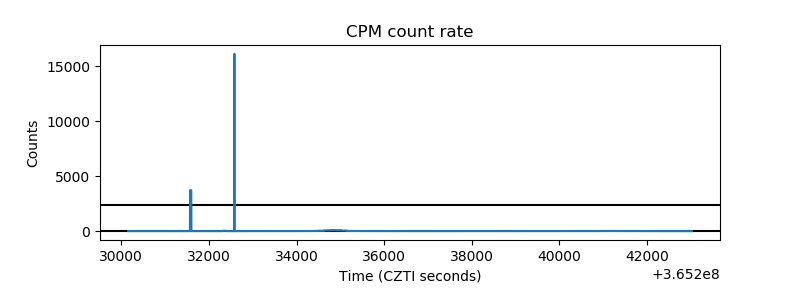 |
| CZT Counter | 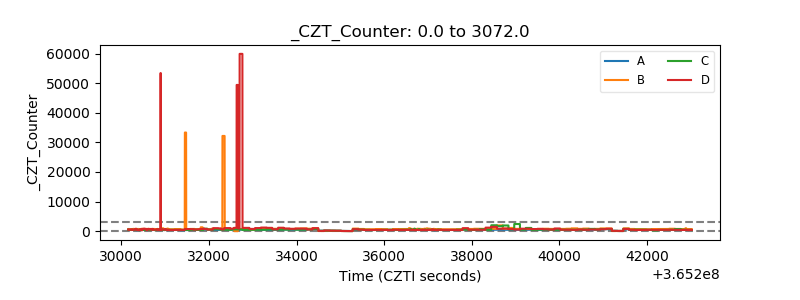 |
| +2.5 Volts monitor |  |
| +5 Volts monitor |  |
| _ROLL_ROT | 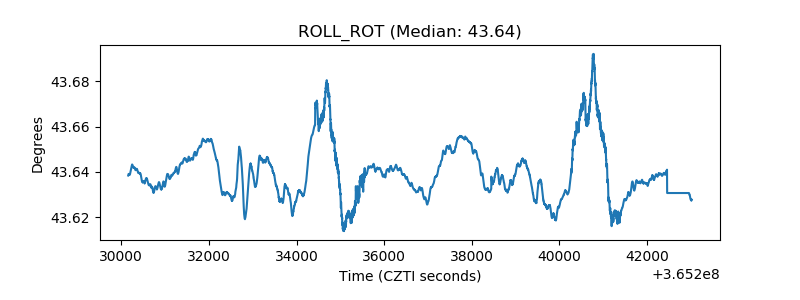 |
| _Roll_DEC | 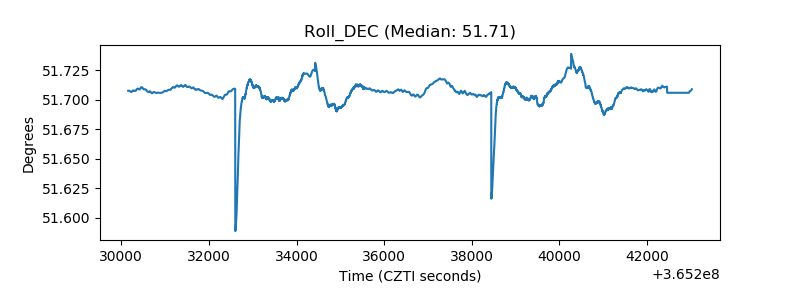 |
| _Roll_RA | 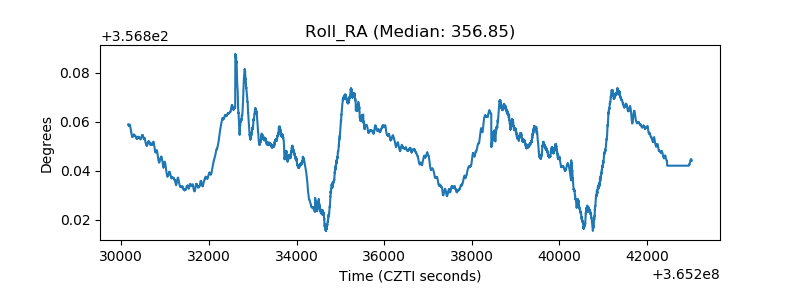 |
| Veto Counter | 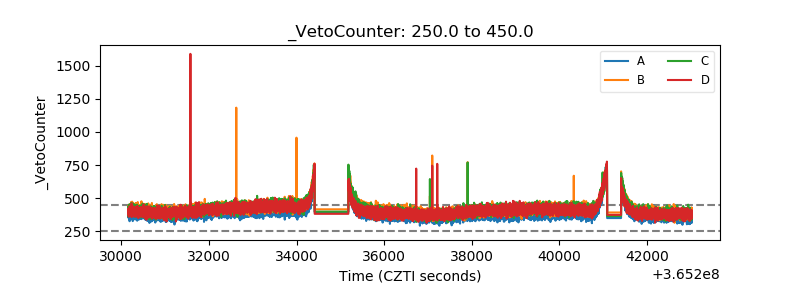 |