| Param | Original file | Final file |
|---|---|---|
| Filename | modeM0/AS1A10_056T01_9000004598_31546cztM0_level2.evt | modeM0/AS1A10_056T01_9000004598_31546cztM0_level2_quad_clean.evt |
| Size (bytes) | 578,989,440 | 97,246,080 |
| Size | 552.2 MB | 92.7 MB |
| Events in quadrant A | 3,476,982 | 617,220 |
| Events in quadrant B | 5,620,954 | 618,273 |
| Events in quadrant C | 3,586,396 | 597,835 |
| Events in quadrant D | 4,338,353 | 585,800 |
| Mode M0 | |||
|---|---|---|---|
| Quadrant | BADHDUFLAG | Total packets | Discarded packets |
| A | 0 | 15437 | 2 |
| B | 0 | 22758 | 1 |
| C | 0 | 15585 | 1 |
| D | 0 | 17950 | 1 |
| Mode M9 | |||
|---|---|---|---|
| Quadrant | BADHDUFLAG | Total packets | Discarded packets |
| A | 0 | 2 | 0 |
| B | 0 | 2 | 0 |
| C | 0 | 2 | 0 |
| D | 0 | 2 | 0 |
| Mode SS | |||
|---|---|---|---|
| Quadrant | BADHDUFLAG | Total packets | Discarded packets |
| A | 0 | 154 | 0 |
| B | 0 | 154 | 0 |
| C | 0 | 154 | 0 |
| D | 0 | 154 | 0 |
| Quadrant | Total seconds | Saturated seconds | Saturation percentage |
|---|---|---|---|
| A | 7556 | 154 | 2.038115% |
| B | 7556 | 231 | 3.057173% |
| C | 7556 | 178 | 2.355744% |
| D | 7557 | 276 | 3.652243% |
Noise dominated data is calculated using 1-second bins in cleaned event files. If a bin has >2000 counts, and if more than 50% of those come from <1% of pixels, then it is considered to be noise-dominated and hence unusable.
| Quadrant | # 1 sec bins | Bins with >0 counts | Bins with >2000 counts | High rate bins dominated by noise | Noise dominated (total time) | Noise dominated (detector-on time) | Marked lightcurve |
|---|---|---|---|---|---|---|---|
| A | 7736 | 7556 | 0 | 0 | 0.00% | 0.00% | 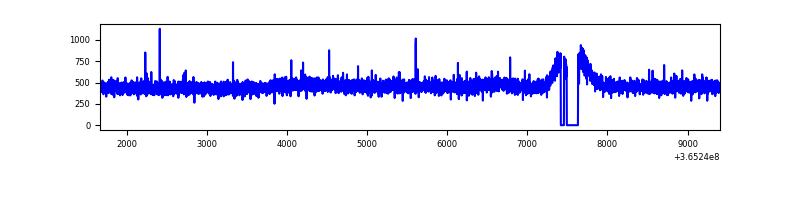 |
| B | 7736 | 7556 | 1 | 1 | 0.01% | 0.01% | 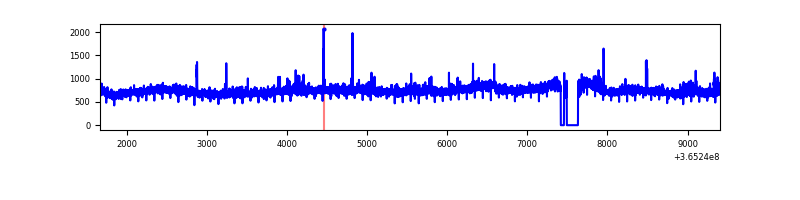 |
| C | 7736 | 7556 | 1 | 1 | 0.01% | 0.01% | 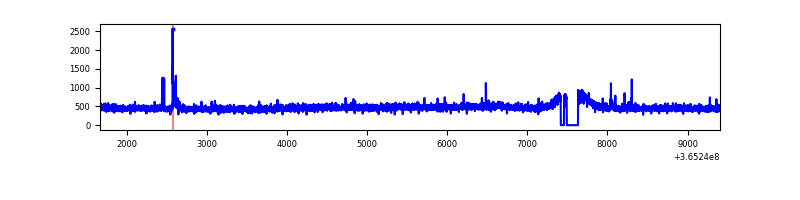 |
| D | 7737 | 7558 | 160 | 160 | 2.07% | 2.12% | 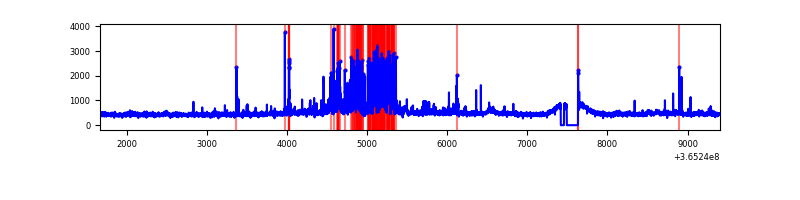 |
Top three noisy pixels from each quadrant. If the there are fewer than three noisy pixels in the level2.evt file, extra rows are filled as -1
| Pixel properties | Quadrant properties | ||||||
|---|---|---|---|---|---|---|---|
| Quadrant | DetID | PixID | Counts | Sigma | Mean | Median | Sigma |
| A | 13 | 254 | 13594 | 70.25 | 900 | 879 | 181.0 |
| A | 3 | 137 | 9484 | 47.54 | 900 | 879 | 181.0 |
| A | 0 | 226 | 7606 | 37.17 | 900 | 879 | 181.0 |
| B | 6 | 159 | 1994786 | 11678.4 | 885 | 860 | 170.7 |
| B | 4 | 80 | 78949 | 457.37 | 885 | 860 | 170.7 |
| B | 0 | 190 | 33888 | 193.44 | 885 | 860 | 170.7 |
| C | 14 | 238 | 138367 | 686.44 | 856 | 859 | 200.3 |
| C | 10 | 22 | 51342 | 252.01 | 856 | 859 | 200.3 |
| C | 3 | 233 | 18484 | 87.98 | 856 | 859 | 200.3 |
| D | 12 | 218 | 634773 | 3100.17 | 861 | 833 | 204.5 |
| D | 8 | 195 | 342757 | 1672.12 | 861 | 833 | 204.5 |
| D | 2 | 250 | 61509 | 296.73 | 861 | 833 | 204.5 |
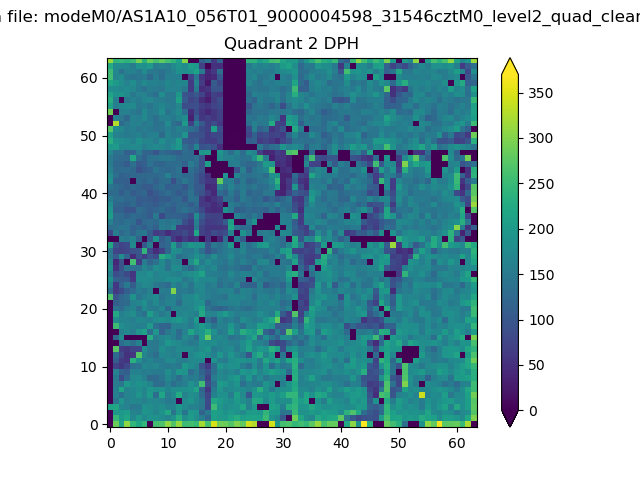
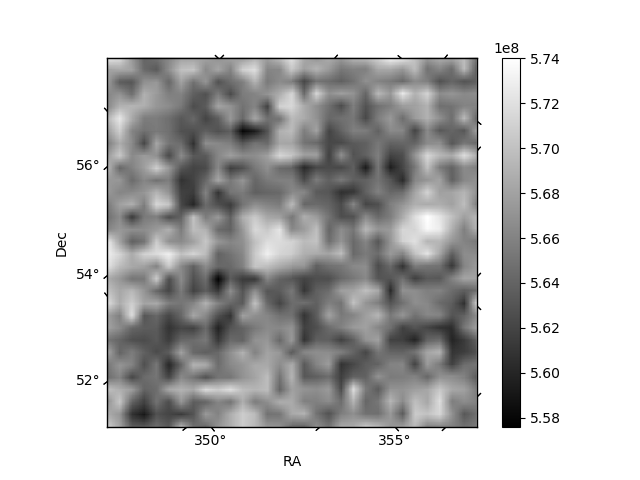
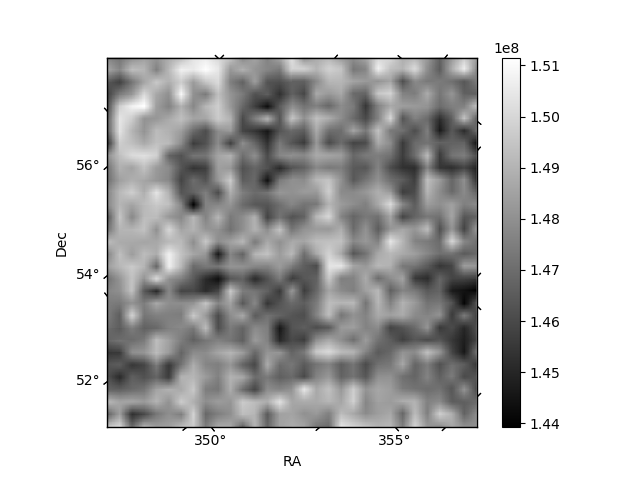
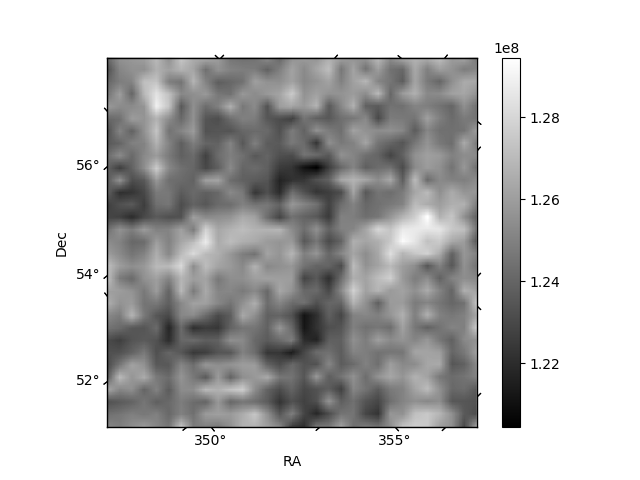
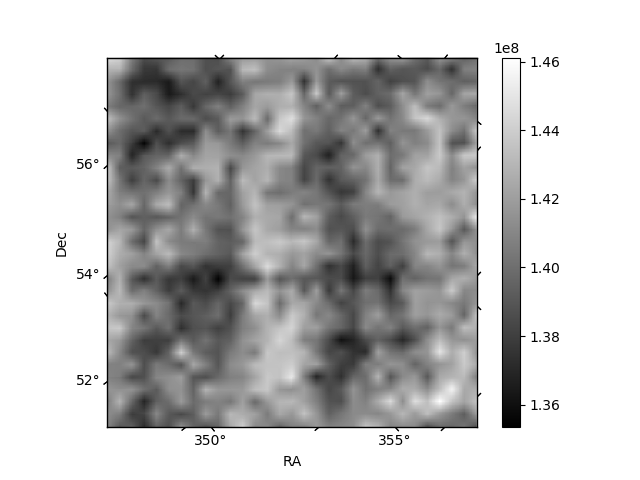
Histogram calculated using DETX and DETY for each event in the final _common_clean file
| Quadrant A | 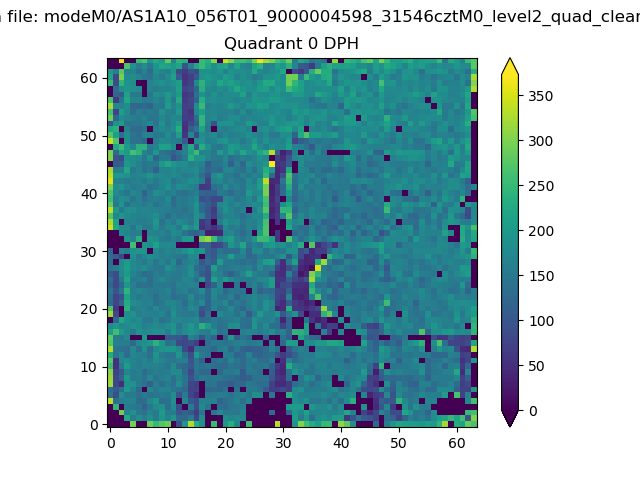 |
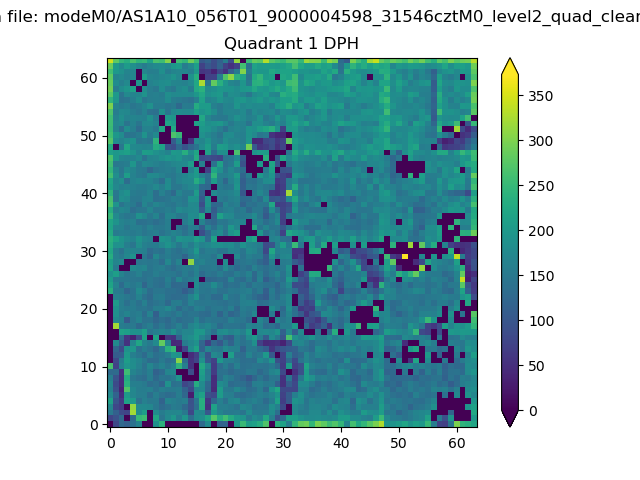 |
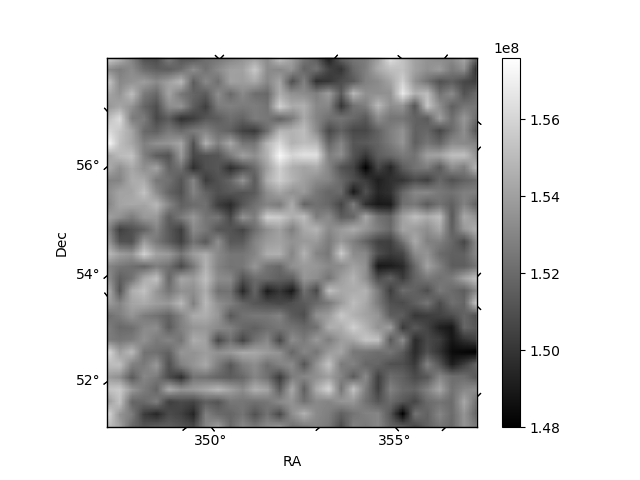
Quadrant B |
|---|---|---|---|
| Quadrant D | 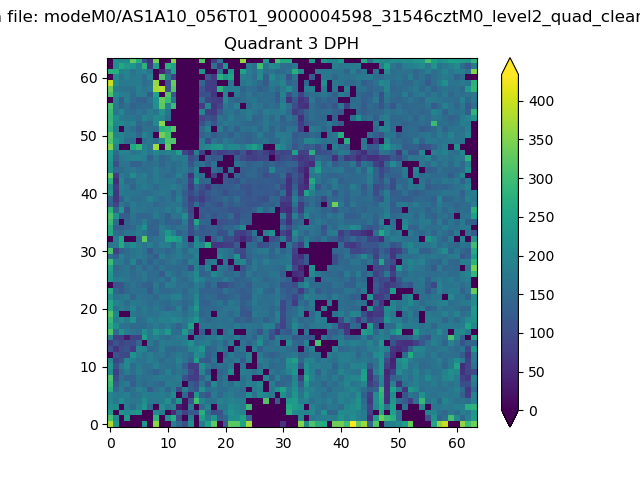 |
 |
Quadrant C |
| Plot type | Count rate plots | Images |
|---|---|---|
| Comparison with Poisson distribution Blue bars denote a histogram of data divided into 1 sec bins. Red curve is a Poisson curve with rate = median count rate of data. |
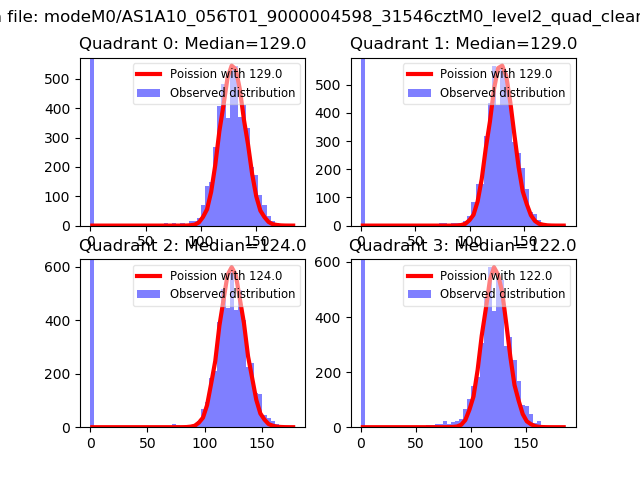 |
 |
| Quadrant-wise count rates Data is divided into 100 sec bins |
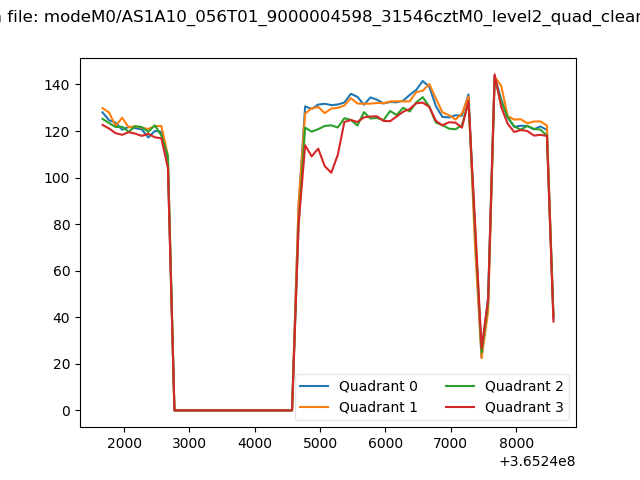 |
|
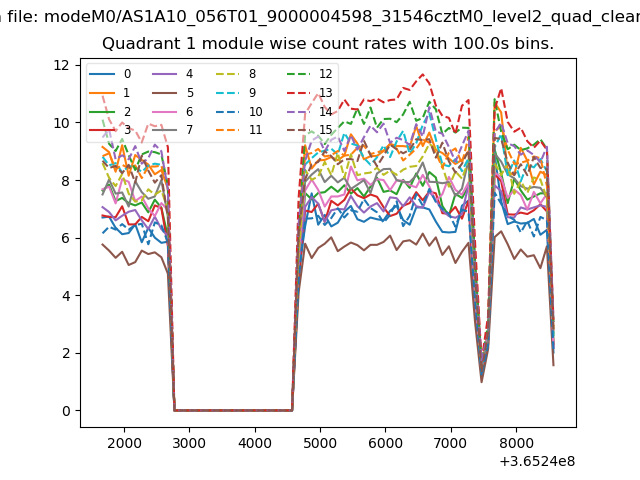
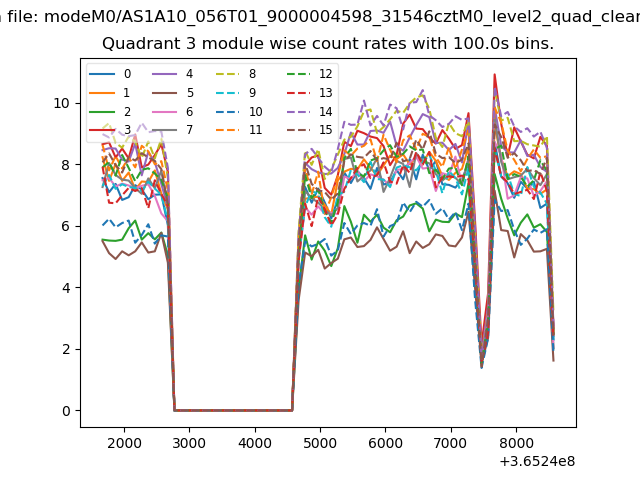
| Module-wise count rates for Quadrant A Data is divided into 100 sec bins |
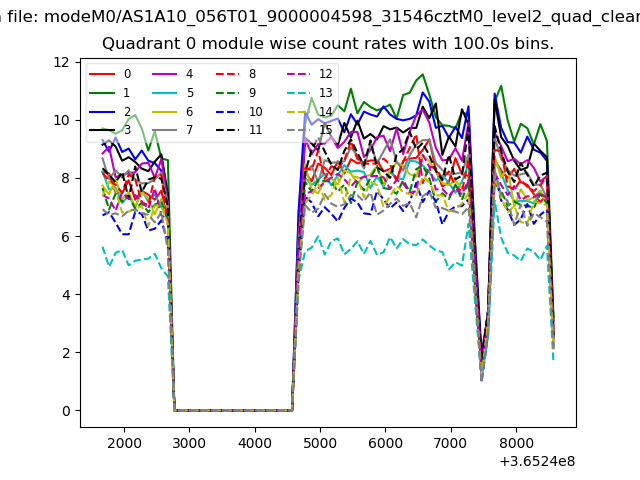 |
 |
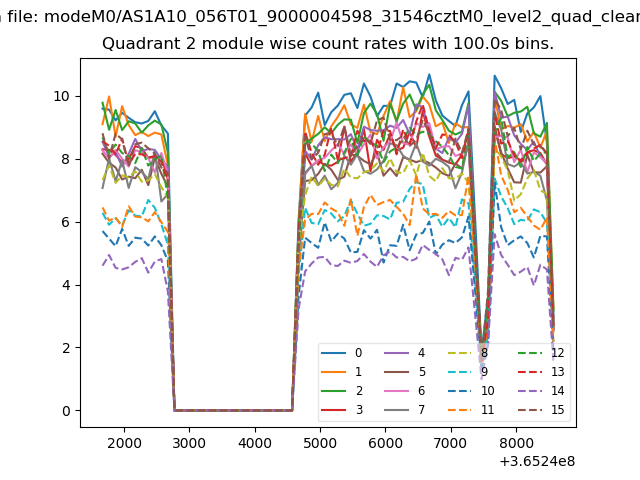
| Module-wise count rates for Quadrant B Data is divided into 100 sec bins |
 |
 |
| Module-wise count rates for Quadrant C Data is divided into 100 sec bins |
 |
 |
| Module-wise count rates for Quadrant D Data is divided into 100 sec bins |
 |
 |
| Parameter | Plot |
|---|---|
| CZT HV Monitor | 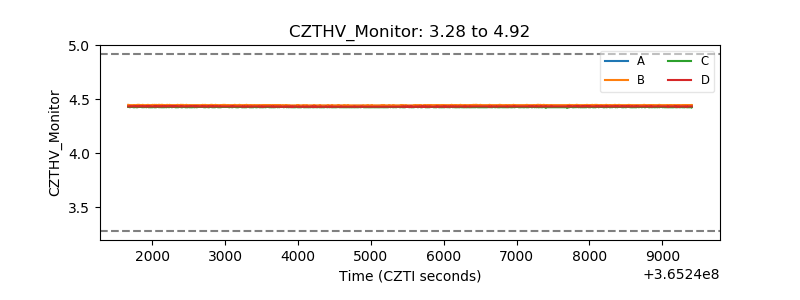 |
| D_VDD | 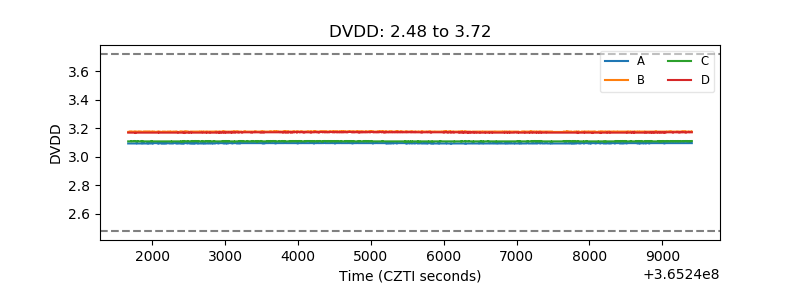 |
| Temperature 1 | 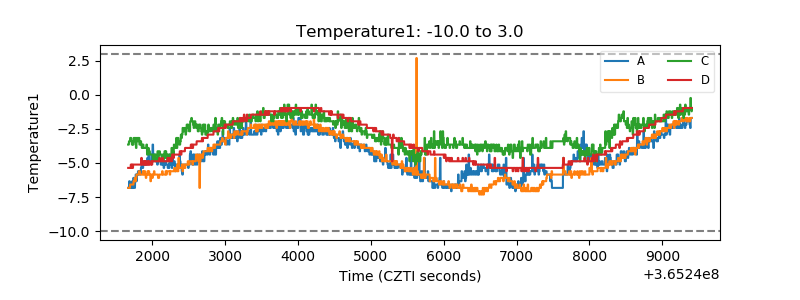 |
| Veto HV Monitor | 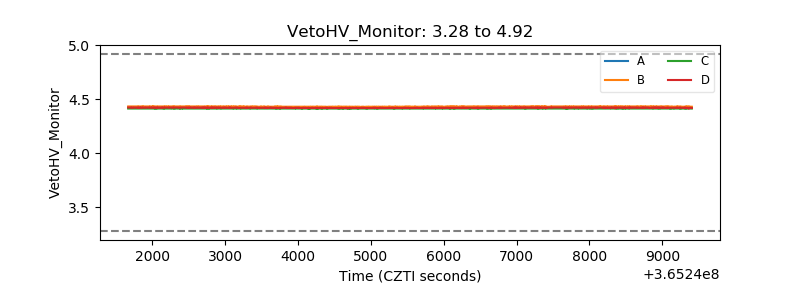 |
| Veto LLD | 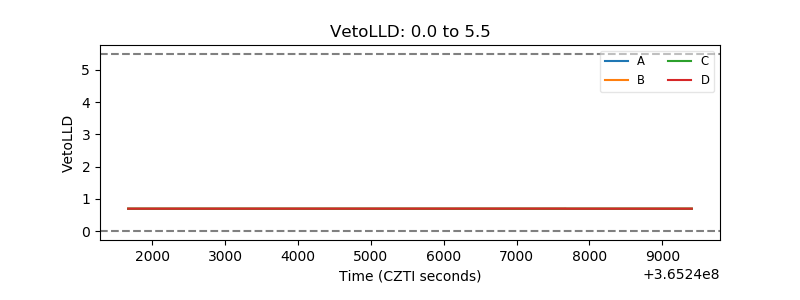 |
| Alpha Counter | 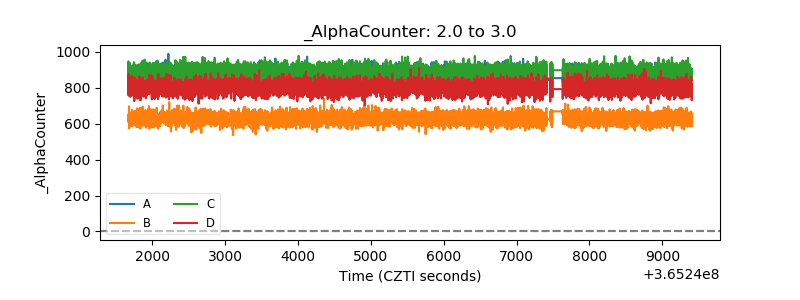 |
| _CPM_Rate | 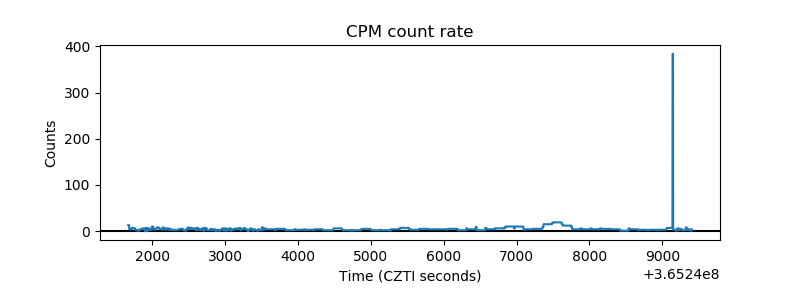 |
| CZT Counter | 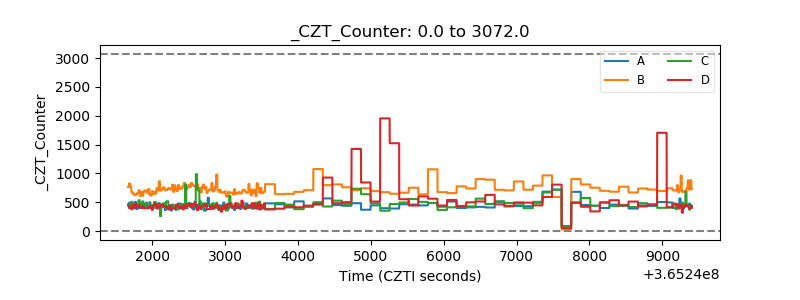 |
| +2.5 Volts monitor |  |
| +5 Volts monitor | 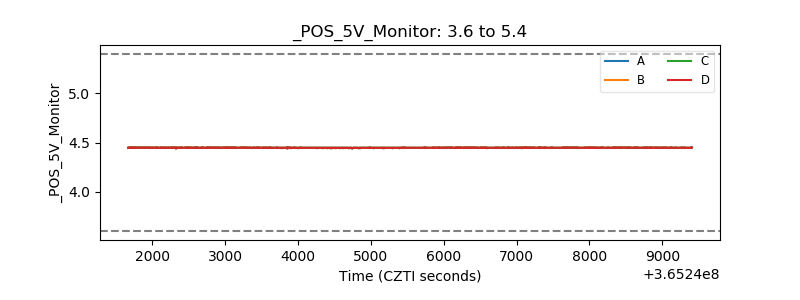 |
| _ROLL_ROT |  |
| _Roll_DEC | 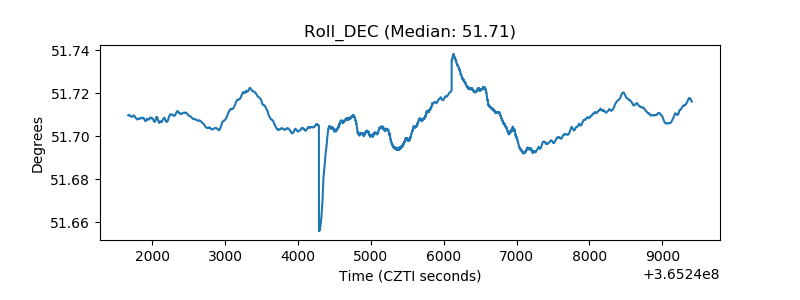 |
| _Roll_RA | 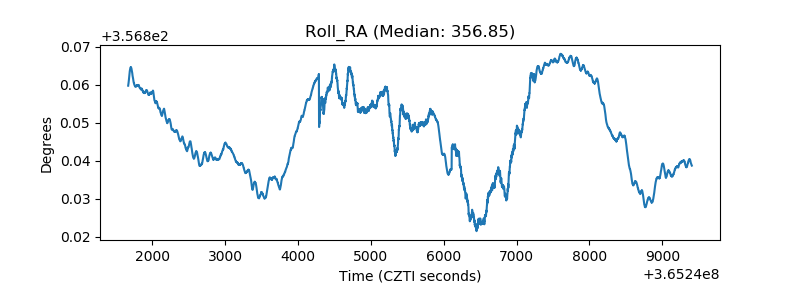 |
| Veto Counter | 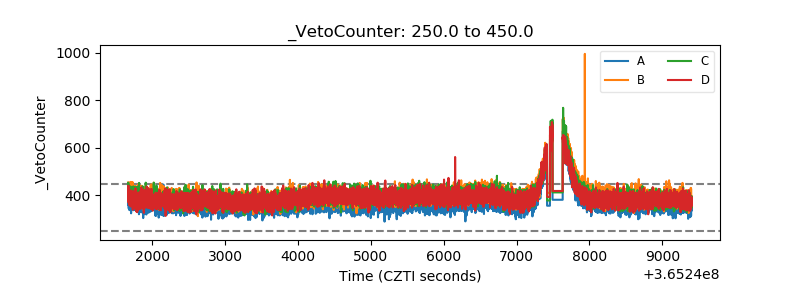 |