| Param | Original file | Final file |
|---|---|---|
| Filename | modeM0/AS1A10_056T01_9000004598_31549cztM0_level2.evt | modeM0/AS1A10_056T01_9000004598_31549cztM0_level2_quad_clean.evt |
| Size (bytes) | 887,811,840 | 150,266,880 |
| Size | 846.7 MB | 143.3 MB |
| Events in quadrant A | 5,287,881 | 966,939 |
| Events in quadrant B | 8,789,539 | 958,441 |
| Events in quadrant C | 5,736,946 | 919,105 |
| Events in quadrant D | 6,297,762 | 912,896 |
| Mode M0 | |||
|---|---|---|---|
| Quadrant | BADHDUFLAG | Total packets | Discarded packets |
| A | 0 | 23361 | 2 |
| B | 0 | 34910 | 2 |
| C | 0 | 24460 | 2 |
| D | 0 | 26140 | 2 |
| Mode M9 | |||
|---|---|---|---|
| Quadrant | BADHDUFLAG | Total packets | Discarded packets |
| A | 0 | 10 | 0 |
| B | 0 | 10 | 0 |
| C | 0 | 10 | 0 |
| D | 0 | 10 | 0 |
| Mode SS | |||
|---|---|---|---|
| Quadrant | BADHDUFLAG | Total packets | Discarded packets |
| A | 0 | 234 | 0 |
| B | 0 | 234 | 0 |
| C | 0 | 234 | 0 |
| D | 0 | 234 | 0 |
| Quadrant | Total seconds | Saturated seconds | Saturation percentage |
|---|---|---|---|
| A | 11464 | 208 | 1.814375% |
| B | 11465 | 318 | 2.773659% |
| C | 11465 | 320 | 2.791103% |
| D | 11465 | 333 | 2.904492% |
Noise dominated data is calculated using 1-second bins in cleaned event files. If a bin has >2000 counts, and if more than 50% of those come from <1% of pixels, then it is considered to be noise-dominated and hence unusable.
| Quadrant | # 1 sec bins | Bins with >0 counts | Bins with >2000 counts | High rate bins dominated by noise | Noise dominated (total time) | Noise dominated (detector-on time) | Marked lightcurve |
|---|---|---|---|---|---|---|---|
| A | 11973 | 11463 | 0 | 0 | 0.00% | 0.00% | 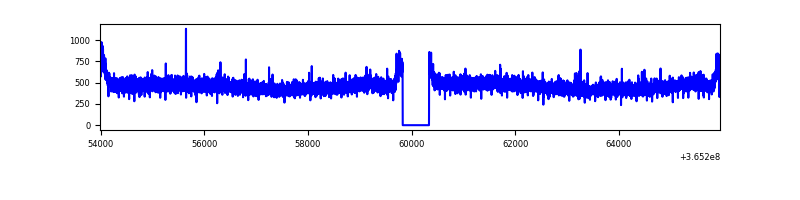 |
| B | 11974 | 11464 | 9 | 9 | 0.08% | 0.08% | 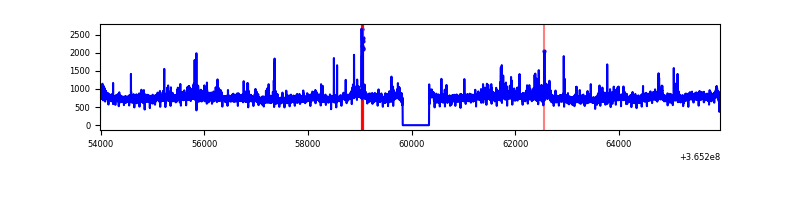 |
| C | 11974 | 11464 | 54 | 54 | 0.45% | 0.47% | 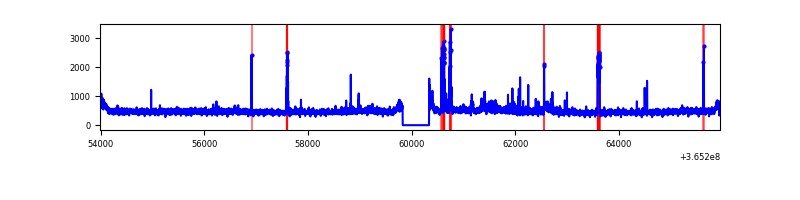 |
| D | 11974 | 11464 | 163 | 163 | 1.36% | 1.42% | 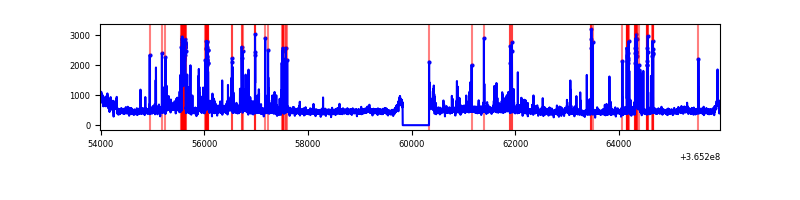 |
Top three noisy pixels from each quadrant. If the there are fewer than three noisy pixels in the level2.evt file, extra rows are filled as -1
| Pixel properties | Quadrant properties | ||||||
|---|---|---|---|---|---|---|---|
| Quadrant | DetID | PixID | Counts | Sigma | Mean | Median | Sigma |
| A | 13 | 254 | 19479 | 66.09 | 1368 | 1339 | 274.5 |
| A | 3 | 137 | 14503 | 47.96 | 1368 | 1339 | 274.5 |
| A | 0 | 226 | 11368 | 36.54 | 1368 | 1339 | 274.5 |
| B | 6 | 159 | 3104956 | 12023.05 | 1349 | 1315 | 258.1 |
| B | 4 | 80 | 214479 | 825.77 | 1349 | 1315 | 258.1 |
| B | 0 | 190 | 54882 | 207.51 | 1349 | 1315 | 258.1 |
| C | 10 | 22 | 229808 | 750.42 | 1301 | 1305 | 304.5 |
| C | 14 | 238 | 209667 | 684.27 | 1301 | 1305 | 304.5 |
| C | 2 | 16 | 88496 | 286.34 | 1301 | 1305 | 304.5 |
| D | 8 | 195 | 488340 | 1566.83 | 1310 | 1271 | 310.9 |
| D | 2 | 250 | 372324 | 1193.63 | 1310 | 1271 | 310.9 |
| D | 7 | 223 | 217608 | 695.93 | 1310 | 1271 | 310.9 |
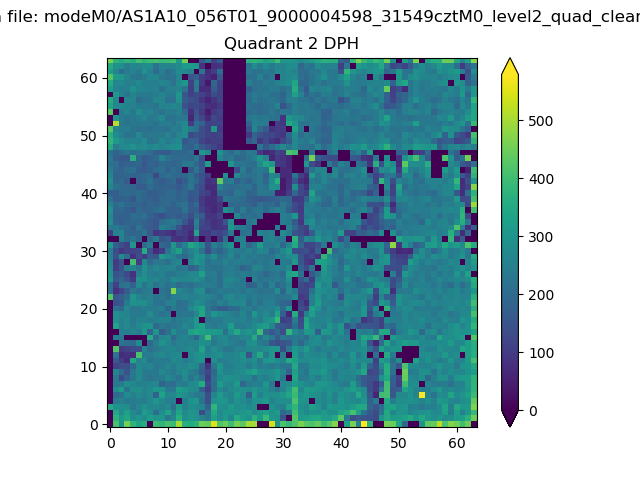
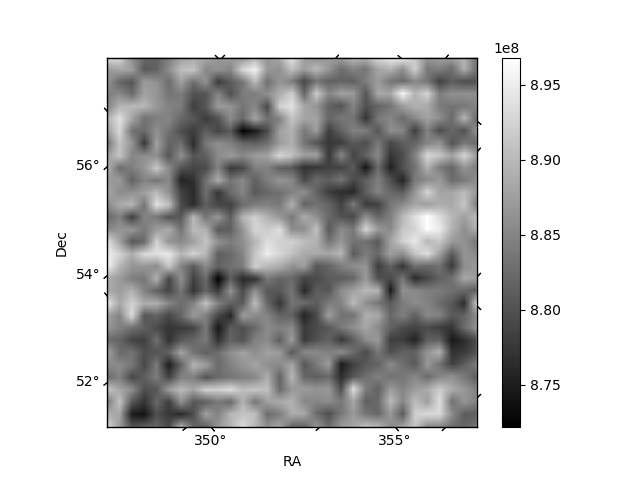
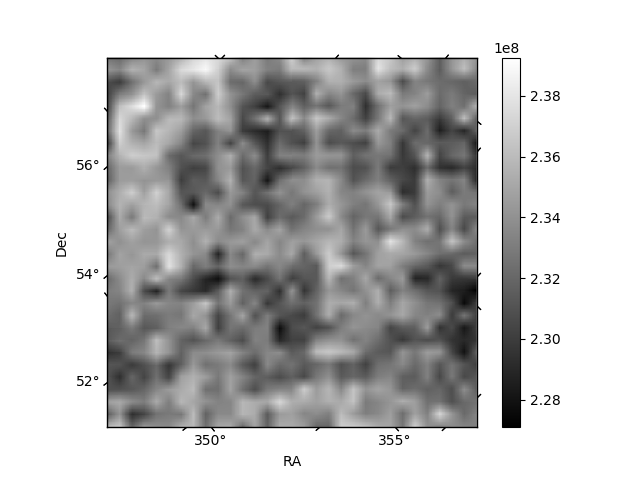
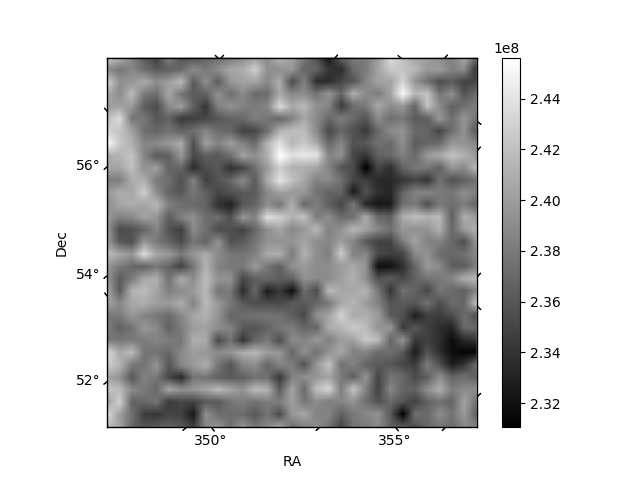
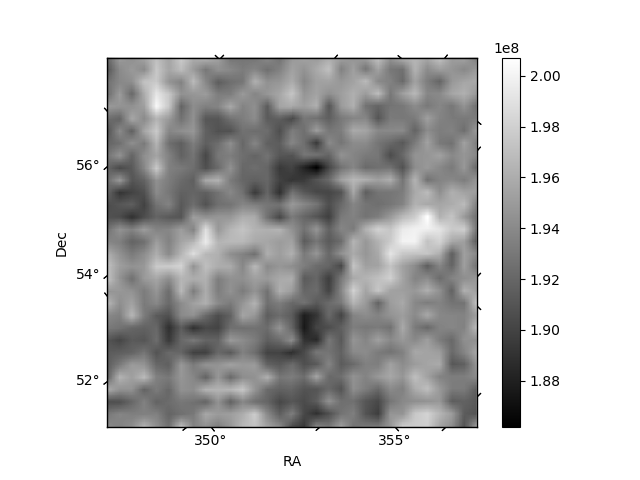
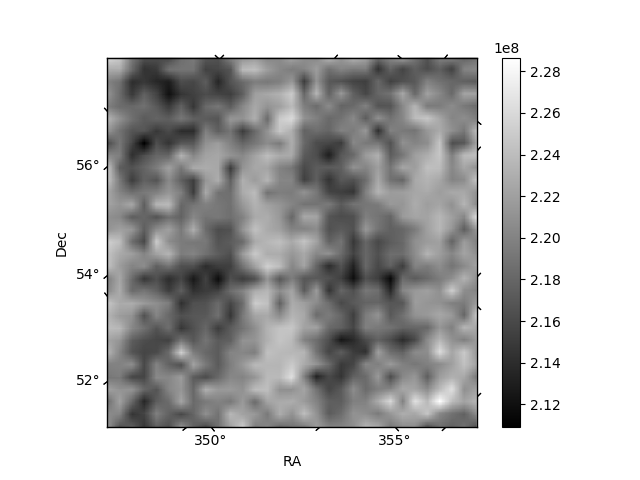
Histogram calculated using DETX and DETY for each event in the final _common_clean file
| Quadrant A | 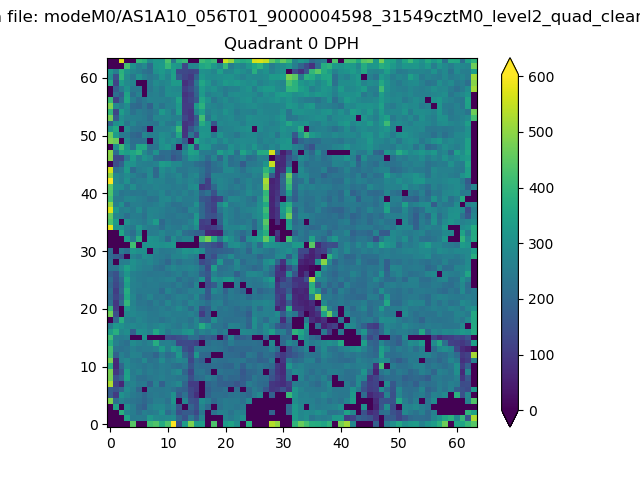 |
 |
Quadrant B |
|---|---|---|---|
| Quadrant D | 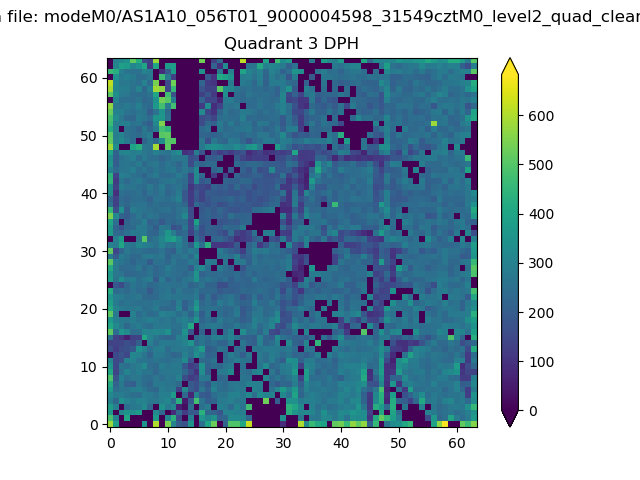 |
 |
Quadrant C |
| Plot type | Count rate plots | Images |
|---|---|---|
| Comparison with Poisson distribution Blue bars denote a histogram of data divided into 1 sec bins. Red curve is a Poisson curve with rate = median count rate of data. |
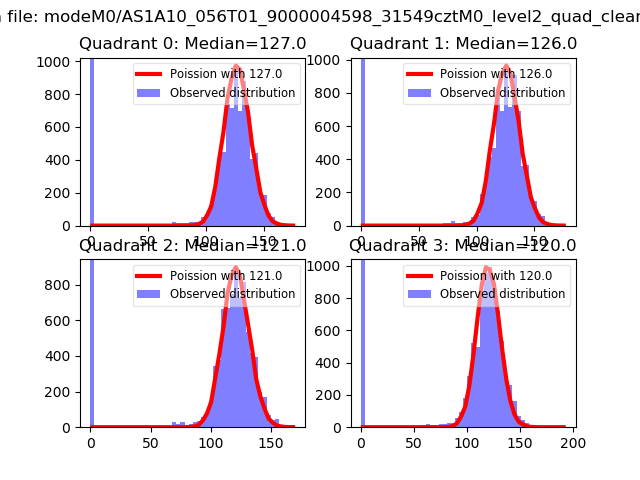 |
 |
| Quadrant-wise count rates Data is divided into 100 sec bins |
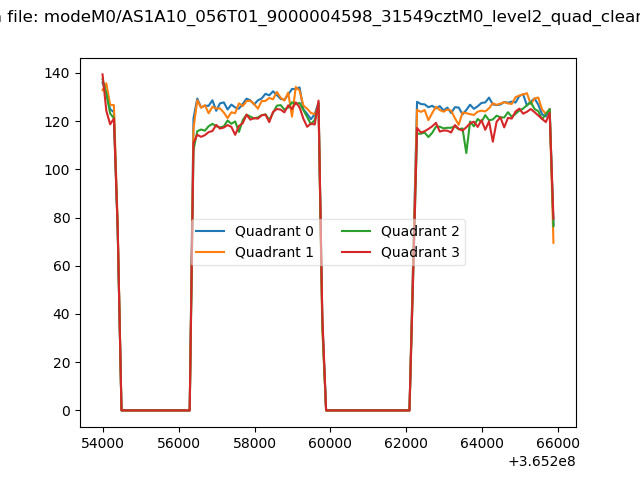 |
|
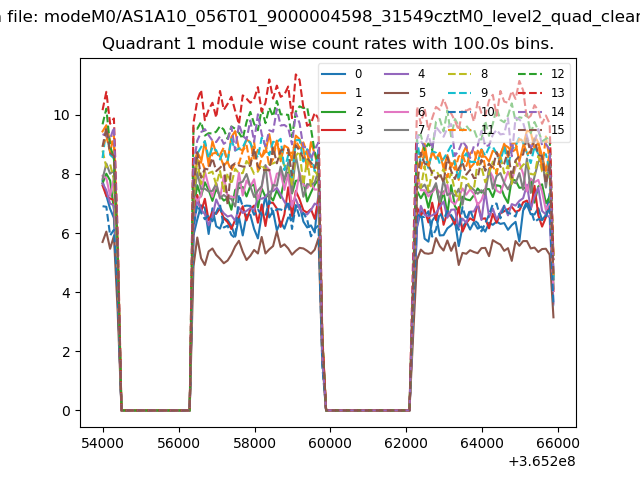
| Module-wise count rates for Quadrant A Data is divided into 100 sec bins |
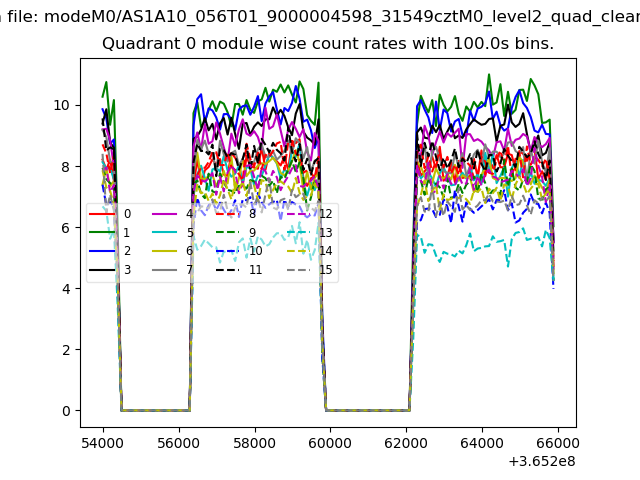 |
 |
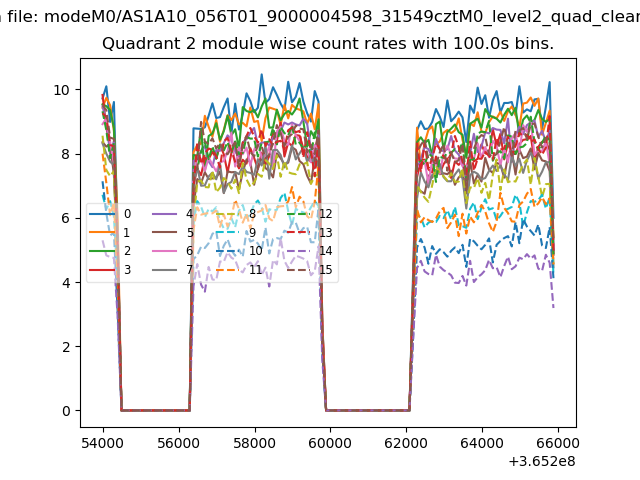
| Module-wise count rates for Quadrant B Data is divided into 100 sec bins |
 |
 |
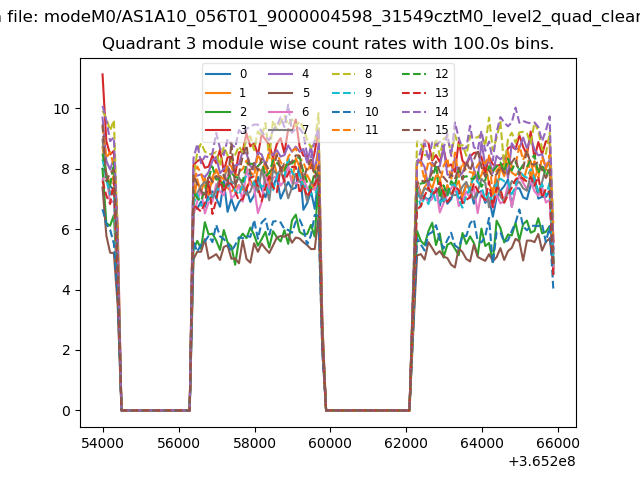
| Module-wise count rates for Quadrant C Data is divided into 100 sec bins |
 |
 |
| Module-wise count rates for Quadrant D Data is divided into 100 sec bins |
 |
 |
| Parameter | Plot |
|---|---|
| CZT HV Monitor | 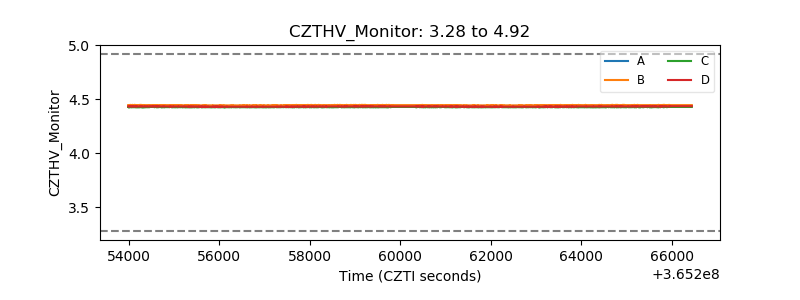 |
| D_VDD | 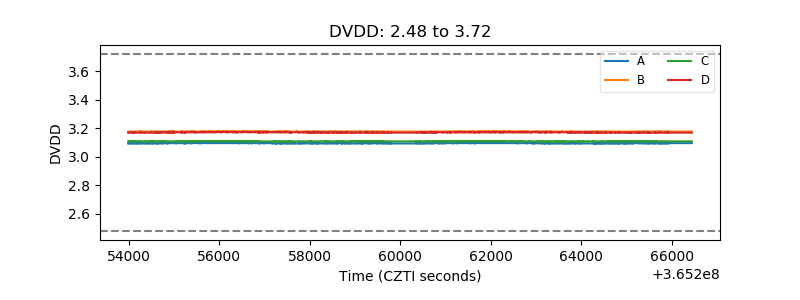 |
| Temperature 1 |  |
| Veto HV Monitor | 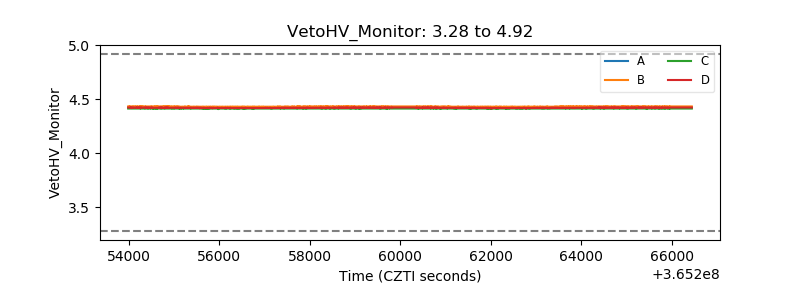 |
| Veto LLD | 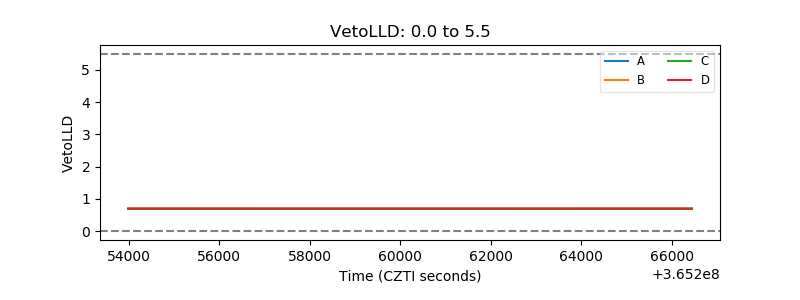 |
| Alpha Counter | 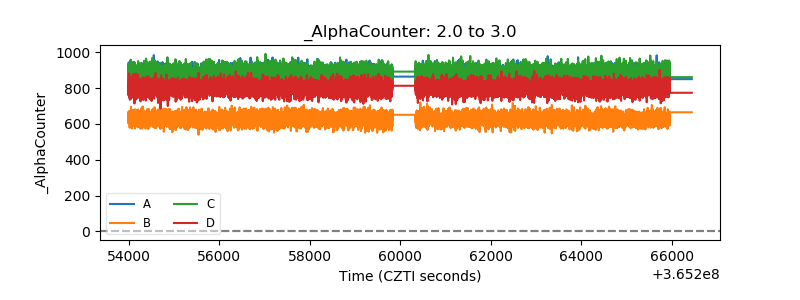 |
| _CPM_Rate | 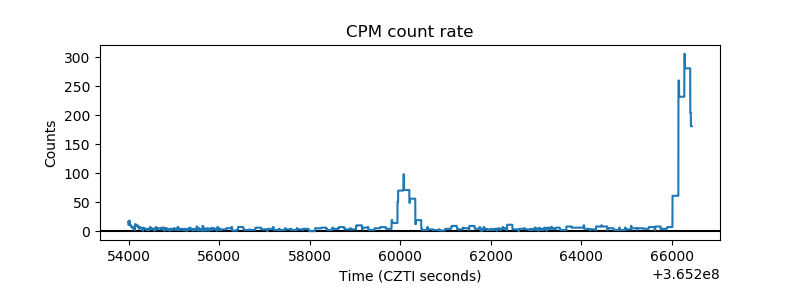 |
| CZT Counter | 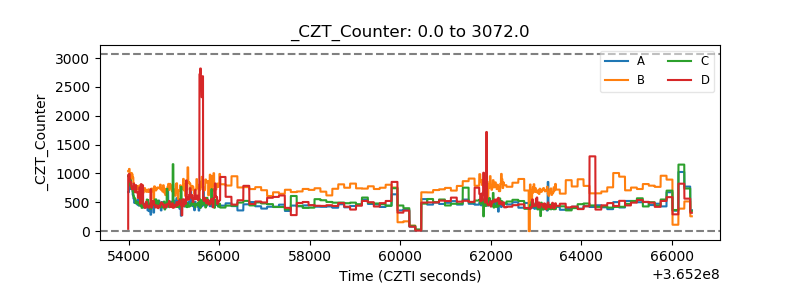 |
| +2.5 Volts monitor |  |
| +5 Volts monitor |  |
| _ROLL_ROT | 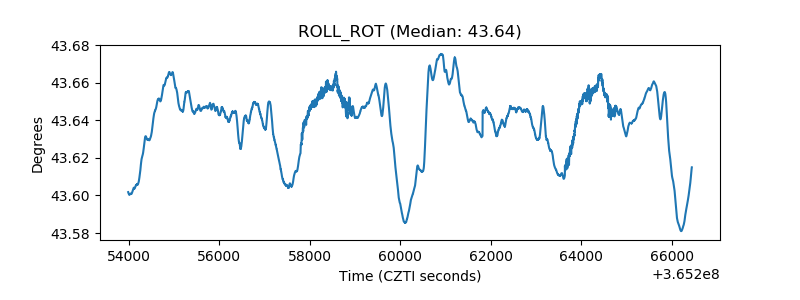 |
| _Roll_DEC | 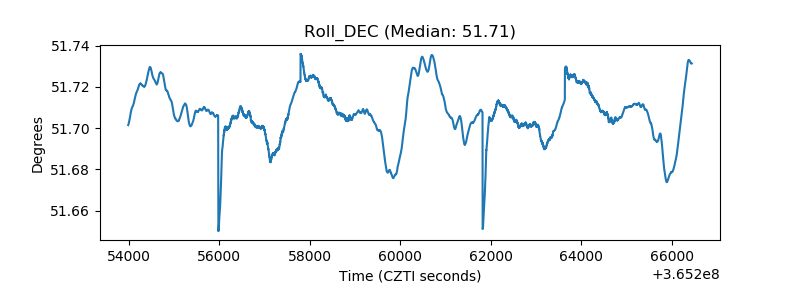 |
| _Roll_RA | 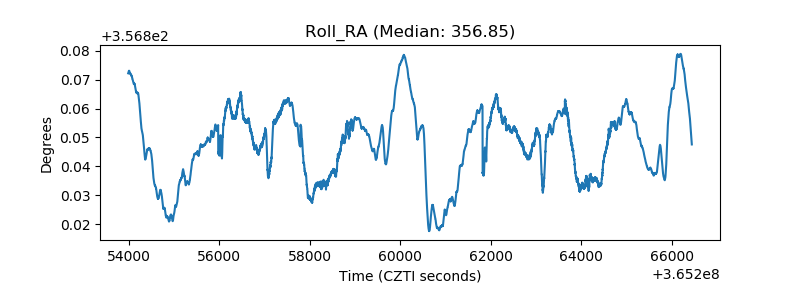 |
| Veto Counter |  |