| Param | Original file | Final file |
|---|---|---|
| Filename | modeM0/AS1A10_056T01_9000004598_31550cztM0_level2.evt | modeM0/AS1A10_056T01_9000004598_31550cztM0_level2_quad_clean.evt |
| Size (bytes) | 605,859,840 | 94,115,520 |
| Size | 577.8 MB | 89.8 MB |
| Events in quadrant A | 3,472,600 | 601,900 |
| Events in quadrant B | 5,790,021 | 599,887 |
| Events in quadrant C | 3,580,778 | 573,973 |
| Events in quadrant D | 5,014,065 | 569,374 |
| Mode M0 | |||
|---|---|---|---|
| Quadrant | BADHDUFLAG | Total packets | Discarded packets |
| A | 0 | 15032 | 2 |
| B | 0 | 22366 | 2 |
| C | 0 | 15235 | 2 |
| D | 0 | 19801 | 2 |
| Mode M9 | |||
|---|---|---|---|
| Quadrant | BADHDUFLAG | Total packets | Discarded packets |
| A | 0 | 15 | 0 |
| B | 0 | 15 | 0 |
| C | 0 | 15 | 0 |
| D | 0 | 15 | 0 |
| Mode SS | |||
|---|---|---|---|
| Quadrant | BADHDUFLAG | Total packets | Discarded packets |
| A | 0 | 150 | 0 |
| B | 0 | 150 | 0 |
| C | 0 | 150 | 0 |
| D | 0 | 150 | 0 |
| Quadrant | Total seconds | Saturated seconds | Saturation percentage |
|---|---|---|---|
| A | 7250 | 119 | 1.641379% |
| B | 7251 | 190 | 2.620328% |
| C | 7251 | 180 | 2.482416% |
| D | 7251 | 161 | 2.220383% |
Noise dominated data is calculated using 1-second bins in cleaned event files. If a bin has >2000 counts, and if more than 50% of those come from <1% of pixels, then it is considered to be noise-dominated and hence unusable.
| Quadrant | # 1 sec bins | Bins with >0 counts | Bins with >2000 counts | High rate bins dominated by noise | Noise dominated (total time) | Noise dominated (detector-on time) | Marked lightcurve |
|---|---|---|---|---|---|---|---|
| A | 8830 | 7250 | 0 | 0 | 0.00% | 0.00% | 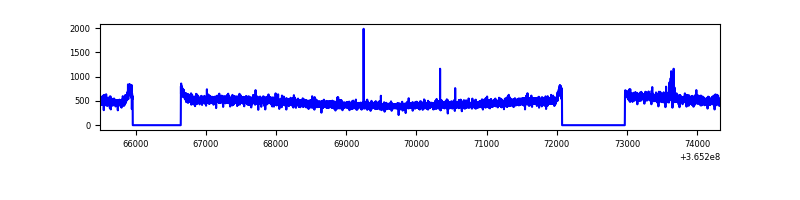 |
| B | 8831 | 7251 | 8 | 8 | 0.09% | 0.11% | 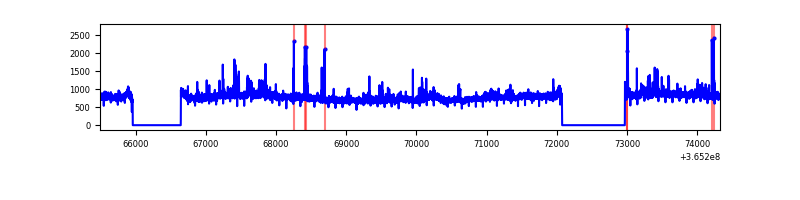 |
| C | 8831 | 7251 | 3 | 3 | 0.03% | 0.04% | 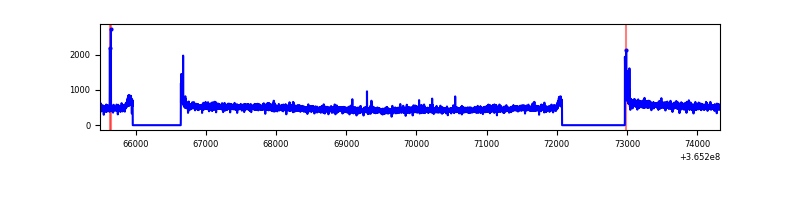 |
| D | 8831 | 7251 | 47 | 47 | 0.53% | 0.65% | 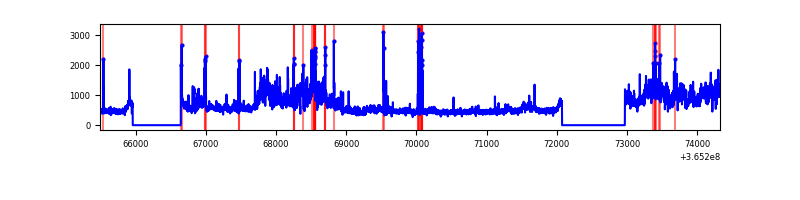 |
Top three noisy pixels from each quadrant. If the there are fewer than three noisy pixels in the level2.evt file, extra rows are filled as -1
| Pixel properties | Quadrant properties | ||||||
|---|---|---|---|---|---|---|---|
| Quadrant | DetID | PixID | Counts | Sigma | Mean | Median | Sigma |
| A | 13 | 254 | 12399 | 63.89 | 897 | 880 | 180.3 |
| A | 3 | 137 | 9234 | 46.33 | 897 | 880 | 180.3 |
| A | 0 | 13 | 7834 | 38.57 | 897 | 880 | 180.3 |
| B | 6 | 159 | 2029152 | 11903.12 | 884 | 862 | 170.4 |
| B | 4 | 80 | 121081 | 705.51 | 884 | 862 | 170.4 |
| B | 0 | 155 | 50564 | 291.68 | 884 | 862 | 170.4 |
| C | 14 | 238 | 137880 | 681.4 | 854 | 856 | 201.1 |
| C | 0 | 10 | 36021 | 174.87 | 854 | 856 | 201.1 |
| C | 4 | 175 | 29964 | 144.75 | 854 | 856 | 201.1 |
| D | 8 | 195 | 1357472 | 6477.29 | 868 | 843 | 209.4 |
| D | 2 | 250 | 107530 | 509.38 | 868 | 843 | 209.4 |
| D | 7 | 223 | 89870 | 425.06 | 868 | 843 | 209.4 |
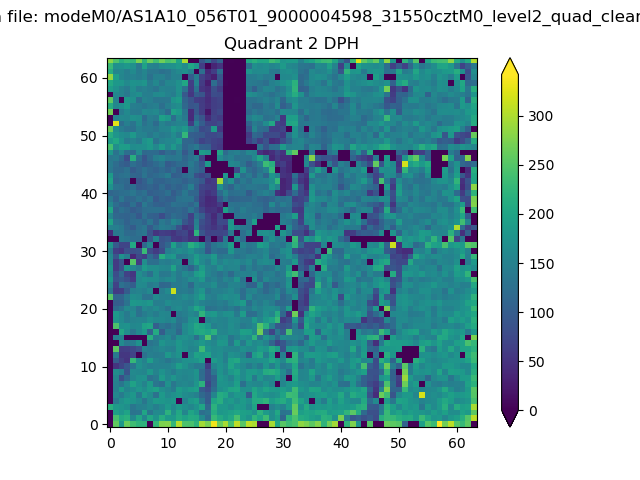
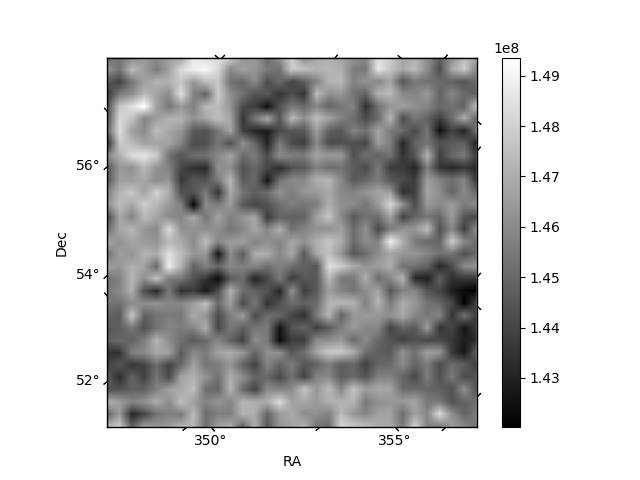
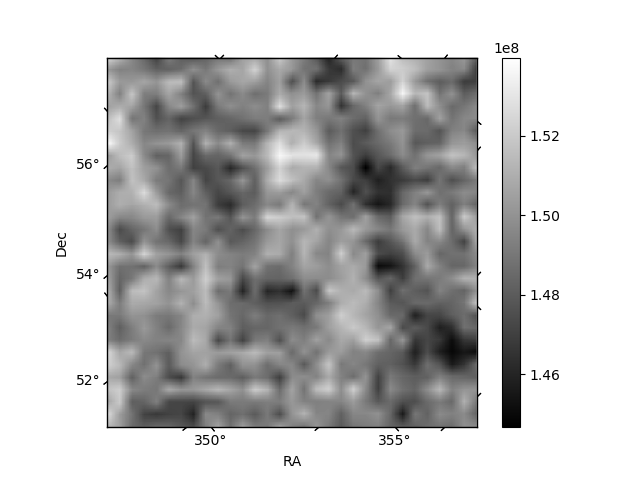
Histogram calculated using DETX and DETY for each event in the final _common_clean file
| Quadrant A | 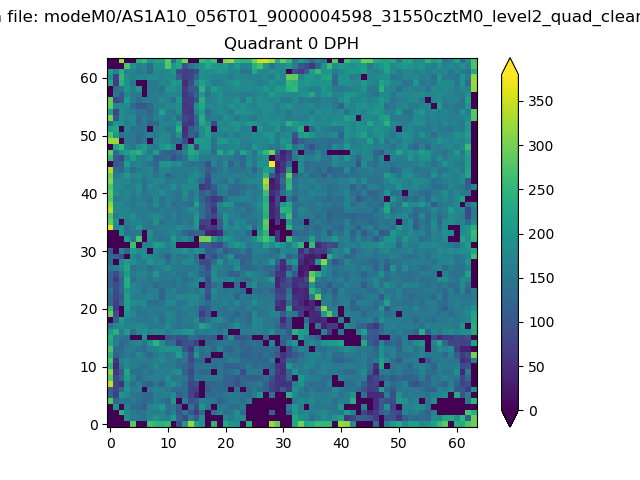 |
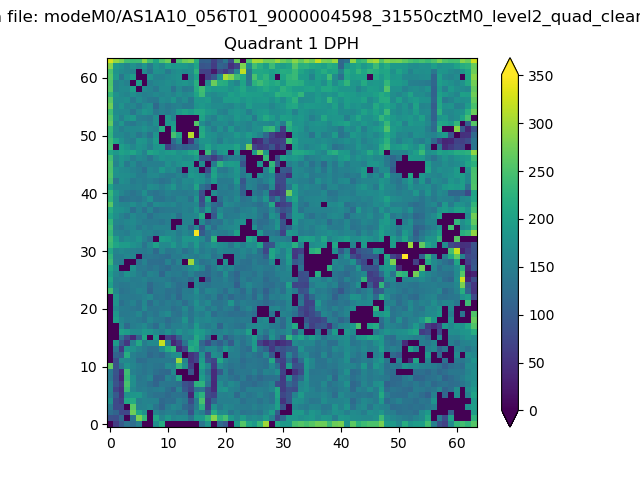 |
Quadrant B |
|---|---|---|---|
| Quadrant D | 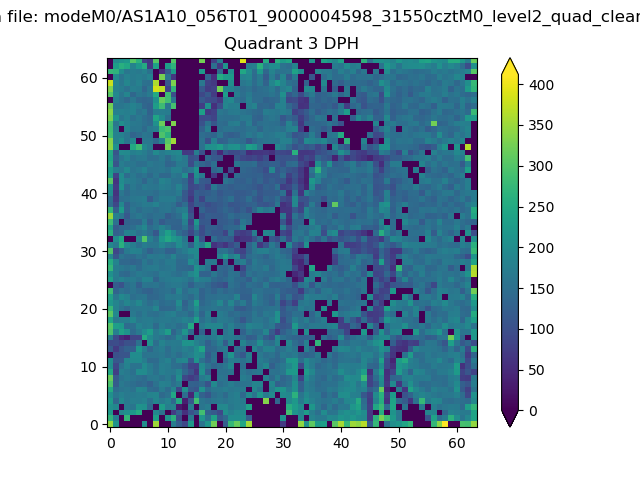 |
 |
Quadrant C |
| Plot type | Count rate plots | Images |
|---|---|---|
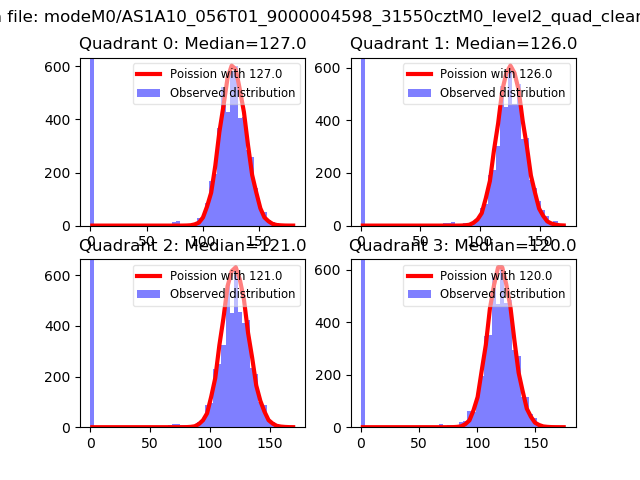
| Comparison with Poisson distribution Blue bars denote a histogram of data divided into 1 sec bins. Red curve is a Poisson curve with rate = median count rate of data. |
 |
 |
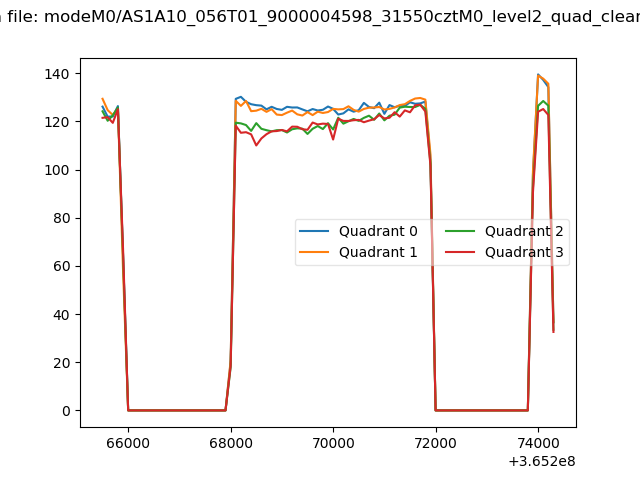
| Quadrant-wise count rates Data is divided into 100 sec bins |
 |
|
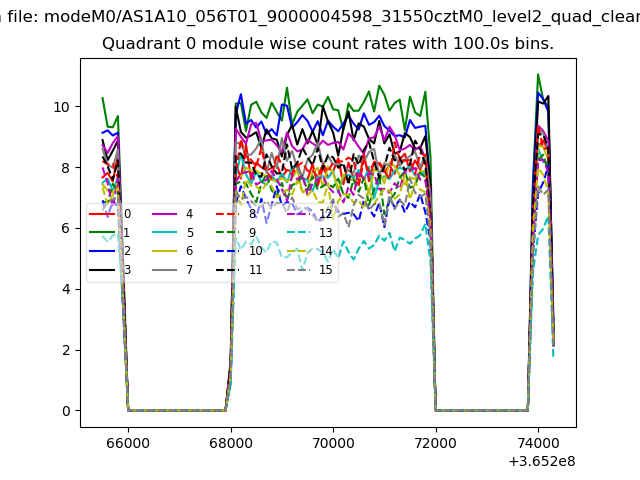
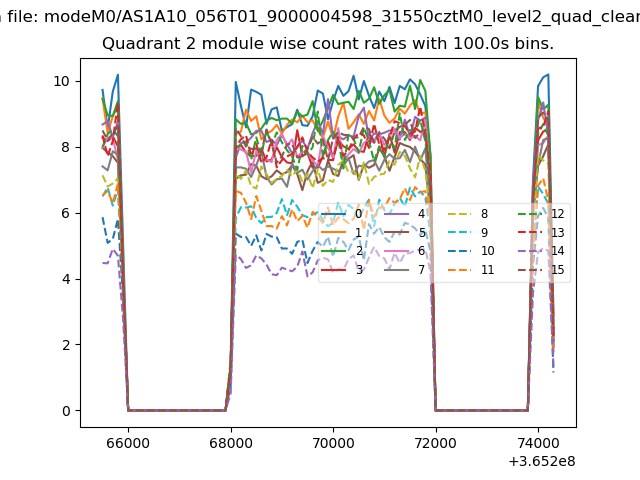
| Module-wise count rates for Quadrant A Data is divided into 100 sec bins |
 |
 |
| Module-wise count rates for Quadrant B Data is divided into 100 sec bins |
 |
 |
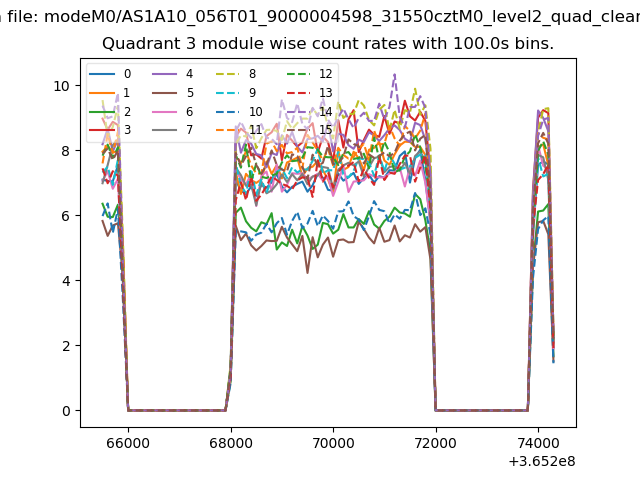
| Module-wise count rates for Quadrant C Data is divided into 100 sec bins |
 |
 |
| Module-wise count rates for Quadrant D Data is divided into 100 sec bins |
 |
 |
| Parameter | Plot |
|---|---|
| CZT HV Monitor |  |
| D_VDD | 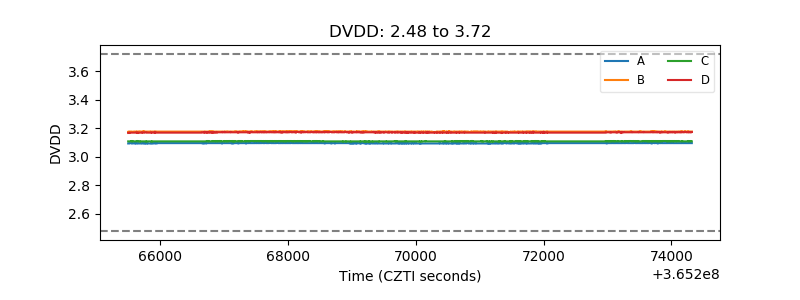 |
| Temperature 1 | 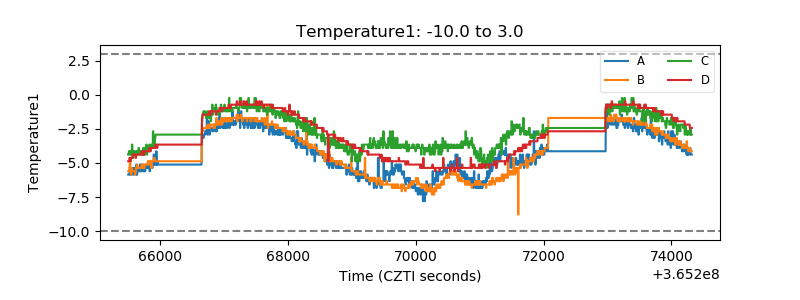 |
| Veto HV Monitor | 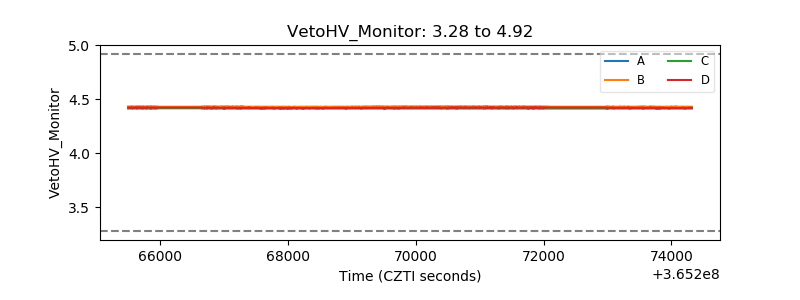 |
| Veto LLD | 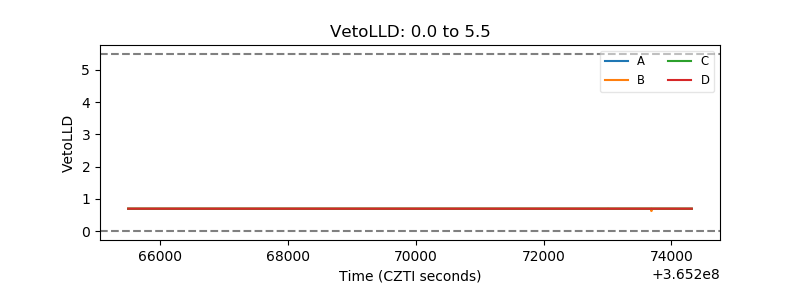 |
| Alpha Counter | 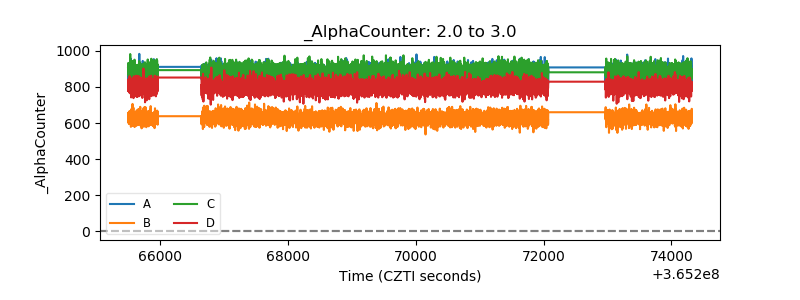 |
| _CPM_Rate | 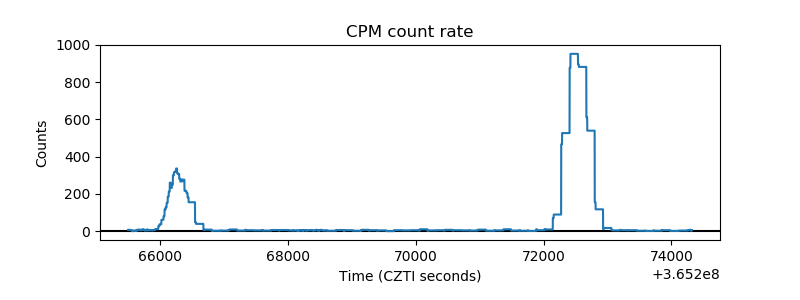 |
| CZT Counter | 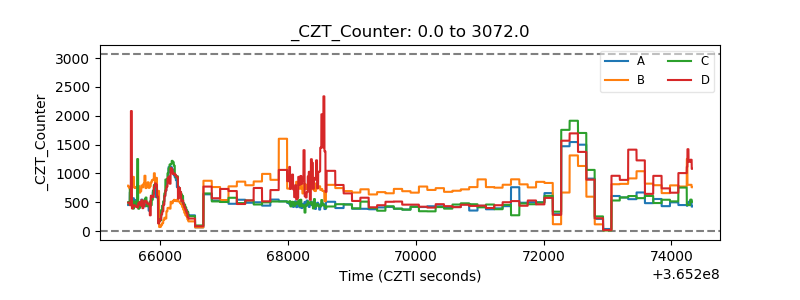 |
| +2.5 Volts monitor |  |
| +5 Volts monitor |  |
| _ROLL_ROT | 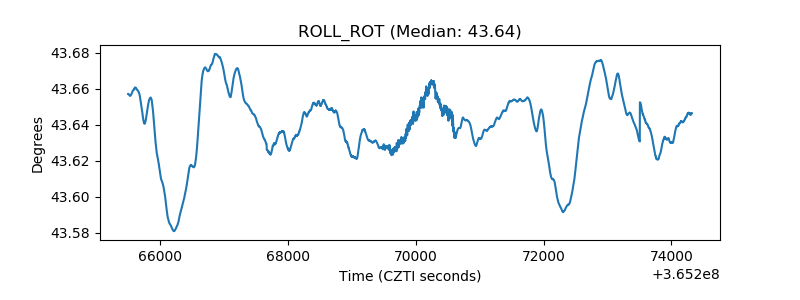 |
| _Roll_DEC | 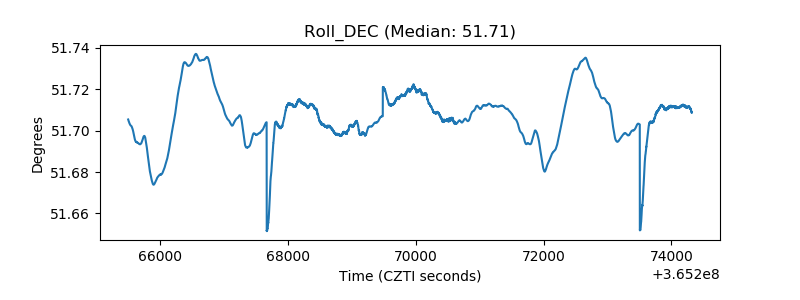 |
| _Roll_RA | 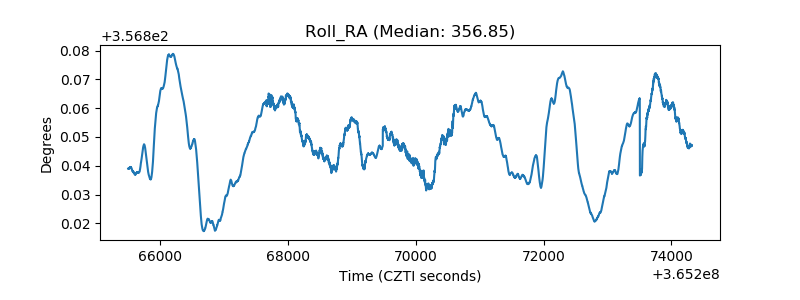 |
| Veto Counter | 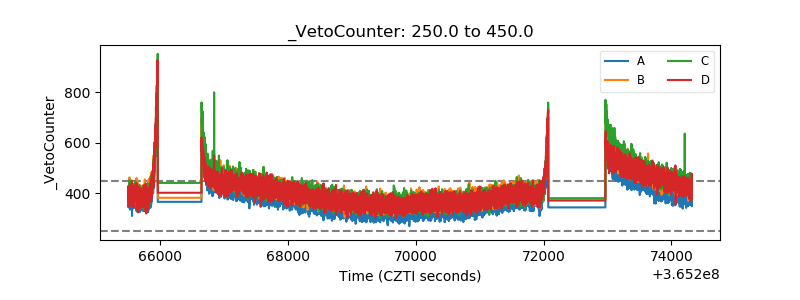 |