| Param | Original file | Final file |
|---|---|---|
| Filename | modeM0/AS1A10_056T01_9000004598_31553cztM0_level2.evt | modeM0/AS1A10_056T01_9000004598_31553cztM0_level2_quad_clean.evt |
| Size (bytes) | 132,992,640 | 27,809,280 |
| Size | 126.8 MB | 26.5 MB |
| Events in quadrant A | 798,801 | 191,206 |
| Events in quadrant B | 1,226,875 | 189,243 |
| Events in quadrant C | 901,155 | 188,435 |
| Events in quadrant D | 1,005,924 | 171,008 |
| Mode M0 | |||
|---|---|---|---|
| Quadrant | BADHDUFLAG | Total packets | Discarded packets |
| A | 0 | 5556 | 2264 |
| B | 0 | 8030 | 3599 |
| C | 0 | 6065 | 2399 |
| D | 0 | 7909 | 4049 |
| Mode M9 | |||
|---|---|---|---|
| Quadrant | BADHDUFLAG | Total packets | Discarded packets |
| A | 0 | 12 | 1 |
| B | 0 | 11 | 0 |
| C | 0 | 11 | 0 |
| D | 0 | 11 | 0 |
| Mode SS | |||
|---|---|---|---|
| Quadrant | BADHDUFLAG | Total packets | Discarded packets |
| A | 0 | 51 | 21 |
| B | 0 | 53 | 17 |
| C | 0 | 52 | 20 |
| D | 0 | 53 | 23 |
| Quadrant | Total seconds | Saturated seconds | Saturation percentage |
|---|---|---|---|
| A | 1379 | 23 | 1.667875% |
| B | 1330 | 102 | 7.669173% |
| C | 1385 | 81 | 5.848375% |
| D | 1323 | 53 | 4.006047% |
Noise dominated data is calculated using 1-second bins in cleaned event files. If a bin has >2000 counts, and if more than 50% of those come from <1% of pixels, then it is considered to be noise-dominated and hence unusable.
| Quadrant | # 1 sec bins | Bins with >0 counts | Bins with >2000 counts | High rate bins dominated by noise | Noise dominated (total time) | Noise dominated (detector-on time) | Marked lightcurve |
|---|---|---|---|---|---|---|---|
| A | 6625 | 1457 | 0 | 0 | 0.00% | 0.00% | 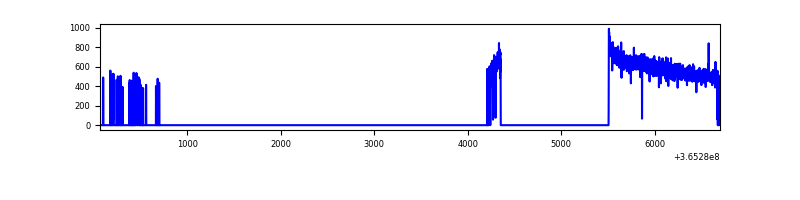 |
| B | 6505 | 1390 | 14 | 14 | 0.22% | 1.01% | 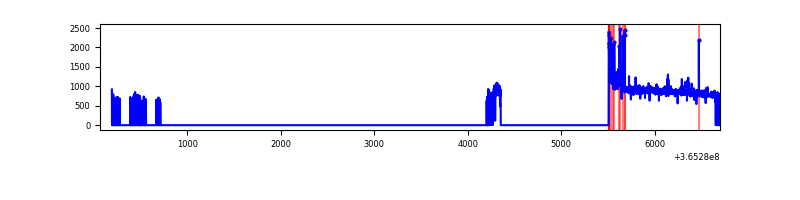 |
| C | 6631 | 1471 | 2 | 2 | 0.03% | 0.14% | 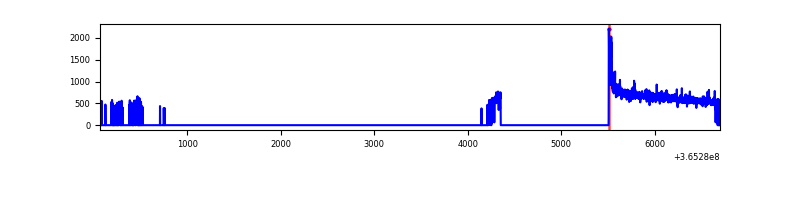 |
| D | 6501 | 1364 | 13 | 13 | 0.20% | 0.95% | 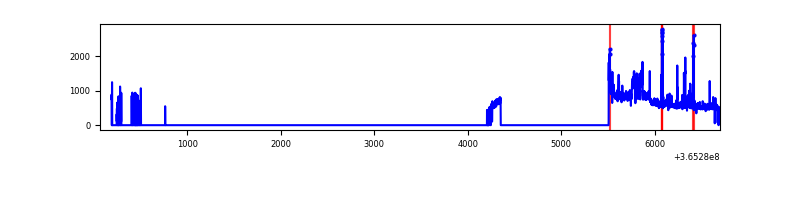 |
Top three noisy pixels from each quadrant. If the there are fewer than three noisy pixels in the level2.evt file, extra rows are filled as -1
| Pixel properties | Quadrant properties | ||||||
|---|---|---|---|---|---|---|---|
| Quadrant | DetID | PixID | Counts | Sigma | Mean | Median | Sigma |
| A | 13 | 254 | 2817 | 61.21 | 206 | 202 | 42.7 |
| A | 3 | 137 | 1906 | 39.89 | 206 | 202 | 42.7 |
| A | 0 | 226 | 1731 | 35.79 | 206 | 202 | 42.7 |
| B | 6 | 159 | 349956 | 8995.26 | 198 | 194 | 38.9 |
| B | 5 | 172 | 64870 | 1663.35 | 198 | 194 | 38.9 |
| B | 4 | 80 | 19024 | 484.27 | 198 | 194 | 38.9 |
| C | 14 | 238 | 32964 | 666.9 | 204 | 204 | 49.1 |
| C | 0 | 10 | 27790 | 561.57 | 204 | 204 | 49.1 |
| C | 3 | 233 | 25062 | 506.04 | 204 | 204 | 49.1 |
| D | 8 | 195 | 164915 | 3383.03 | 196 | 190 | 48.7 |
| D | 13 | 249 | 59953 | 1227.38 | 196 | 190 | 48.7 |
| D | 2 | 250 | 19522 | 397.03 | 196 | 190 | 48.7 |
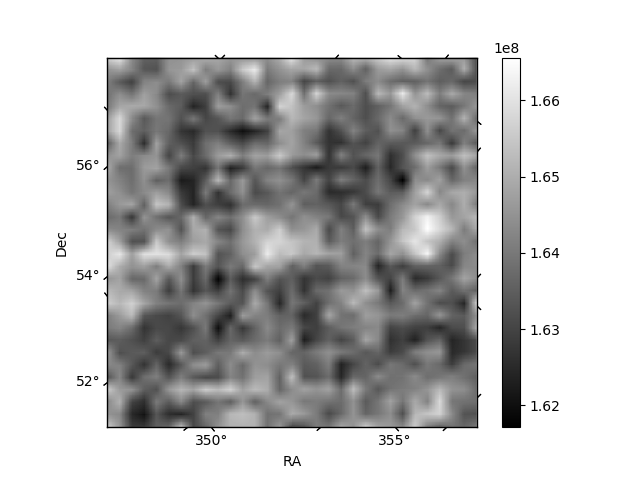
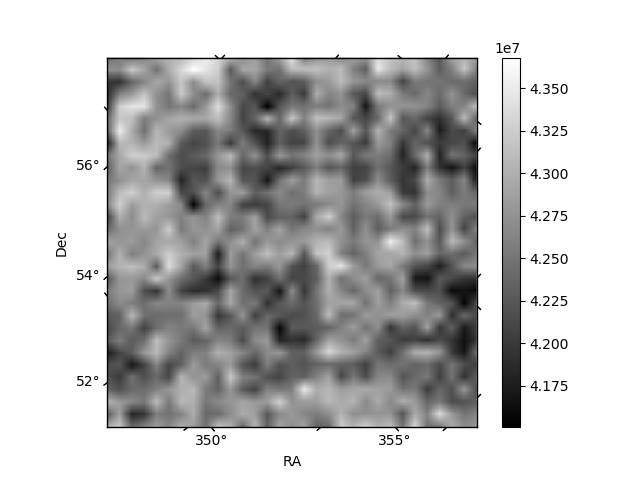
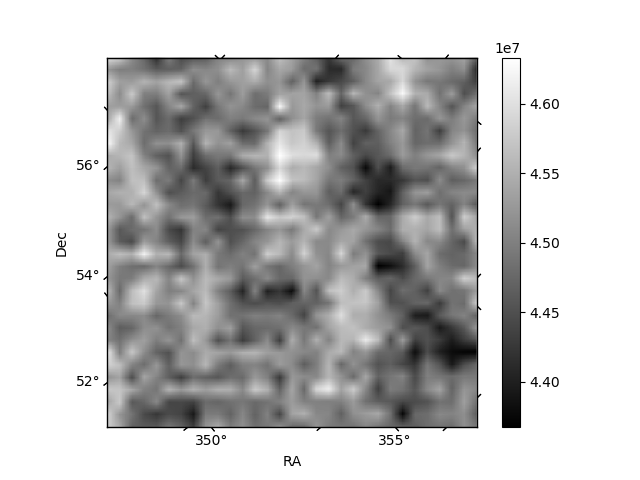
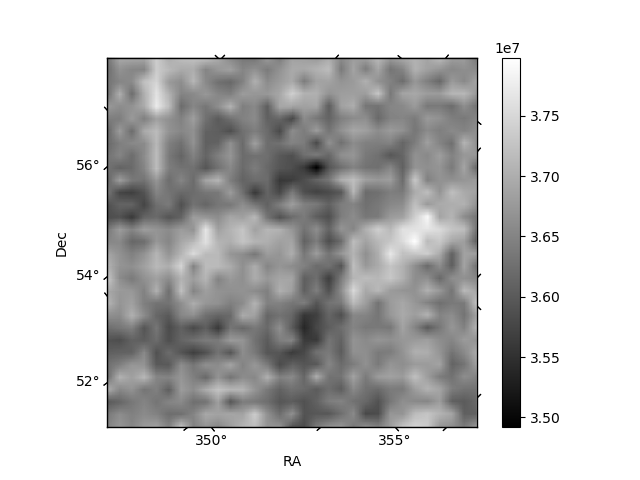
Histogram calculated using DETX and DETY for each event in the final _common_clean file
| Quadrant A | 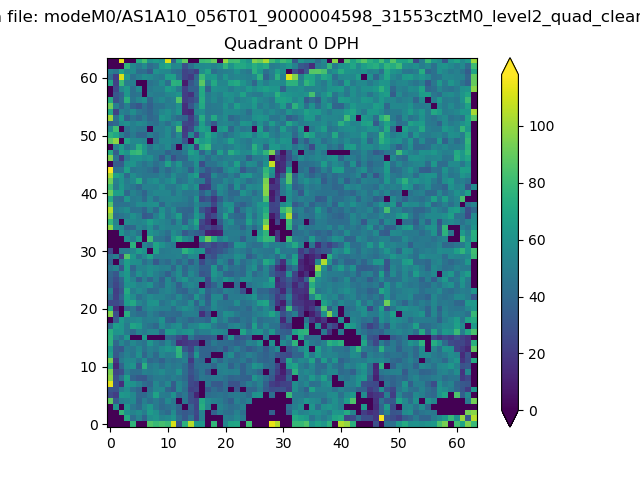 |
 |
Quadrant B |
|---|---|---|---|
| Quadrant D | 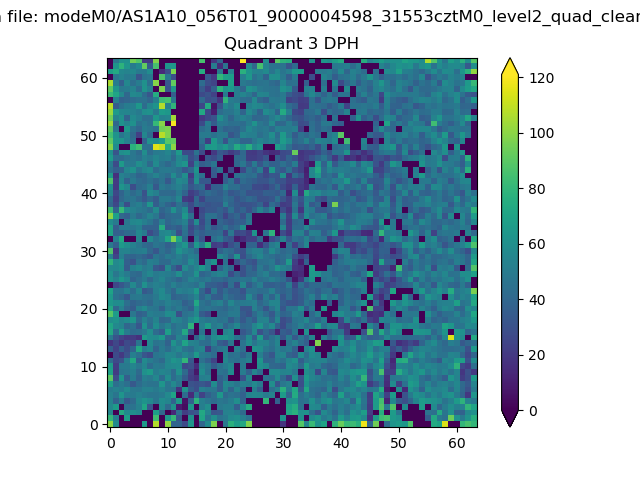 |
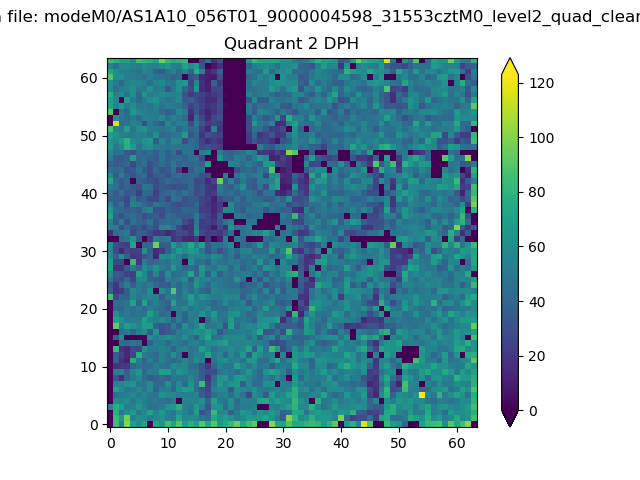 |
Quadrant C |
| Plot type | Count rate plots | Images |
|---|---|---|
| Comparison with Poisson distribution Blue bars denote a histogram of data divided into 1 sec bins. Red curve is a Poisson curve with rate = median count rate of data. |
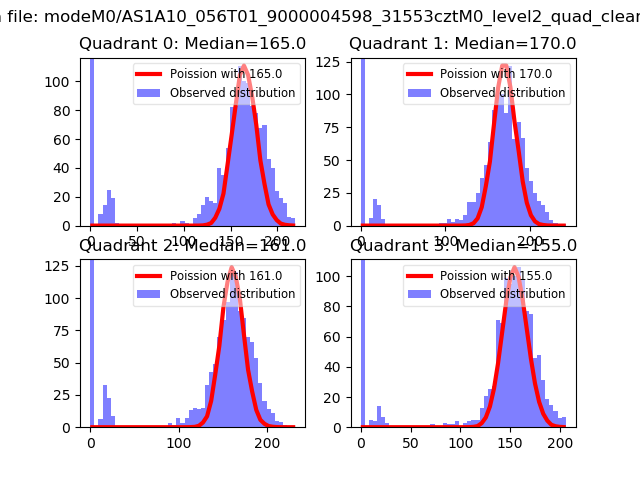 |
 |
| Quadrant-wise count rates Data is divided into 100 sec bins |
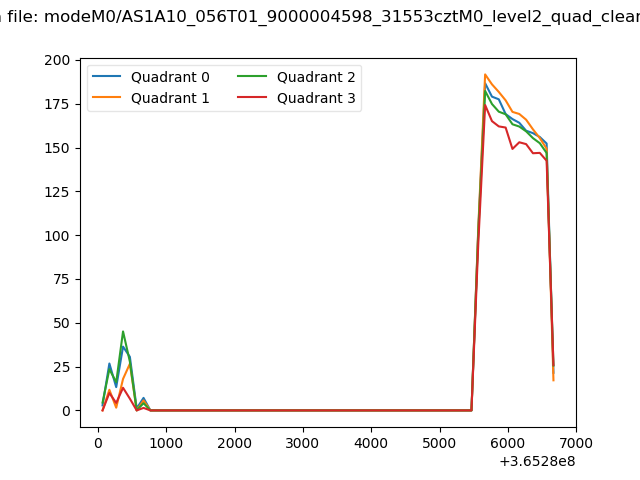 |
|
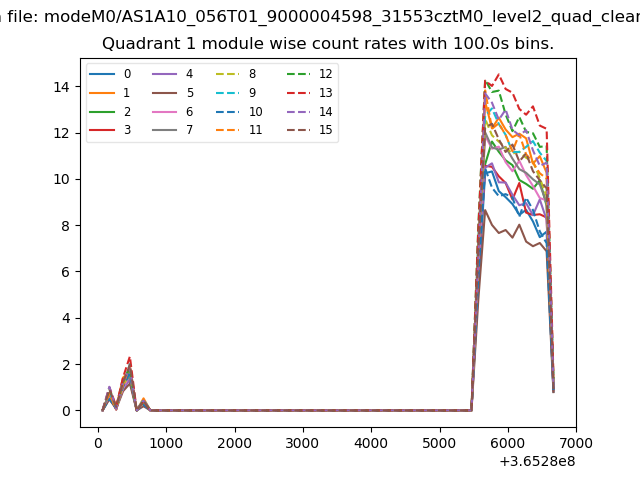
| Module-wise count rates for Quadrant A Data is divided into 100 sec bins |
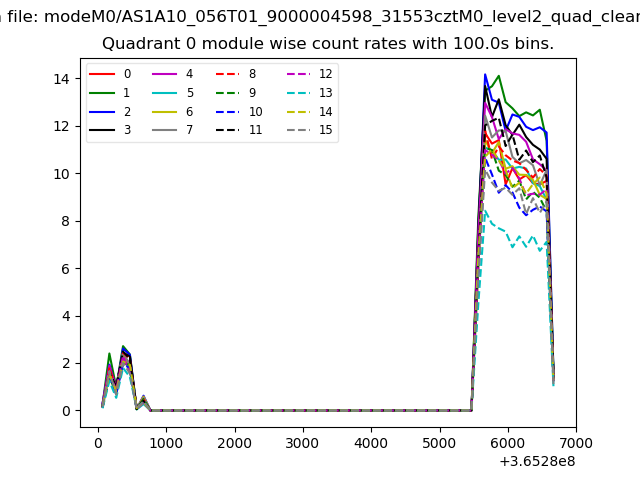 |
 |
| Module-wise count rates for Quadrant B Data is divided into 100 sec bins |
 |
 |
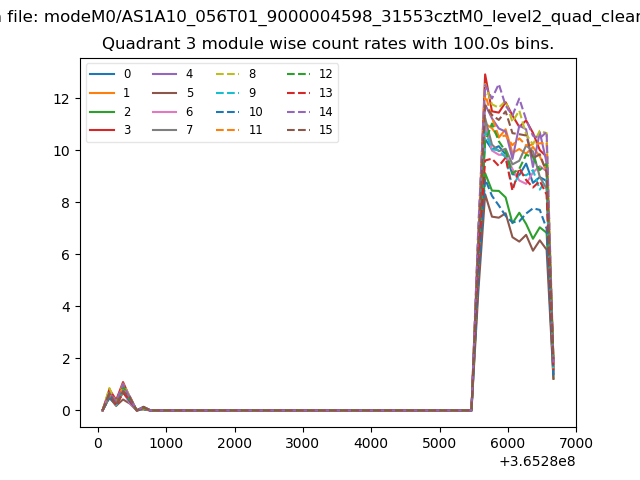
| Module-wise count rates for Quadrant C Data is divided into 100 sec bins |
 |
 |
| Module-wise count rates for Quadrant D Data is divided into 100 sec bins |
 |
 |
| Parameter | Plot |
|---|---|
| CZT HV Monitor | 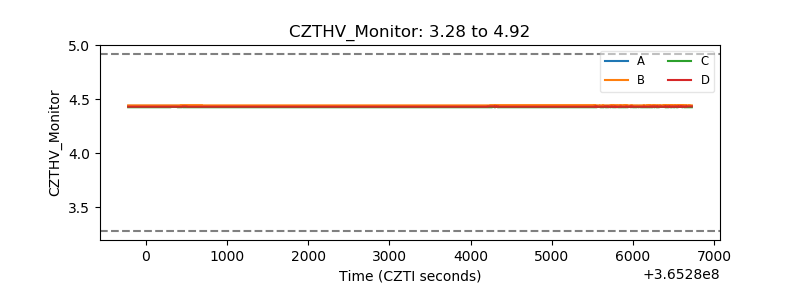 |
| D_VDD | 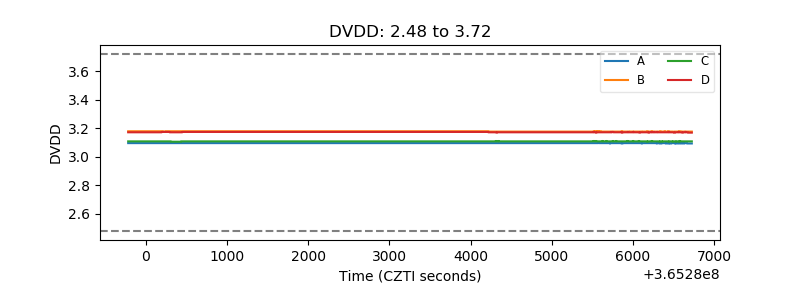 |
| Temperature 1 | 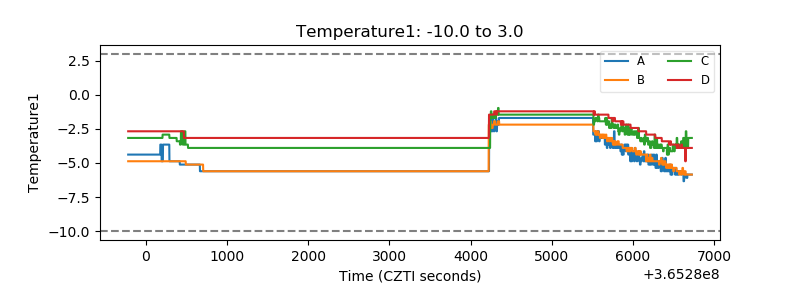 |
| Veto HV Monitor | 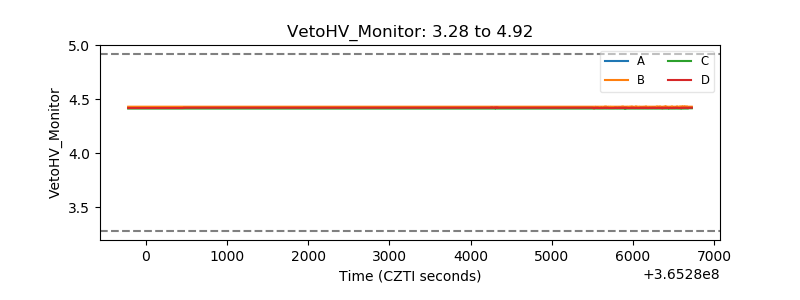 |
| Veto LLD | 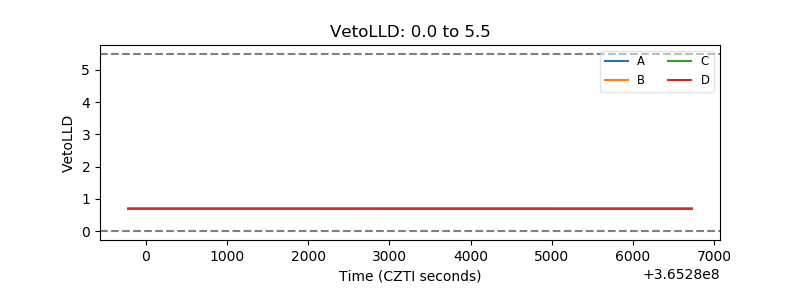 |
| Alpha Counter | 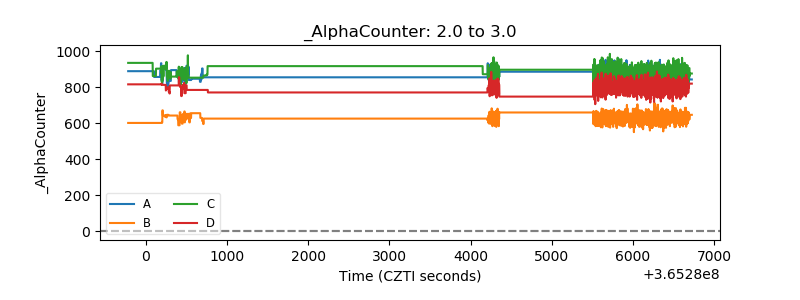 |
| _CPM_Rate | 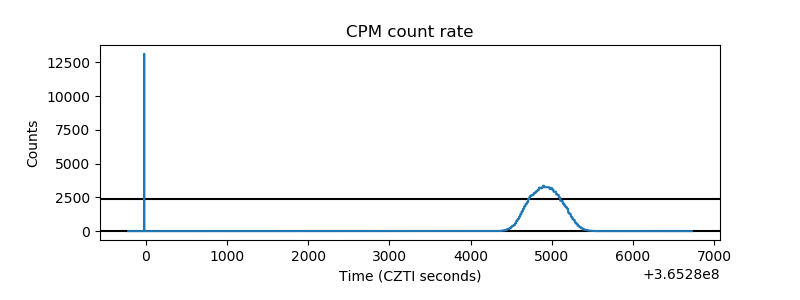 |
| CZT Counter | 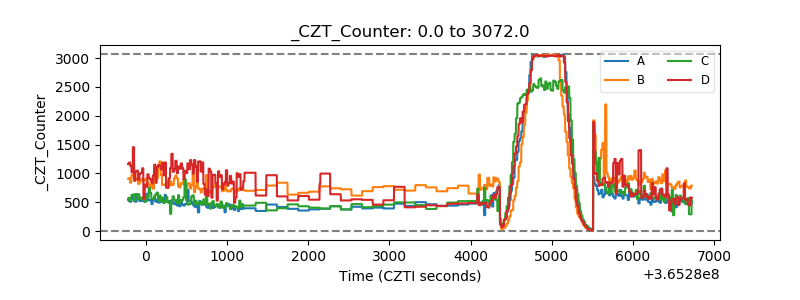 |
| +2.5 Volts monitor |  |
| +5 Volts monitor |  |
| _ROLL_ROT | 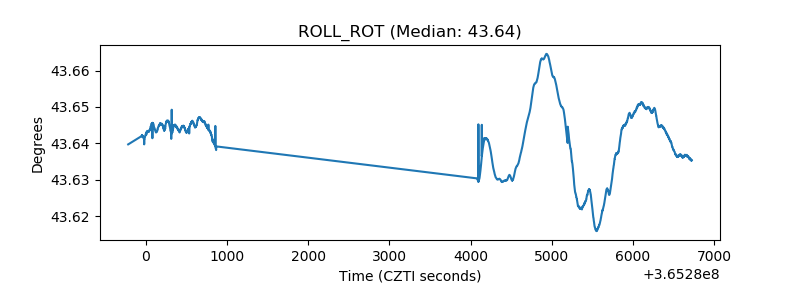 |
| _Roll_DEC | 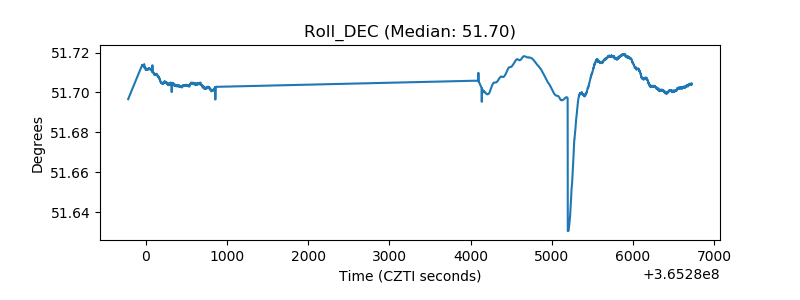 |
| _Roll_RA | 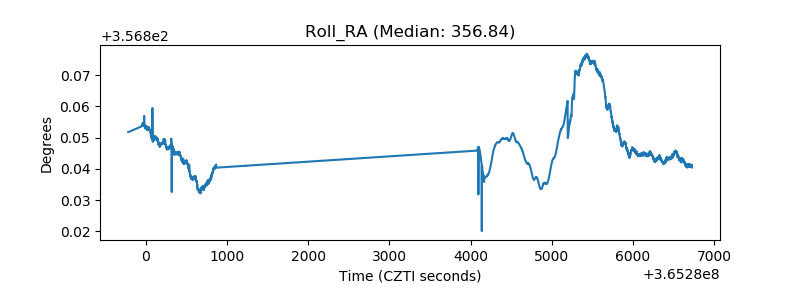 |
| Veto Counter | 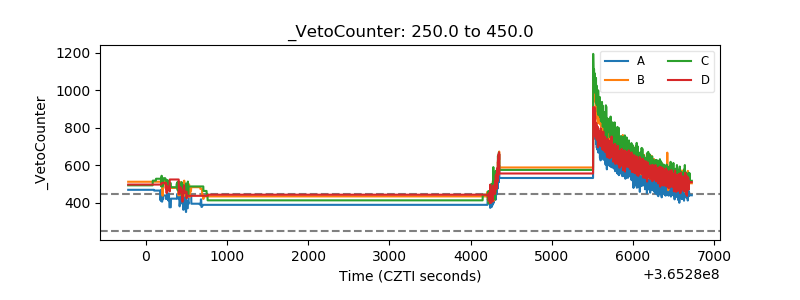 |