| Param | Original file | Final file |
|---|---|---|
| Filename | modeM0/AS1A10_056T01_9000004598_31554cztM0_level2.evt | modeM0/AS1A10_056T01_9000004598_31554cztM0_level2_quad_clean.evt |
| Size (bytes) | 599,630,400 | 115,577,280 |
| Size | 571.9 MB | 110.2 MB |
| Events in quadrant A | 3,339,800 | 769,014 |
| Events in quadrant B | 6,931,962 | 775,120 |
| Events in quadrant C | 3,609,004 | 760,191 |
| Events in quadrant D | 3,829,042 | 732,758 |
| Mode M0 | |||
|---|---|---|---|
| Quadrant | BADHDUFLAG | Total packets | Discarded packets |
| A | 0 | 14342 | 2 |
| B | 0 | 25093 | 2 |
| C | 0 | 15075 | 2 |
| D | 0 | 15667 | 2 |
| Mode M9 | |||
|---|---|---|---|
| Quadrant | BADHDUFLAG | Total packets | Discarded packets |
| A | 0 | 24 | 0 |
| B | 0 | 24 | 0 |
| C | 0 | 24 | 0 |
| D | 0 | 24 | 0 |
| Mode SS | |||
|---|---|---|---|
| Quadrant | BADHDUFLAG | Total packets | Discarded packets |
| A | 0 | 138 | 0 |
| B | 0 | 138 | 0 |
| C | 0 | 138 | 0 |
| D | 0 | 138 | 0 |
| Quadrant | Total seconds | Saturated seconds | Saturation percentage |
|---|---|---|---|
| A | 6642 | 47 | 0.707618% |
| B | 6643 | 983 | 14.797531% |
| C | 6643 | 183 | 2.754779% |
| D | 6643 | 104 | 1.565558% |
Noise dominated data is calculated using 1-second bins in cleaned event files. If a bin has >2000 counts, and if more than 50% of those come from <1% of pixels, then it is considered to be noise-dominated and hence unusable.
| Quadrant | # 1 sec bins | Bins with >0 counts | Bins with >2000 counts | High rate bins dominated by noise | Noise dominated (total time) | Noise dominated (detector-on time) | Marked lightcurve |
|---|---|---|---|---|---|---|---|
| A | 9047 | 6642 | 0 | 0 | 0.00% | 0.00% | 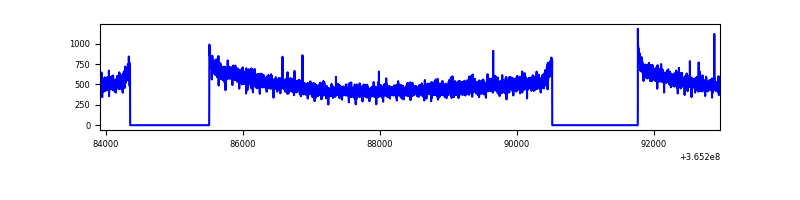 |
| B | 9048 | 6644 | 602 | 602 | 6.65% | 9.06% | 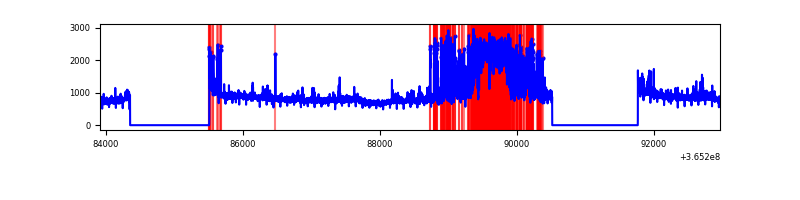 |
| C | 9048 | 6643 | 18 | 18 | 0.20% | 0.27% | 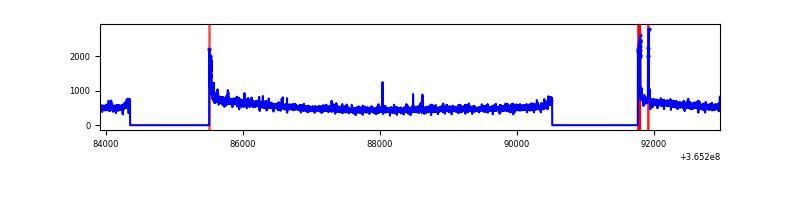 |
| D | 9048 | 6643 | 35 | 35 | 0.39% | 0.53% | 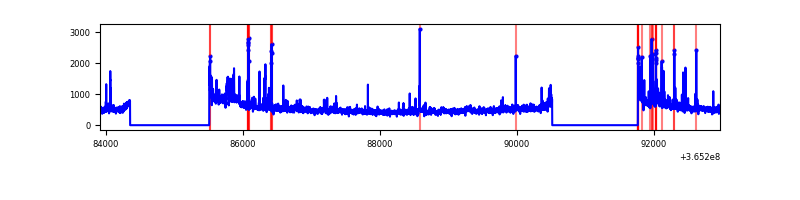 |
Top three noisy pixels from each quadrant. If the there are fewer than three noisy pixels in the level2.evt file, extra rows are filled as -1
| Pixel properties | Quadrant properties | ||||||
|---|---|---|---|---|---|---|---|
| Quadrant | DetID | PixID | Counts | Sigma | Mean | Median | Sigma |
| A | 13 | 254 | 12573 | 68.71 | 865 | 850 | 170.6 |
| A | 3 | 137 | 8461 | 44.61 | 865 | 850 | 170.6 |
| A | 0 | 226 | 7142 | 36.88 | 865 | 850 | 170.6 |
| B | 4 | 80 | 1770281 | 11401.76 | 832 | 812 | 155.2 |
| B | 6 | 159 | 1754863 | 11302.41 | 832 | 812 | 155.2 |
| B | 5 | 172 | 67583 | 430.25 | 832 | 812 | 155.2 |
| C | 14 | 238 | 136157 | 691.84 | 845 | 852 | 195.6 |
| C | 0 | 10 | 96725 | 490.22 | 845 | 852 | 195.6 |
| C | 3 | 233 | 48648 | 244.39 | 845 | 852 | 195.6 |
| D | 8 | 195 | 334542 | 1684.95 | 844 | 822 | 198.1 |
| D | 2 | 250 | 125881 | 631.42 | 844 | 822 | 198.1 |
| D | 13 | 249 | 98120 | 491.26 | 844 | 822 | 198.1 |
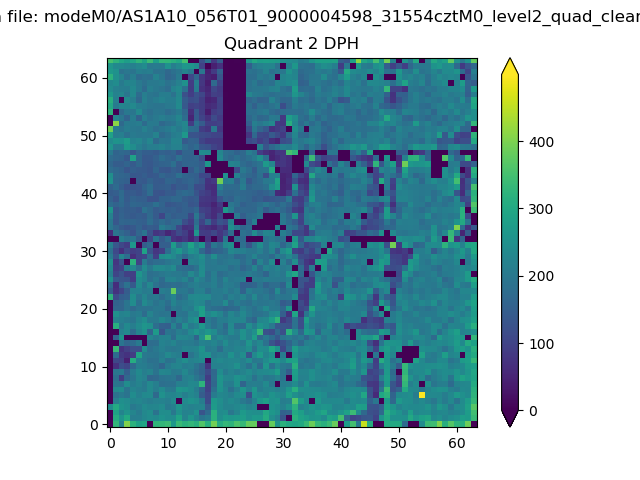
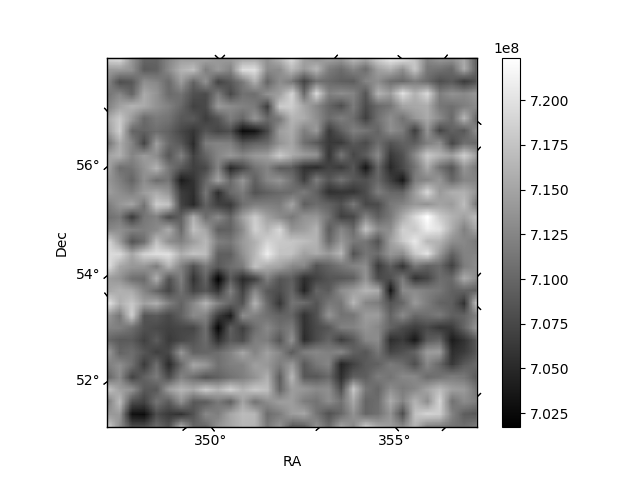
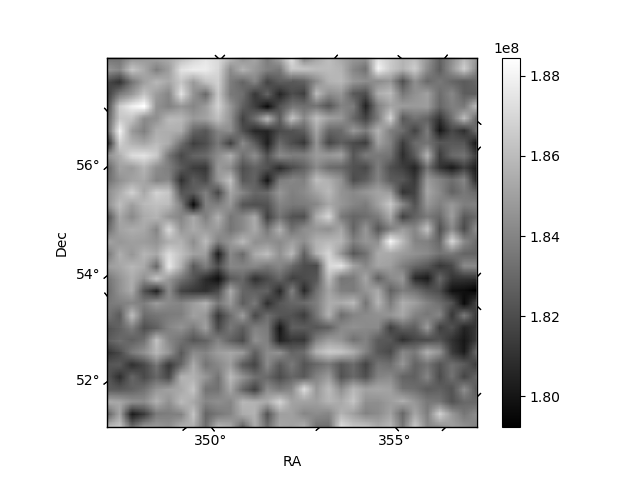
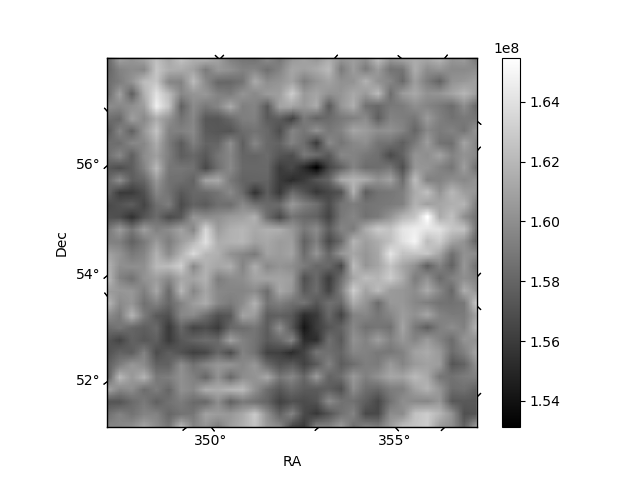
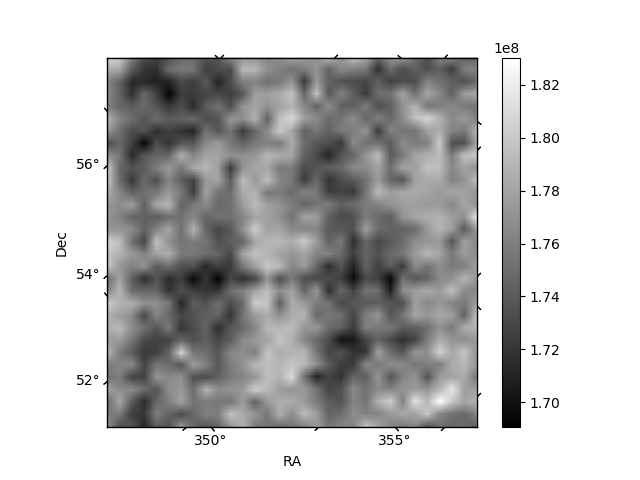
Histogram calculated using DETX and DETY for each event in the final _common_clean file
| Quadrant A | 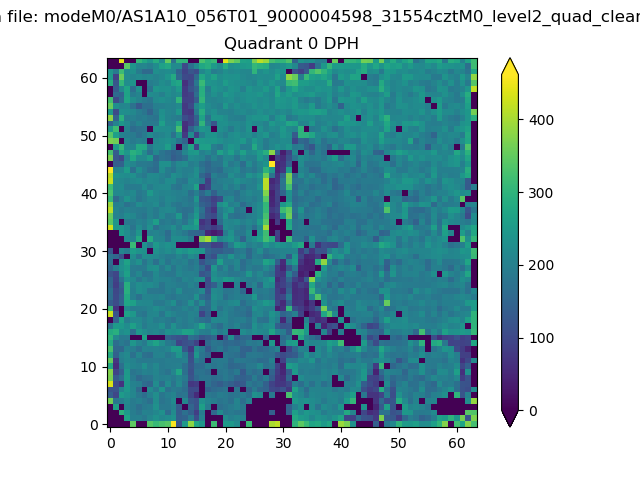 |
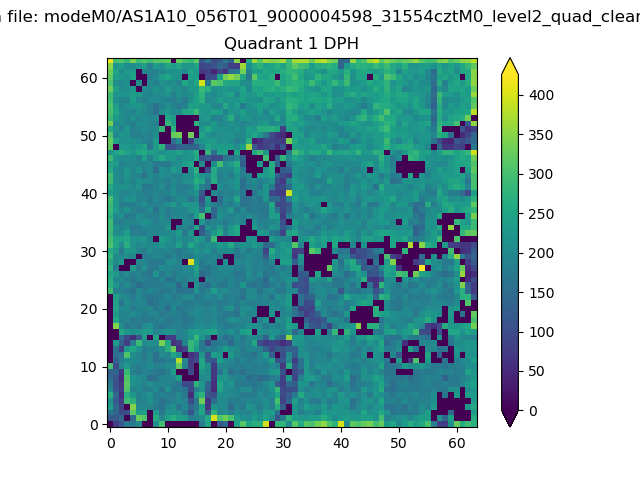 |
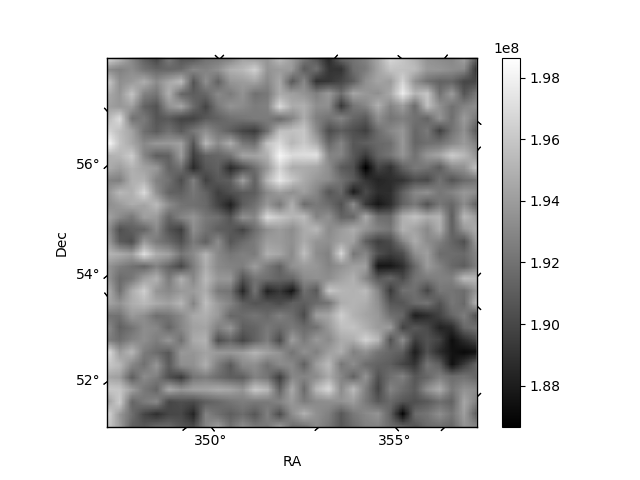
Quadrant B |
|---|---|---|---|
| Quadrant D | 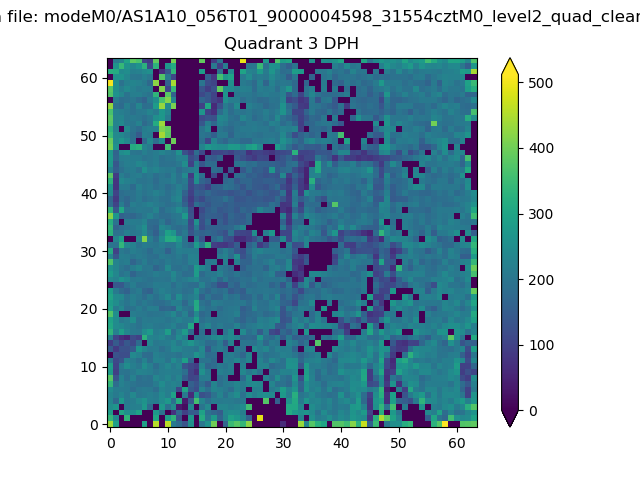 |
 |
Quadrant C |
| Plot type | Count rate plots | Images |
|---|---|---|
| Comparison with Poisson distribution Blue bars denote a histogram of data divided into 1 sec bins. Red curve is a Poisson curve with rate = median count rate of data. |
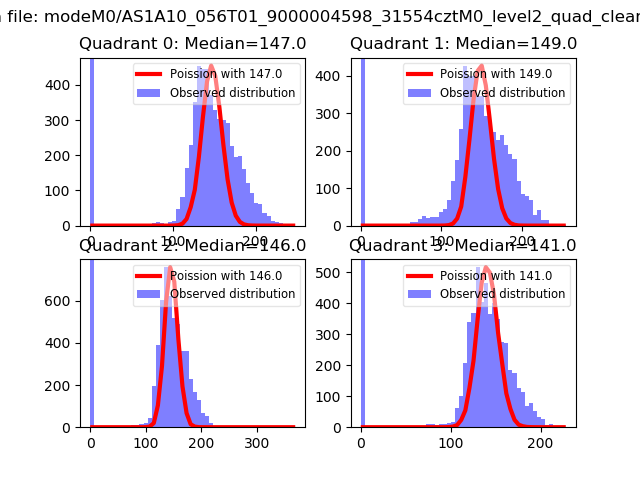 |
 |
| Quadrant-wise count rates Data is divided into 100 sec bins |
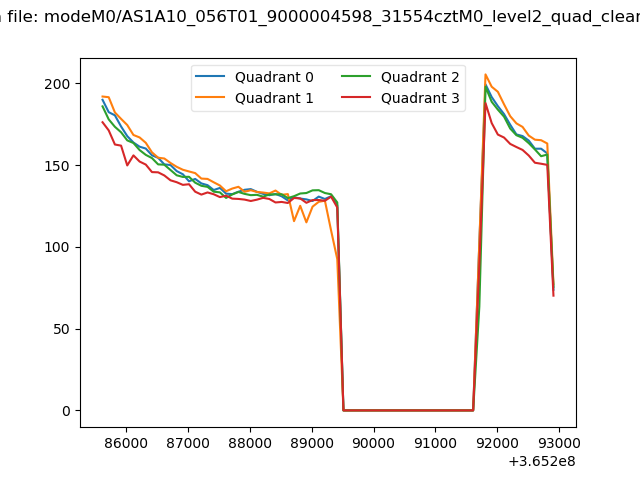 |
|
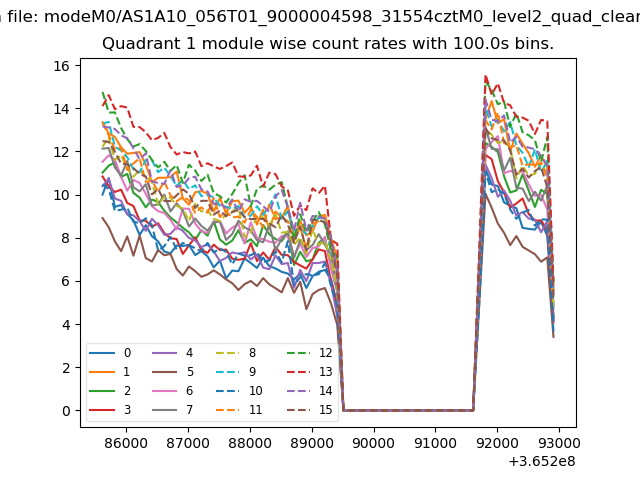
| Module-wise count rates for Quadrant A Data is divided into 100 sec bins |
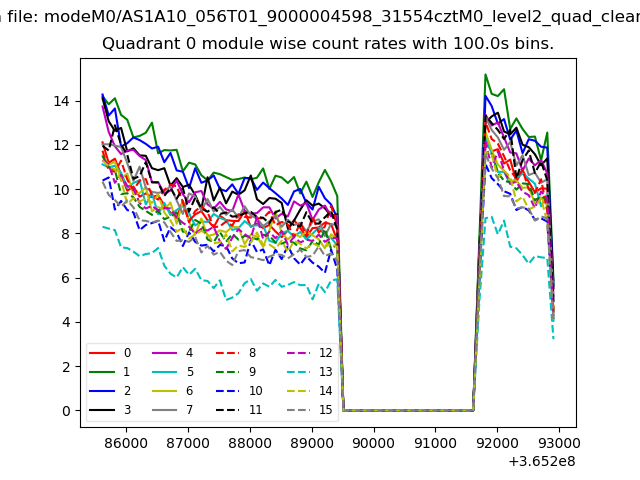 |
 |
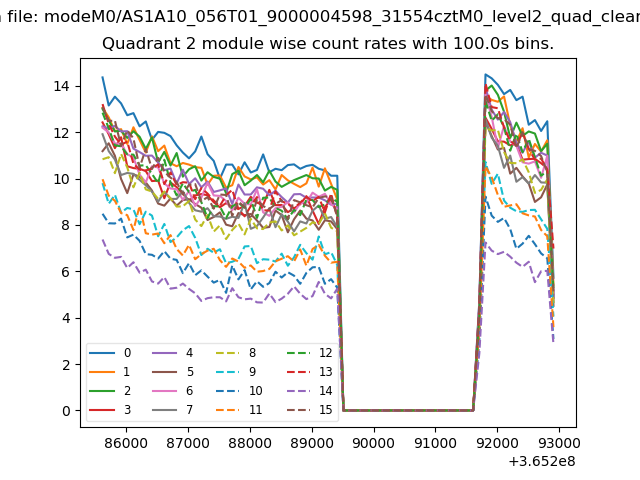
| Module-wise count rates for Quadrant B Data is divided into 100 sec bins |
 |
 |
| Module-wise count rates for Quadrant C Data is divided into 100 sec bins |
 |
 |
| Module-wise count rates for Quadrant D Data is divided into 100 sec bins |
 |
 |
| Parameter | Plot |
|---|---|
| CZT HV Monitor | 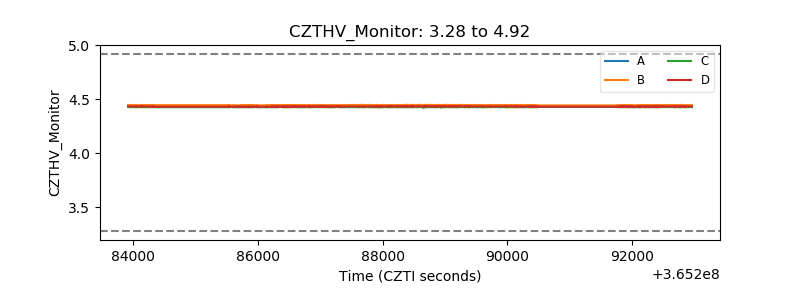 |
| D_VDD | 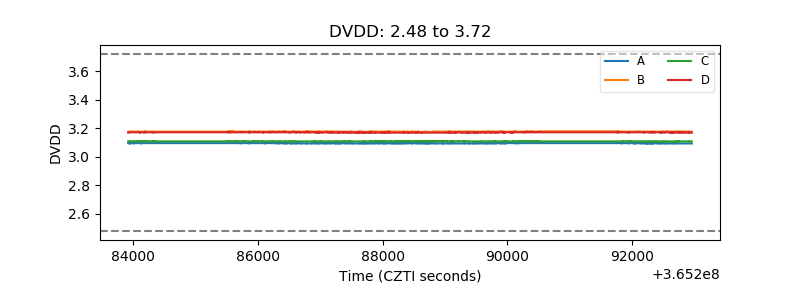 |
| Temperature 1 | 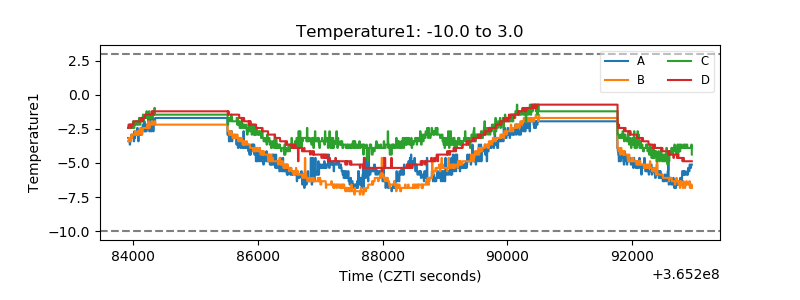 |
| Veto HV Monitor | 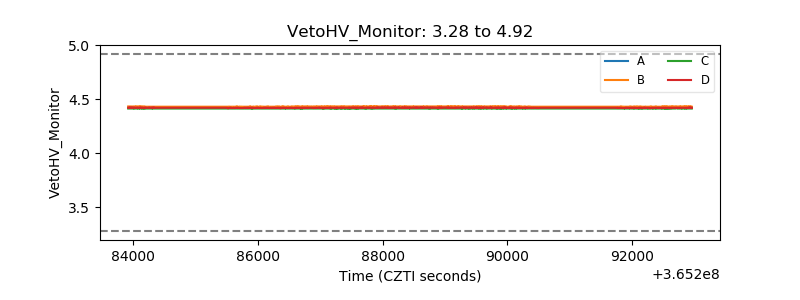 |
| Veto LLD |  |
| Alpha Counter | 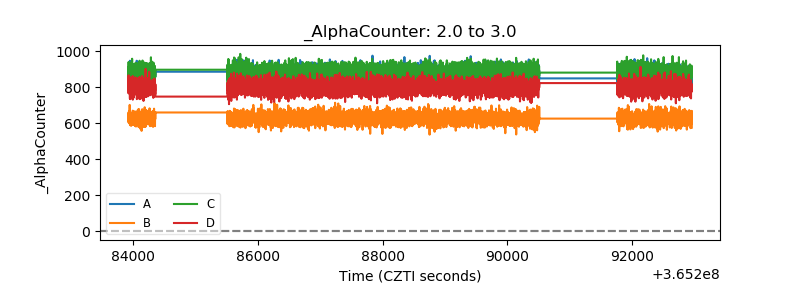 |
| _CPM_Rate | 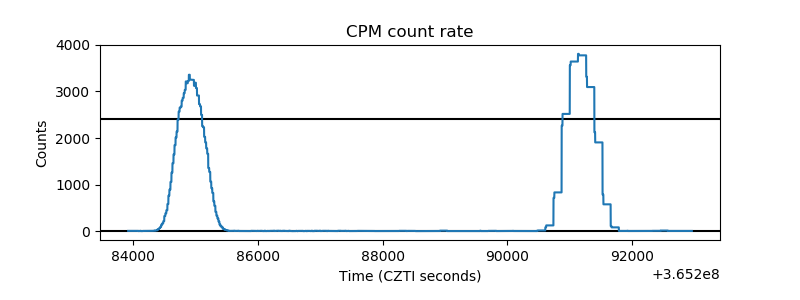 |
| CZT Counter | 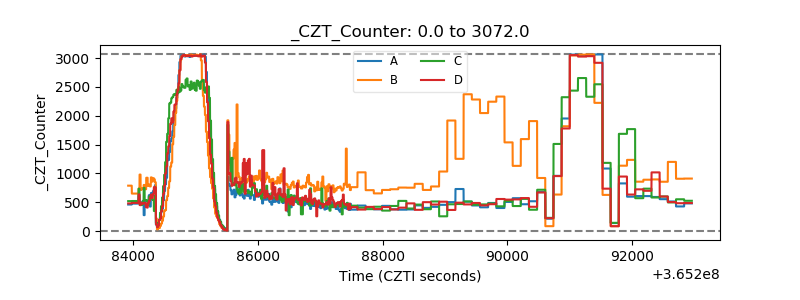 |
| +2.5 Volts monitor |  |
| +5 Volts monitor |  |
| _ROLL_ROT | 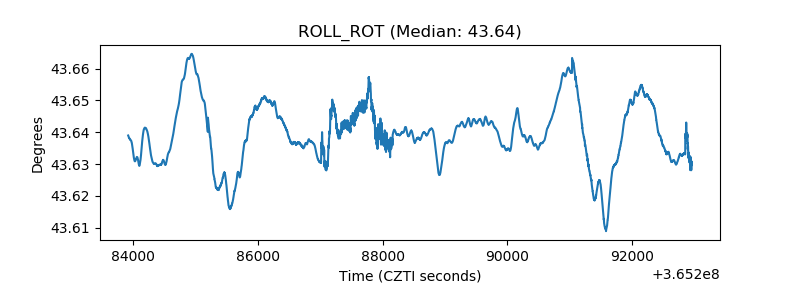 |
| _Roll_DEC | 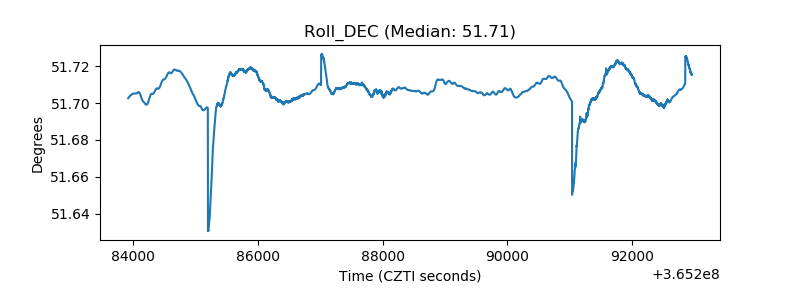 |
| _Roll_RA | 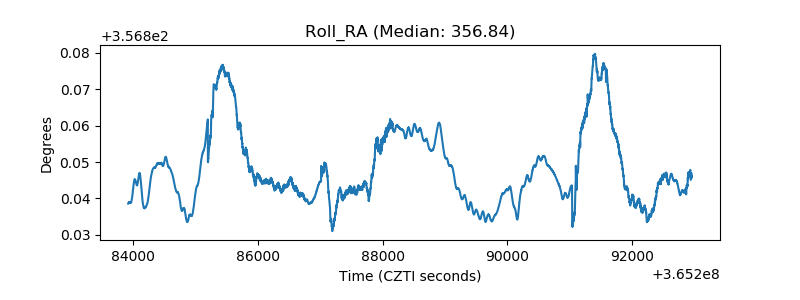 |
| Veto Counter |  |