| Param | Original file | Final file |
|---|---|---|
| Filename | modeM0/AS1A10_056T01_9000004598_31557cztM0_level2.evt | modeM0/AS1A10_056T01_9000004598_31557cztM0_level2_quad_clean.evt |
| Size (bytes) | 518,296,320 | 103,129,920 |
| Size | 494.3 MB | 98.4 MB |
| Events in quadrant A | 3,192,333 | 674,752 |
| Events in quadrant B | 5,200,851 | 689,708 |
| Events in quadrant C | 3,326,652 | 656,184 |
| Events in quadrant D | 3,527,997 | 641,027 |
| Mode M0 | |||
|---|---|---|---|
| Quadrant | BADHDUFLAG | Total packets | Discarded packets |
| A | 0 | 13783 | 2 |
| B | 0 | 20387 | 2 |
| C | 0 | 14060 | 2 |
| D | 0 | 14899 | 2 |
| Mode M9 | |||
|---|---|---|---|
| Quadrant | BADHDUFLAG | Total packets | Discarded packets |
| A | 0 | 15 | 0 |
| B | 0 | 16 | 0 |
| C | 0 | 16 | 0 |
| D | 0 | 16 | 0 |
| Mode SS | |||
|---|---|---|---|
| Quadrant | BADHDUFLAG | Total packets | Discarded packets |
| A | 0 | 134 | 0 |
| B | 0 | 134 | 0 |
| C | 0 | 134 | 0 |
| D | 0 | 134 | 0 |
| Quadrant | Total seconds | Saturated seconds | Saturation percentage |
|---|---|---|---|
| A | 6624 | 15 | 0.226449% |
| B | 6624 | 89 | 1.343599% |
| C | 6624 | 87 | 1.313406% |
| D | 6624 | 16 | 0.241546% |
Noise dominated data is calculated using 1-second bins in cleaned event files. If a bin has >2000 counts, and if more than 50% of those come from <1% of pixels, then it is considered to be noise-dominated and hence unusable.
| Quadrant | # 1 sec bins | Bins with >0 counts | Bins with >2000 counts | High rate bins dominated by noise | Noise dominated (total time) | Noise dominated (detector-on time) | Marked lightcurve |
|---|---|---|---|---|---|---|---|
| A | 7889 | 6624 | 9 | 9 | 0.11% | 0.14% | 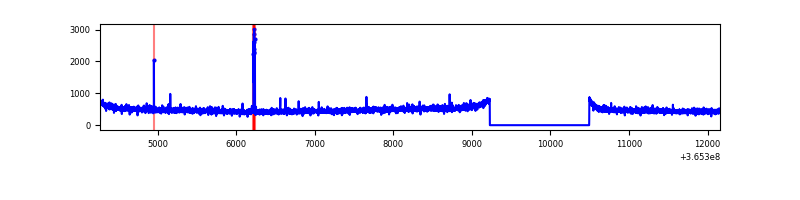 |
| B | 7889 | 6625 | 5 | 5 | 0.06% | 0.08% | 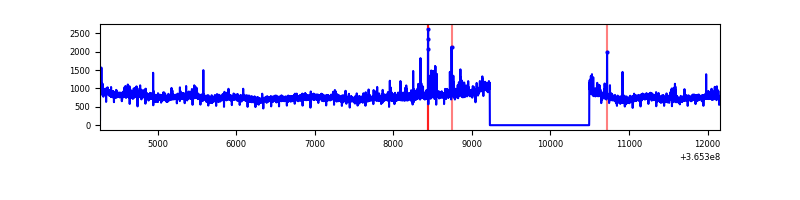 |
| C | 7889 | 6625 | 4 | 4 | 0.05% | 0.06% | 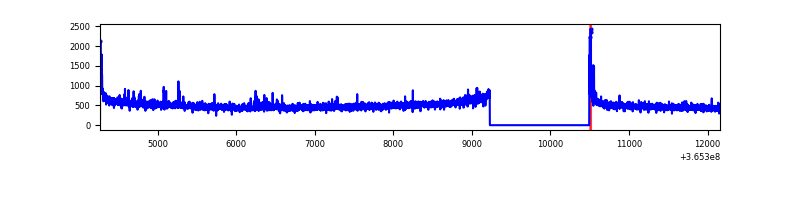 |
| D | 7889 | 6625 | 5 | 5 | 0.06% | 0.08% | 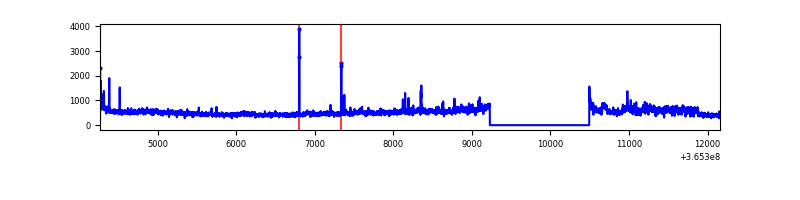 |
Top three noisy pixels from each quadrant. If the there are fewer than three noisy pixels in the level2.evt file, extra rows are filled as -1
| Pixel properties | Quadrant properties | ||||||
|---|---|---|---|---|---|---|---|
| Quadrant | DetID | PixID | Counts | Sigma | Mean | Median | Sigma |
| A | 5 | 168 | 32051 | 192.67 | 818 | 802 | 162.2 |
| A | 13 | 254 | 12221 | 70.41 | 818 | 802 | 162.2 |
| A | 3 | 137 | 8065 | 44.78 | 818 | 802 | 162.2 |
| B | 6 | 159 | 1801875 | 11802.65 | 821 | 804 | 152.6 |
| B | 4 | 80 | 114235 | 743.33 | 821 | 804 | 152.6 |
| B | 0 | 190 | 21994 | 138.86 | 821 | 804 | 152.6 |
| C | 14 | 238 | 139463 | 756.88 | 787 | 792 | 183.2 |
| C | 0 | 10 | 38328 | 204.87 | 787 | 792 | 183.2 |
| C | 4 | 175 | 19069 | 99.76 | 787 | 792 | 183.2 |
| D | 8 | 195 | 491526 | 2639.86 | 787 | 763 | 185.9 |
| D | 2 | 250 | 36121 | 190.19 | 787 | 763 | 185.9 |
| D | 2 | 234 | 25652 | 133.88 | 787 | 763 | 185.9 |
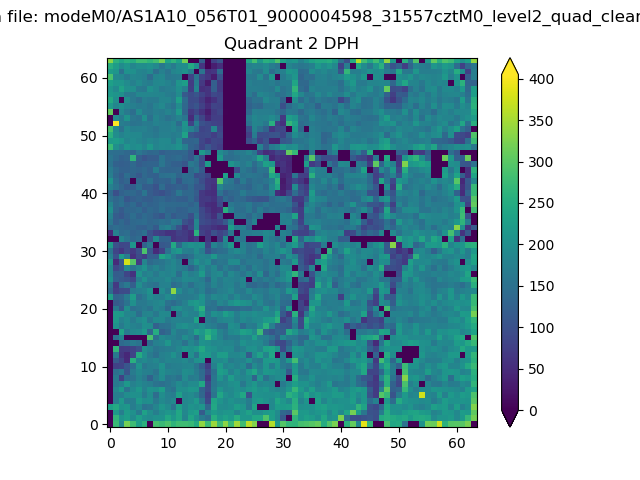
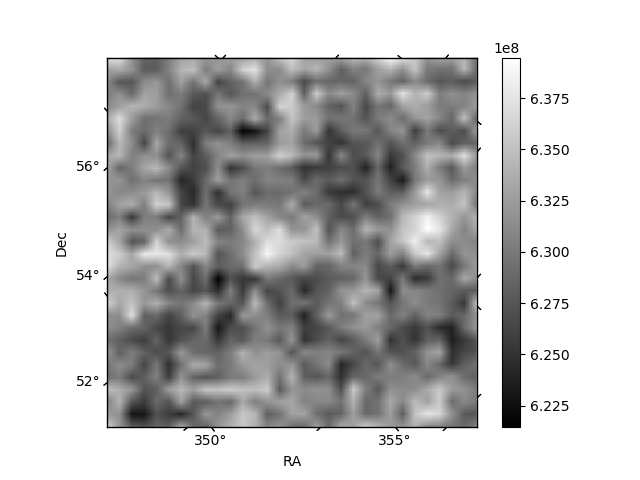
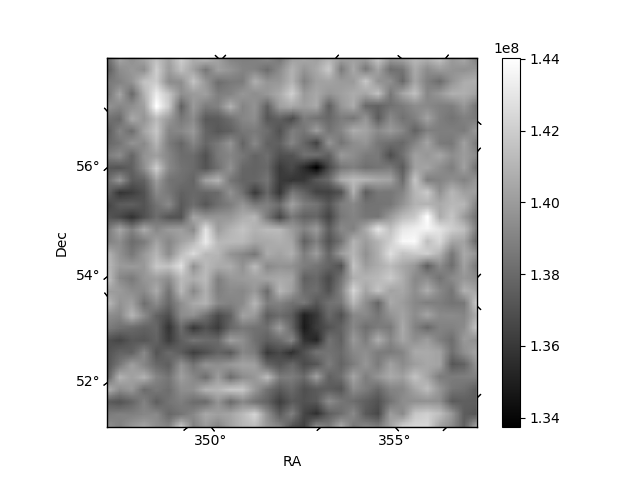
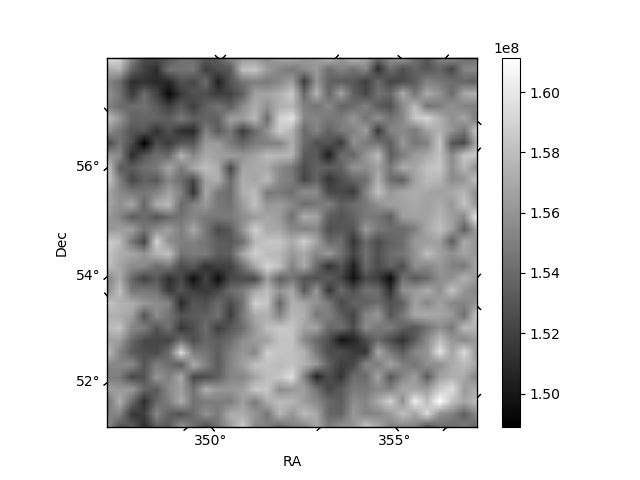
Histogram calculated using DETX and DETY for each event in the final _common_clean file
| Quadrant A | 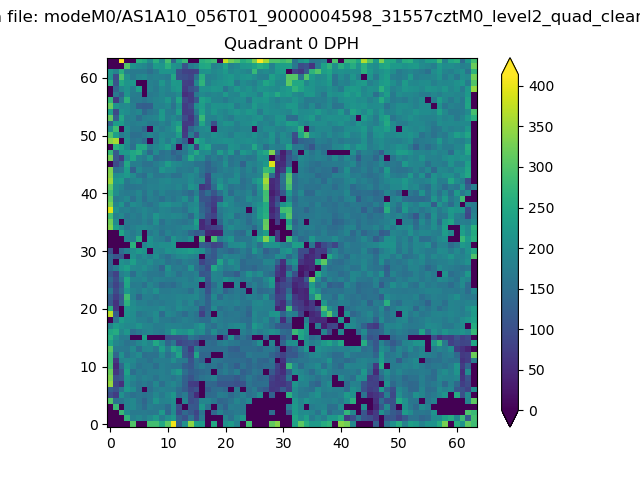 |
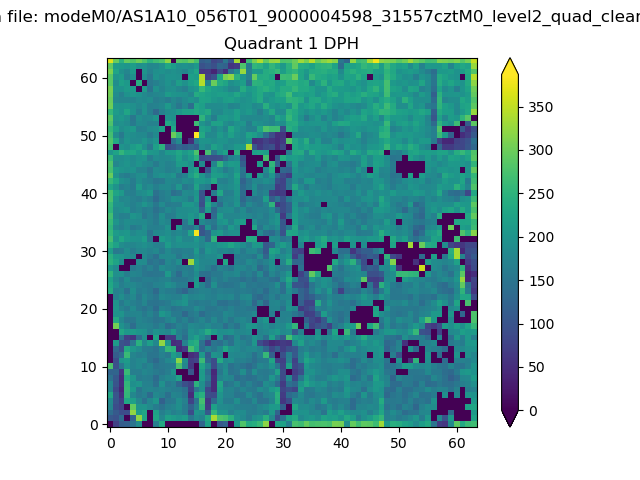 |
Quadrant B |
|---|---|---|---|
| Quadrant D | 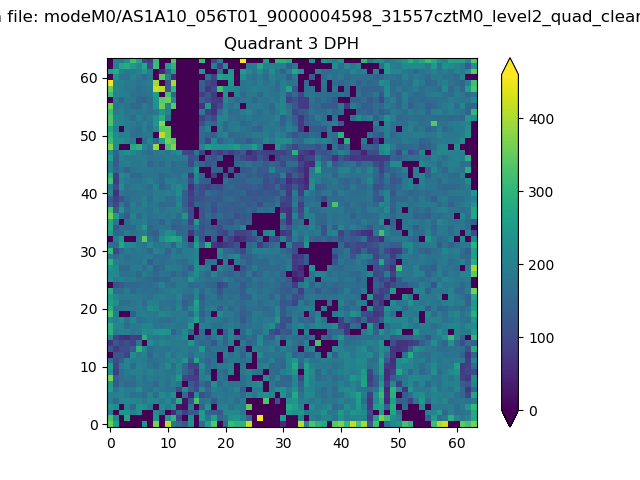 |
 |
Quadrant C |
| Plot type | Count rate plots | Images |
|---|---|---|
| Comparison with Poisson distribution Blue bars denote a histogram of data divided into 1 sec bins. Red curve is a Poisson curve with rate = median count rate of data. |
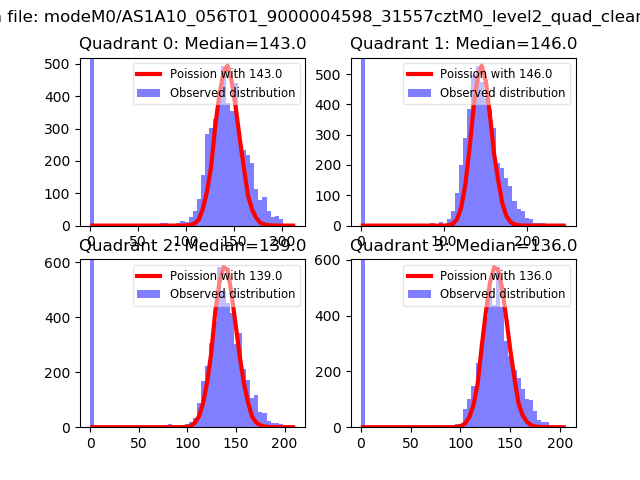 |
 |
| Quadrant-wise count rates Data is divided into 100 sec bins |
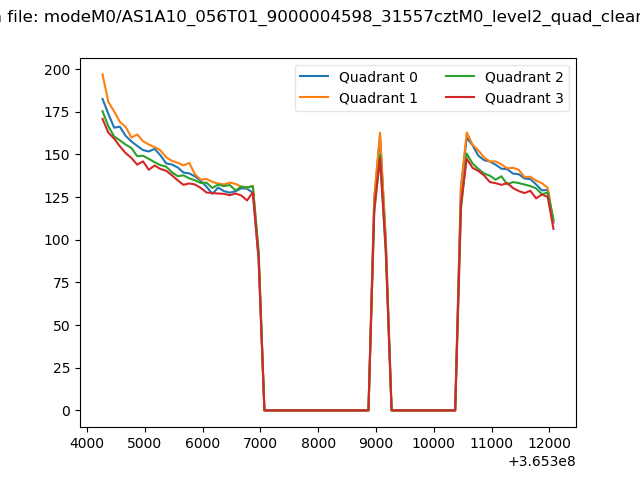 |
|
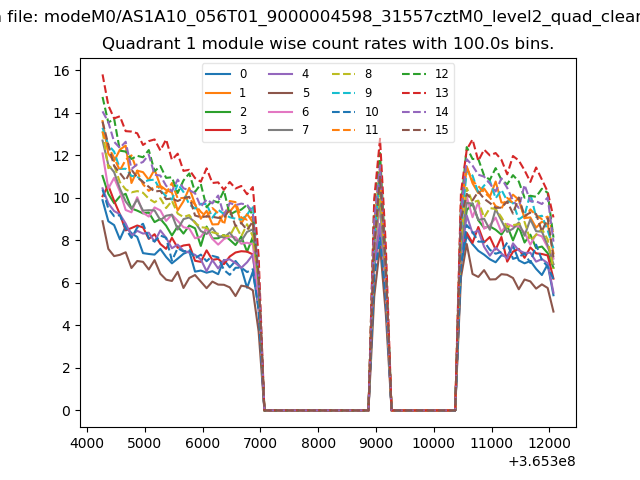
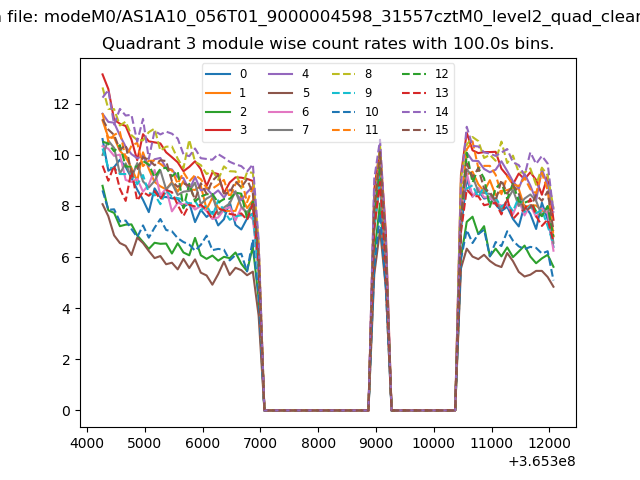
| Module-wise count rates for Quadrant A Data is divided into 100 sec bins |
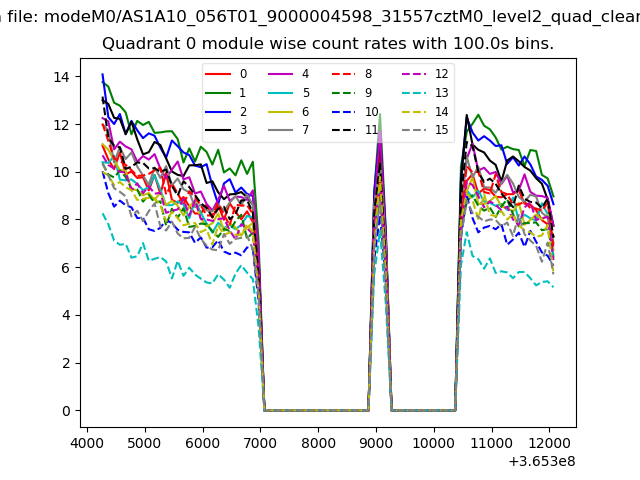 |
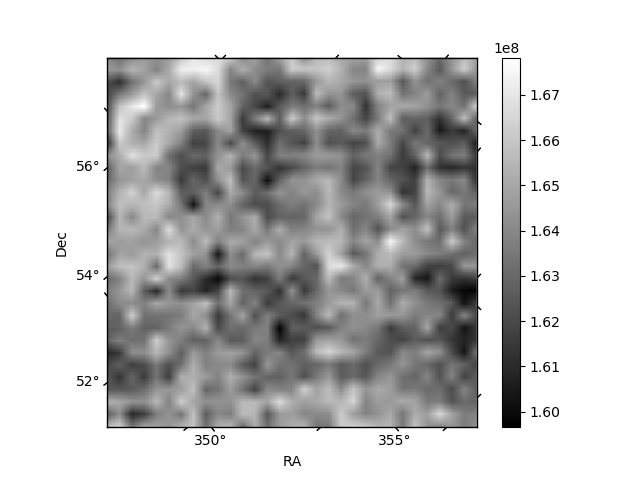 |
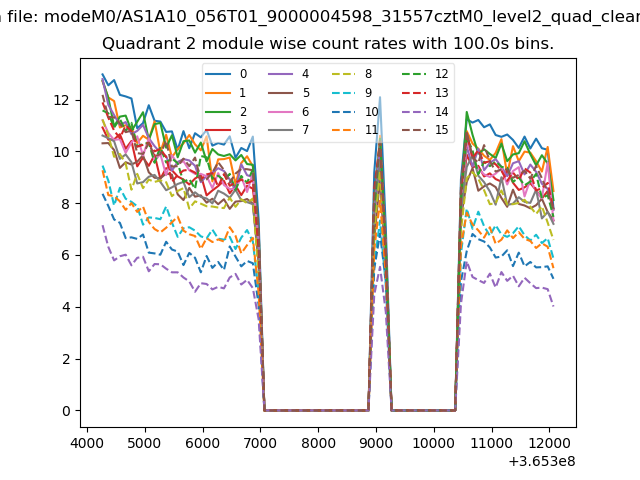
| Module-wise count rates for Quadrant B Data is divided into 100 sec bins |
 |
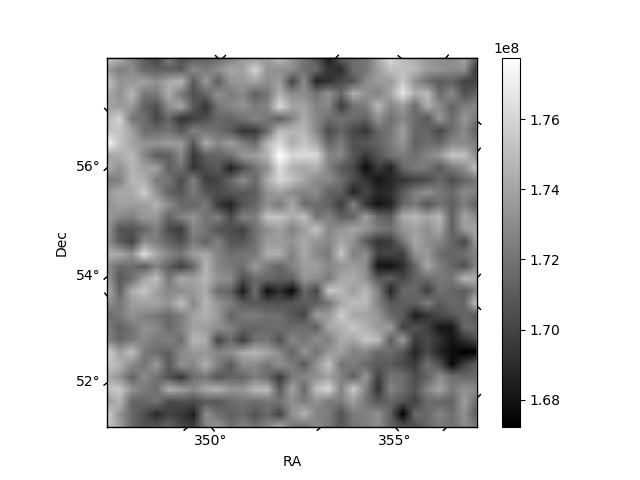 |
| Module-wise count rates for Quadrant C Data is divided into 100 sec bins |
 |
 |
| Module-wise count rates for Quadrant D Data is divided into 100 sec bins |
 |
 |
| Parameter | Plot |
|---|---|
| CZT HV Monitor | 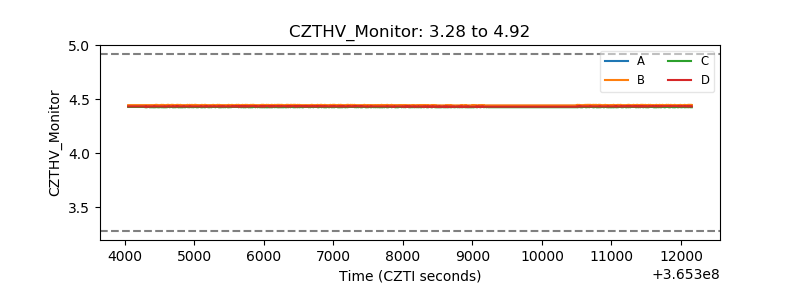 |
| D_VDD | 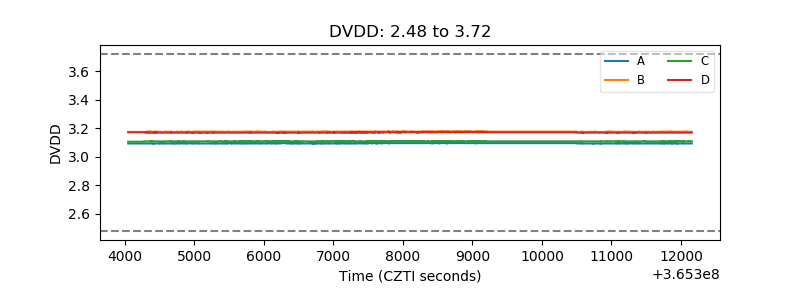 |
| Temperature 1 |  |
| Veto HV Monitor | 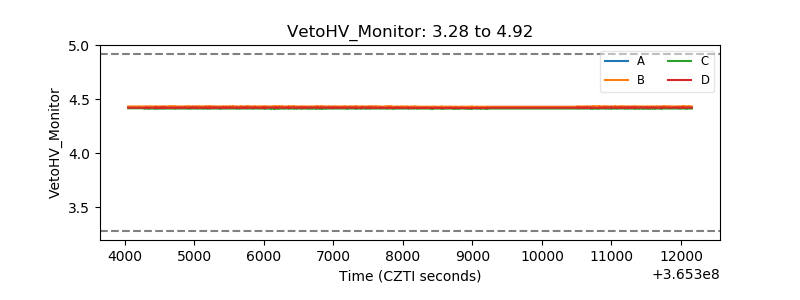 |
| Veto LLD | 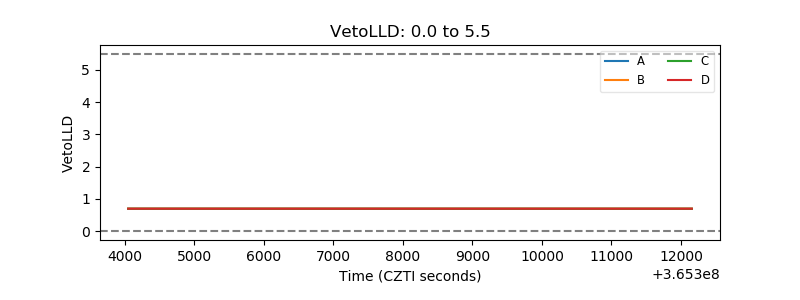 |
| Alpha Counter | 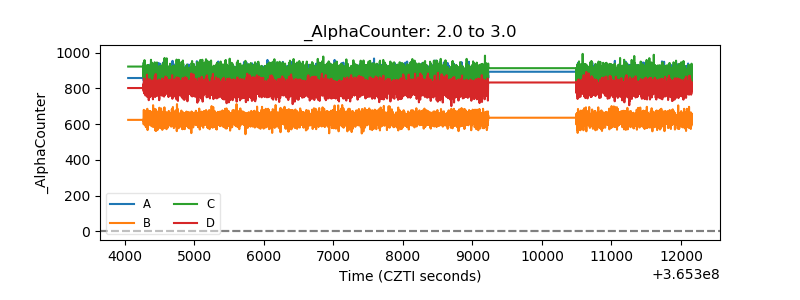 |
| _CPM_Rate | 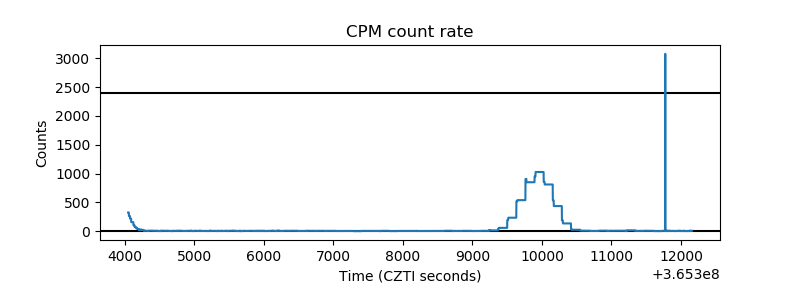 |
| CZT Counter | 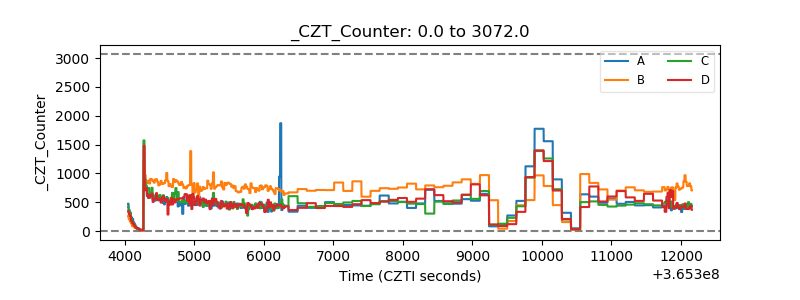 |
| +2.5 Volts monitor |  |
| +5 Volts monitor |  |
| _ROLL_ROT |  |
| _Roll_DEC |  |
| _Roll_RA | 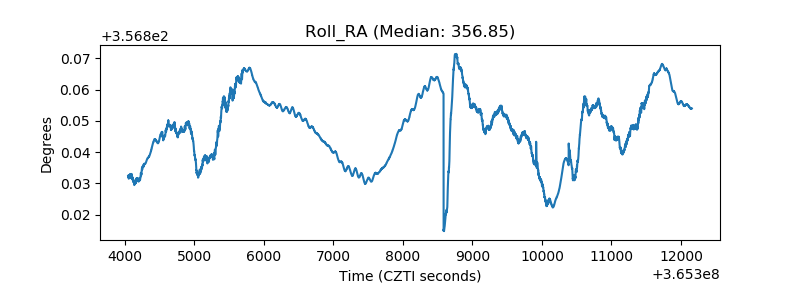 |
| Veto Counter | 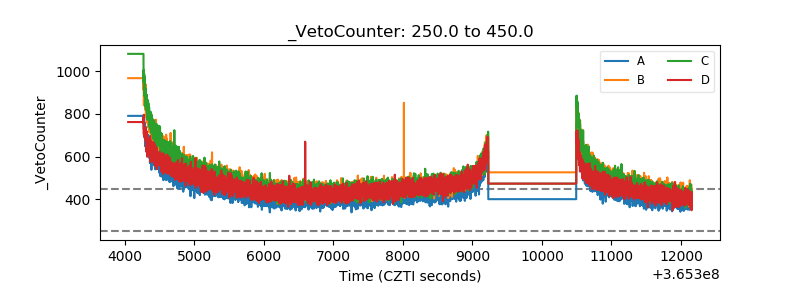 |