| Param | Original file | Final file |
|---|---|---|
| Filename | modeM0/AS1A10_056T01_9000004598_31559cztM0_level2.evt | modeM0/AS1A10_056T01_9000004598_31559cztM0_level2_quad_clean.evt |
| Size (bytes) | 261,676,800 | 60,062,400 |
| Size | 249.6 MB | 57.3 MB |
| Events in quadrant A | 1,618,679 | 407,035 |
| Events in quadrant B | 2,548,868 | 399,402 |
| Events in quadrant C | 1,703,709 | 388,871 |
| Events in quadrant D | 1,824,944 | 386,208 |
| Mode M0 | |||
|---|---|---|---|
| Quadrant | BADHDUFLAG | Total packets | Discarded packets |
| A | 0 | 10063 | 3088 |
| B | 0 | 14924 | 4914 |
| C | 0 | 10181 | 3064 |
| D | 0 | 13304 | 5716 |
| Mode M9 | |||
|---|---|---|---|
| Quadrant | BADHDUFLAG | Total packets | Discarded packets |
| A | 0 | 9 | 3 |
| B | 0 | 14 | 8 |
| C | 0 | 10 | 4 |
| D | 0 | 8 | 2 |
| Mode SS | |||
|---|---|---|---|
| Quadrant | BADHDUFLAG | Total packets | Discarded packets |
| A | 0 | 99 | 27 |
| B | 0 | 99 | 33 |
| C | 0 | 97 | 27 |
| D | 0 | 95 | 21 |
| Quadrant | Total seconds | Saturated seconds | Saturation percentage |
|---|---|---|---|
| A | 3383 | 75 | 2.216967% |
| B | 3284 | 142 | 4.323995% |
| C | 3335 | 129 | 3.868066% |
| D | 3361 | 65 | 1.933948% |
Noise dominated data is calculated using 1-second bins in cleaned event files. If a bin has >2000 counts, and if more than 50% of those come from <1% of pixels, then it is considered to be noise-dominated and hence unusable.
| Quadrant | # 1 sec bins | Bins with >0 counts | Bins with >2000 counts | High rate bins dominated by noise | Noise dominated (total time) | Noise dominated (detector-on time) | Marked lightcurve |
|---|---|---|---|---|---|---|---|
| A | 5050 | 3520 | 0 | 0 | 0.00% | 0.00% | 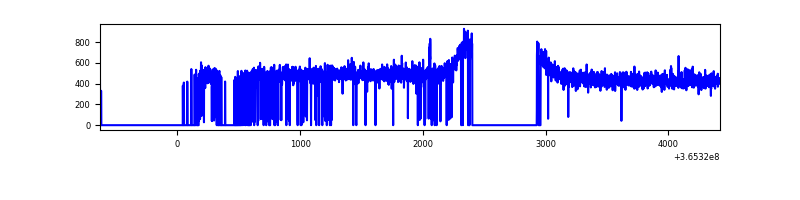 |
| B | 4257 | 3464 | 4 | 4 | 0.09% | 0.12% | 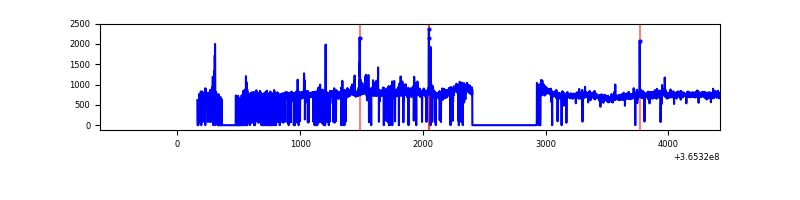 |
| C | 4294 | 3490 | 1 | 1 | 0.02% | 0.03% | 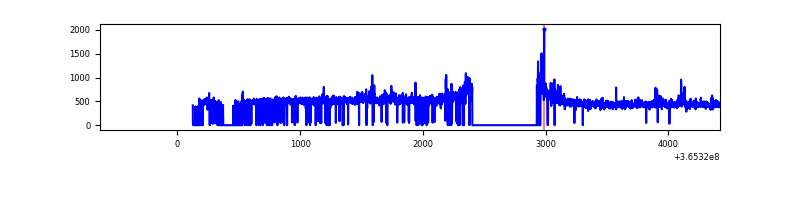 |
| D | 4284 | 3521 | 15 | 15 | 0.35% | 0.43% | 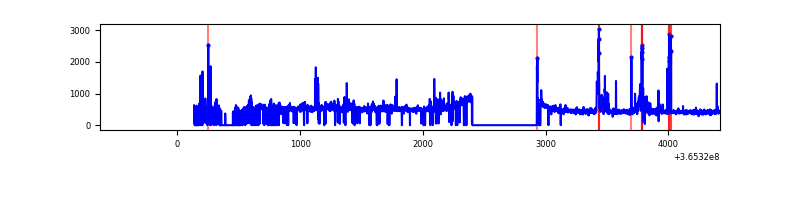 |
Top three noisy pixels from each quadrant. If the there are fewer than three noisy pixels in the level2.evt file, extra rows are filled as -1
| Pixel properties | Quadrant properties | ||||||
|---|---|---|---|---|---|---|---|
| Quadrant | DetID | PixID | Counts | Sigma | Mean | Median | Sigma |
| A | 13 | 254 | 5479 | 59.02 | 418 | 409 | 85.9 |
| A | 3 | 137 | 4494 | 47.55 | 418 | 409 | 85.9 |
| A | 5 | 168 | 3847 | 40.02 | 418 | 409 | 85.9 |
| B | 6 | 159 | 866538 | 10910.61 | 405 | 394 | 79.4 |
| B | 4 | 80 | 55326 | 691.97 | 405 | 394 | 79.4 |
| B | 12 | 1 | 19181 | 236.66 | 405 | 394 | 79.4 |
| C | 14 | 238 | 73530 | 764.5 | 398 | 399 | 95.7 |
| C | 3 | 233 | 46055 | 477.28 | 398 | 399 | 95.7 |
| C | 14 | 254 | 11556 | 116.63 | 398 | 399 | 95.7 |
| D | 12 | 218 | 143046 | 1456.63 | 404 | 392 | 97.9 |
| D | 8 | 195 | 111171 | 1131.16 | 404 | 392 | 97.9 |
| D | 12 | 233 | 22392 | 224.64 | 404 | 392 | 97.9 |
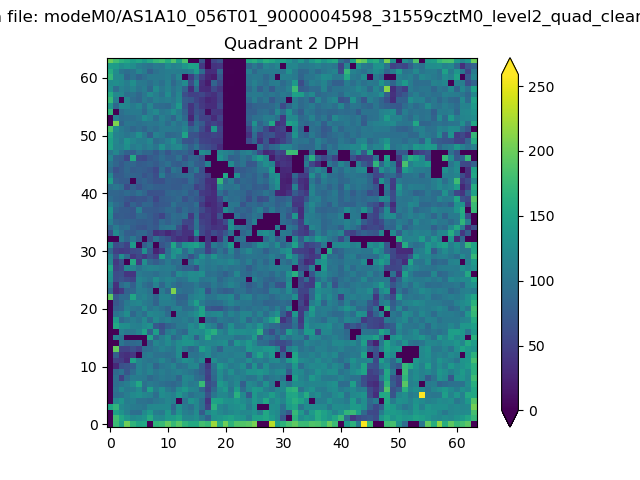
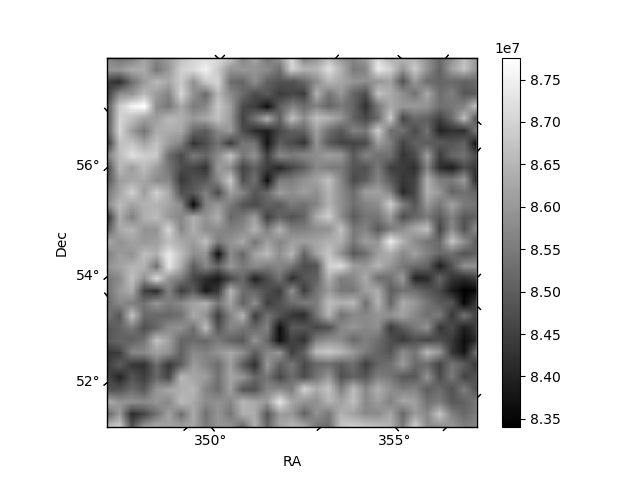
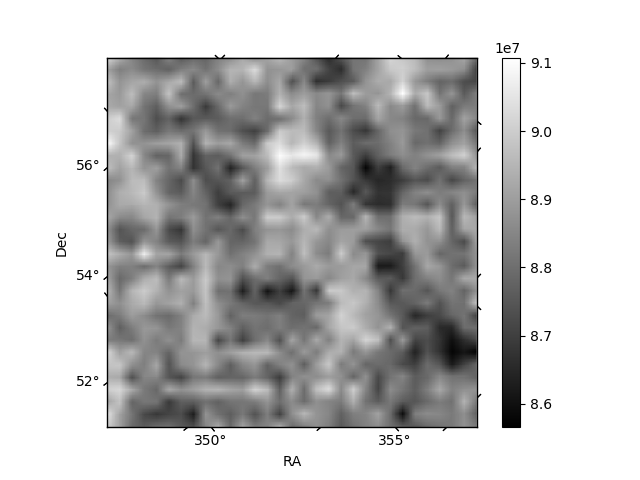
Histogram calculated using DETX and DETY for each event in the final _common_clean file
| Quadrant A | 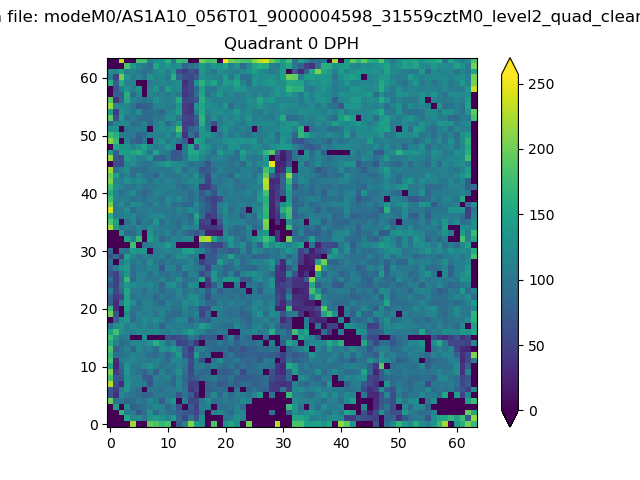 |
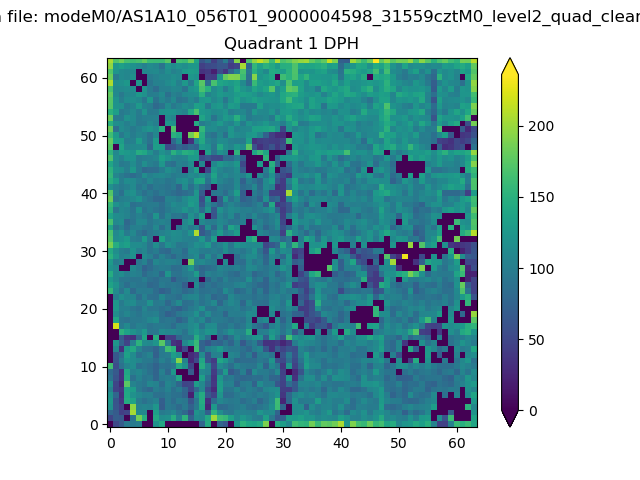 |
Quadrant B |
|---|---|---|---|
| Quadrant D | 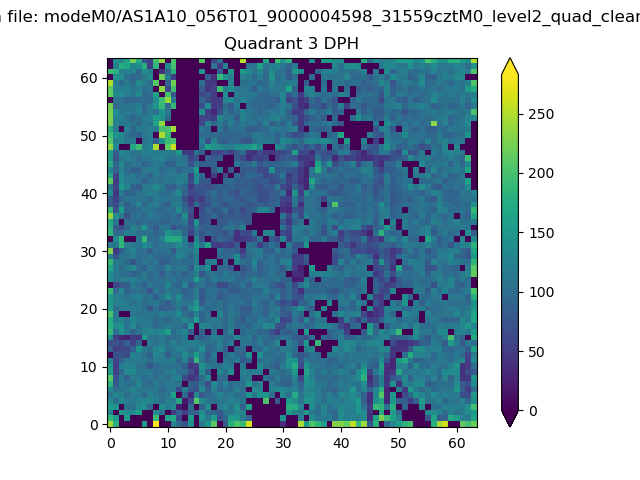 |
 |
Quadrant C |
| Plot type | Count rate plots | Images |
|---|---|---|
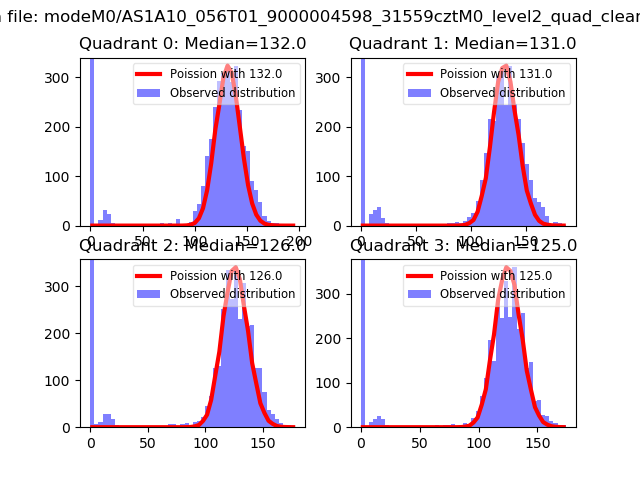
| Comparison with Poisson distribution Blue bars denote a histogram of data divided into 1 sec bins. Red curve is a Poisson curve with rate = median count rate of data. |
 |
 |
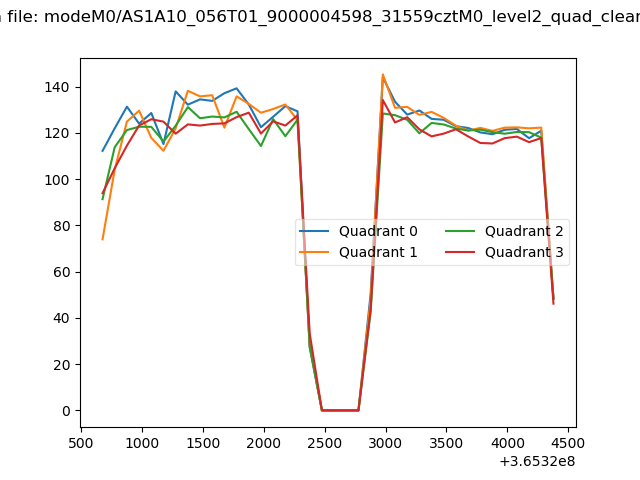
| Quadrant-wise count rates Data is divided into 100 sec bins |
 |
|
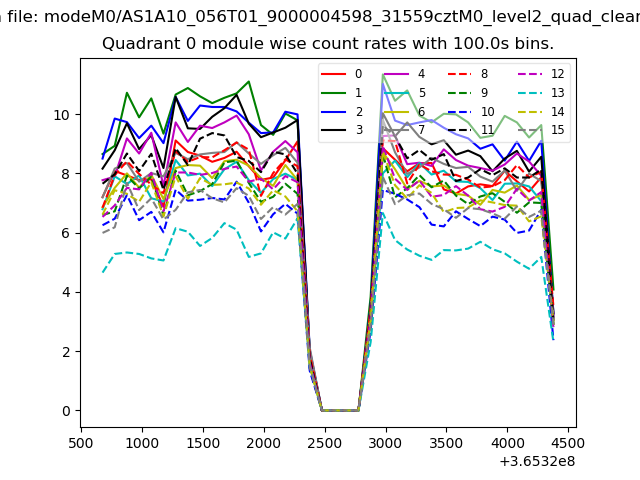
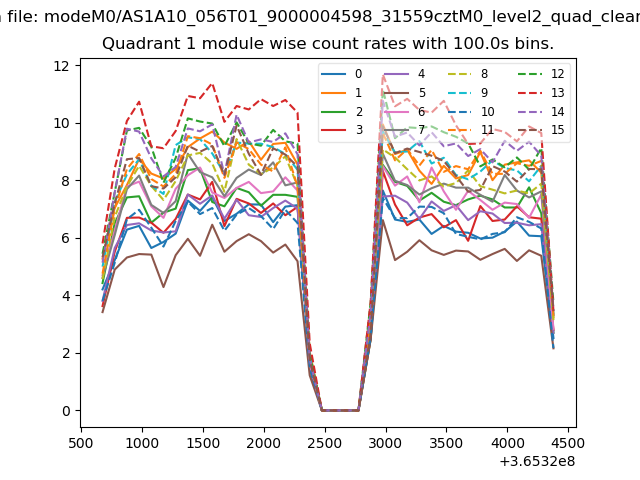
| Module-wise count rates for Quadrant A Data is divided into 100 sec bins |
 |
 |
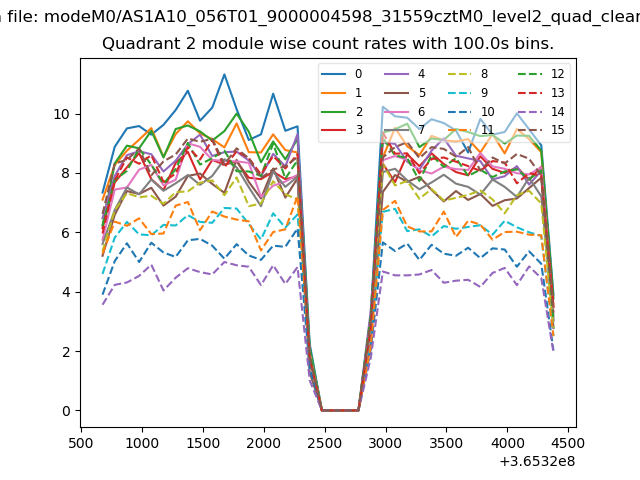
| Module-wise count rates for Quadrant B Data is divided into 100 sec bins |
 |
 |
| Module-wise count rates for Quadrant C Data is divided into 100 sec bins |
 |
 |
| Module-wise count rates for Quadrant D Data is divided into 100 sec bins |
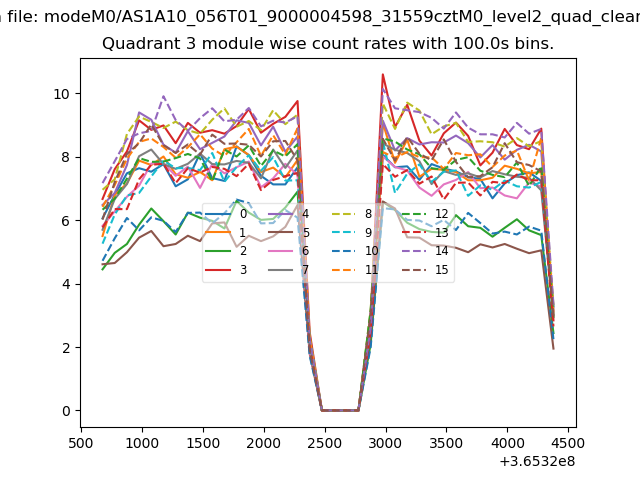 |
 |
| Parameter | Plot |
|---|---|
| CZT HV Monitor | 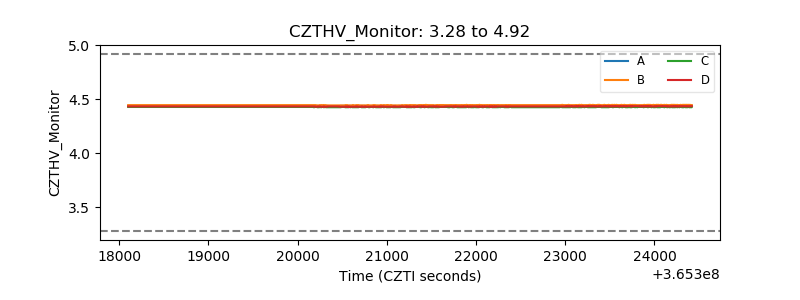 |
| D_VDD |  |
| Temperature 1 | 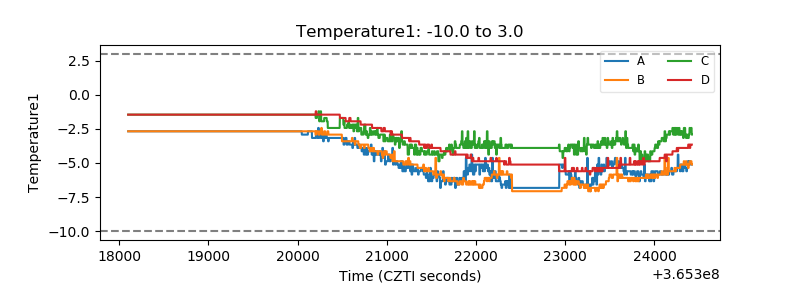 |
| Veto HV Monitor | 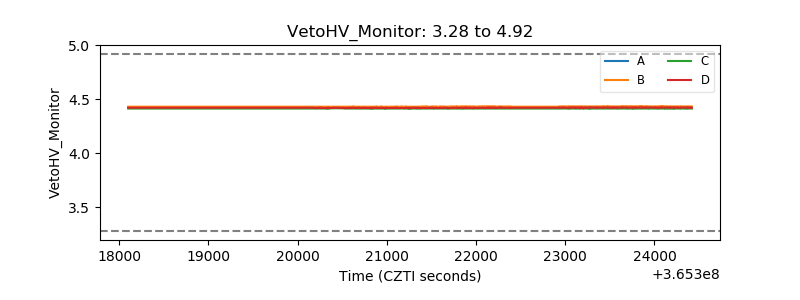 |
| Veto LLD |  |
| Alpha Counter | 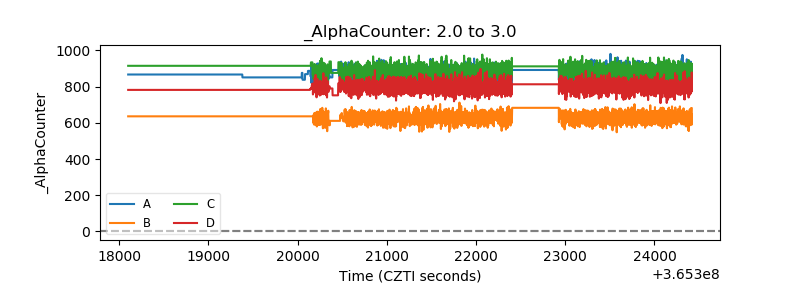 |
| _CPM_Rate | 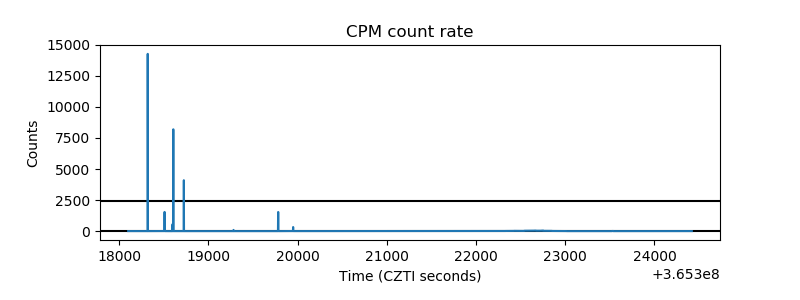 |
| CZT Counter | 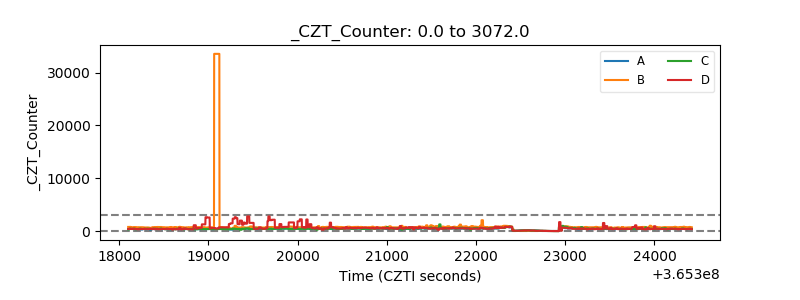 |
| +2.5 Volts monitor |  |
| +5 Volts monitor |  |
| _ROLL_ROT |  |
| _Roll_DEC | 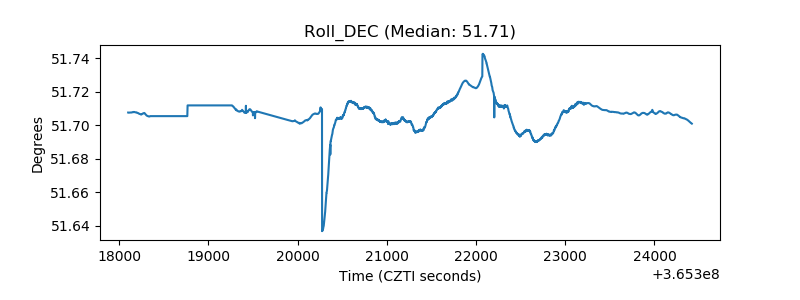 |
| _Roll_RA | 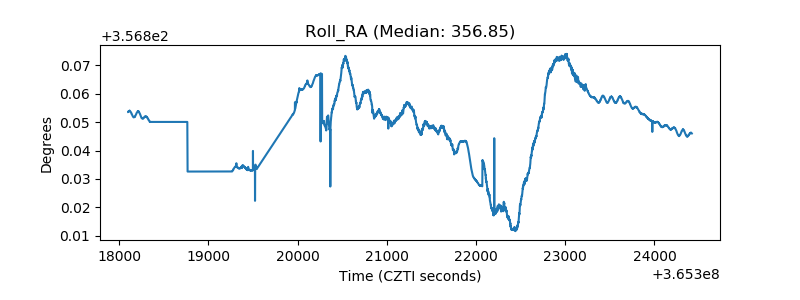 |
| Veto Counter |  |