| Param | Original file | Final file |
|---|---|---|
| Filename | modeM0/AS1A10_056T01_9000004598_31560cztM0_level2.evt | modeM0/AS1A10_056T01_9000004598_31560cztM0_level2_quad_clean.evt |
| Size (bytes) | 528,747,840 | 91,241,280 |
| Size | 504.3 MB | 87.0 MB |
| Events in quadrant A | 3,208,740 | 576,359 |
| Events in quadrant B | 5,308,995 | 582,099 |
| Events in quadrant C | 3,298,686 | 565,315 |
| Events in quadrant D | 3,719,501 | 549,109 |
| Mode M0 | |||
|---|---|---|---|
| Quadrant | BADHDUFLAG | Total packets | Discarded packets |
| A | 0 | 14313 | 1 |
| B | 0 | 21338 | 1 |
| C | 0 | 14415 | 1 |
| D | 0 | 15755 | 1 |
| Mode M9 | |||
|---|---|---|---|
| Quadrant | BADHDUFLAG | Total packets | Discarded packets |
| A | 0 | 3 | 0 |
| B | 0 | 3 | 0 |
| C | 0 | 3 | 0 |
| D | 0 | 3 | 0 |
| Mode SS | |||
|---|---|---|---|
| Quadrant | BADHDUFLAG | Total packets | Discarded packets |
| A | 0 | 142 | 0 |
| B | 0 | 142 | 0 |
| C | 0 | 142 | 0 |
| D | 0 | 142 | 0 |
| Quadrant | Total seconds | Saturated seconds | Saturation percentage |
|---|---|---|---|
| A | 7040 | 85 | 1.207386% |
| B | 7041 | 150 | 2.130379% |
| C | 7041 | 96 | 1.363443% |
| D | 7041 | 106 | 1.505468% |
Noise dominated data is calculated using 1-second bins in cleaned event files. If a bin has >2000 counts, and if more than 50% of those come from <1% of pixels, then it is considered to be noise-dominated and hence unusable.
| Quadrant | # 1 sec bins | Bins with >0 counts | Bins with >2000 counts | High rate bins dominated by noise | Noise dominated (total time) | Noise dominated (detector-on time) | Marked lightcurve |
|---|---|---|---|---|---|---|---|
| A | 7325 | 7041 | 0 | 0 | 0.00% | 0.00% | 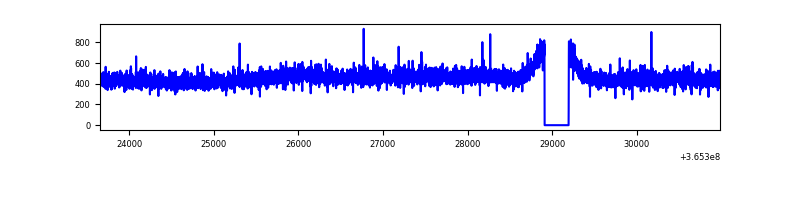 |
| B | 7326 | 7041 | 2 | 2 | 0.03% | 0.03% | 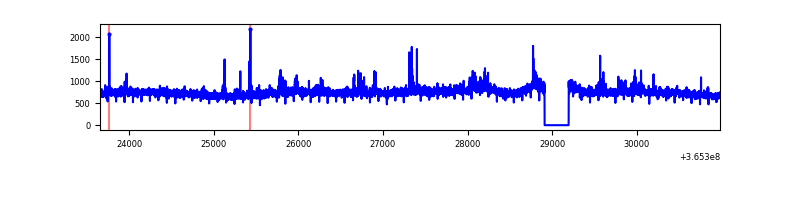 |
| C | 7326 | 7041 | 0 | 0 | 0.00% | 0.00% | 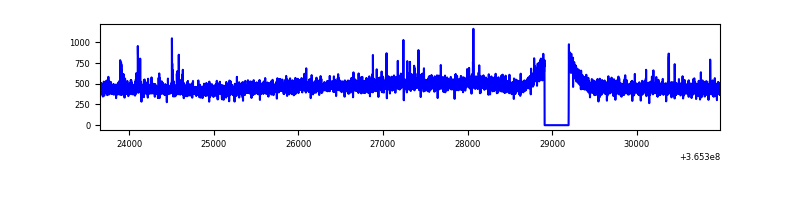 |
| D | 7326 | 7041 | 61 | 61 | 0.83% | 0.87% | 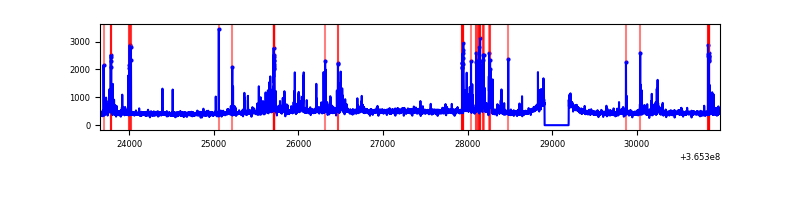 |
Top three noisy pixels from each quadrant. If the there are fewer than three noisy pixels in the level2.evt file, extra rows are filled as -1
| Pixel properties | Quadrant properties | ||||||
|---|---|---|---|---|---|---|---|
| Quadrant | DetID | PixID | Counts | Sigma | Mean | Median | Sigma |
| A | 13 | 254 | 10676 | 57.97 | 832 | 814 | 170.1 |
| A | 3 | 137 | 8799 | 46.93 | 832 | 814 | 170.1 |
| A | 0 | 226 | 6935 | 35.98 | 832 | 814 | 170.1 |
| B | 6 | 159 | 1894547 | 11803.93 | 824 | 802 | 160.4 |
| B | 4 | 80 | 135430 | 839.15 | 824 | 802 | 160.4 |
| B | 0 | 190 | 23946 | 144.26 | 824 | 802 | 160.4 |
| C | 14 | 238 | 136211 | 724.53 | 795 | 799 | 186.9 |
| C | 2 | 114 | 16149 | 82.13 | 795 | 799 | 186.9 |
| C | 14 | 254 | 12411 | 62.13 | 795 | 799 | 186.9 |
| D | 12 | 218 | 352252 | 1850.36 | 798 | 774 | 190.0 |
| D | 8 | 195 | 212436 | 1114.29 | 798 | 774 | 190.0 |
| D | 12 | 233 | 53840 | 279.37 | 798 | 774 | 190.0 |
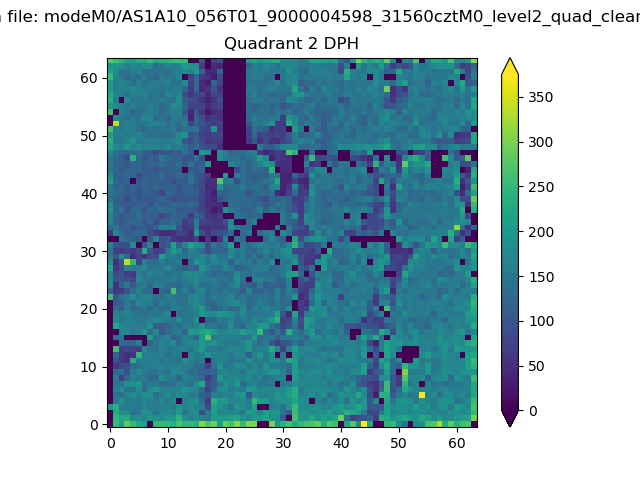
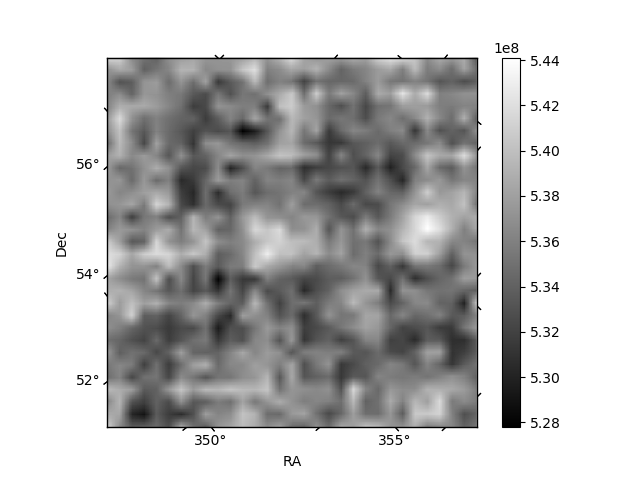
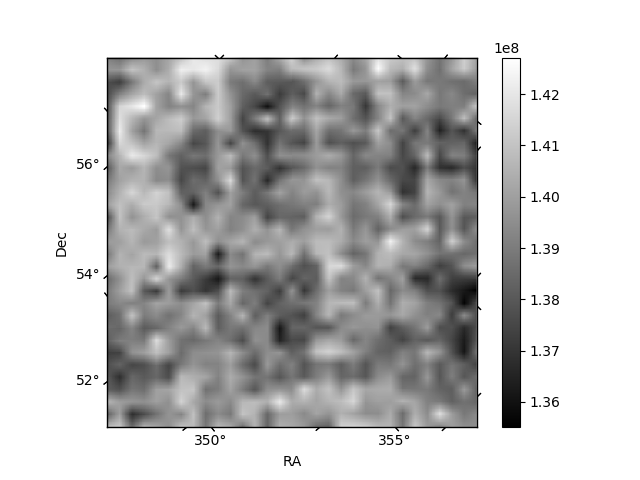
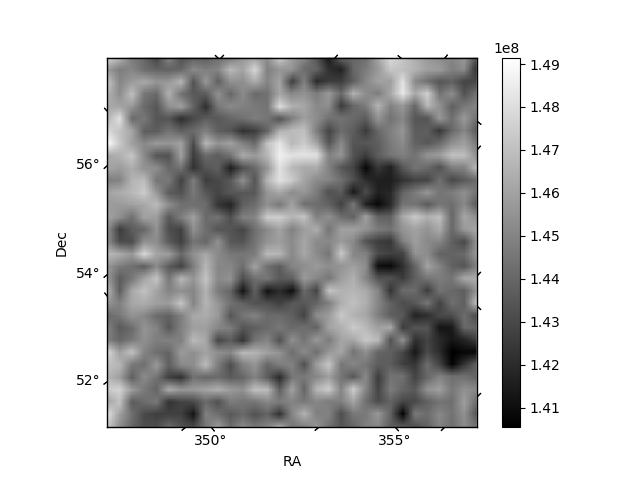
Histogram calculated using DETX and DETY for each event in the final _common_clean file
| Quadrant A | 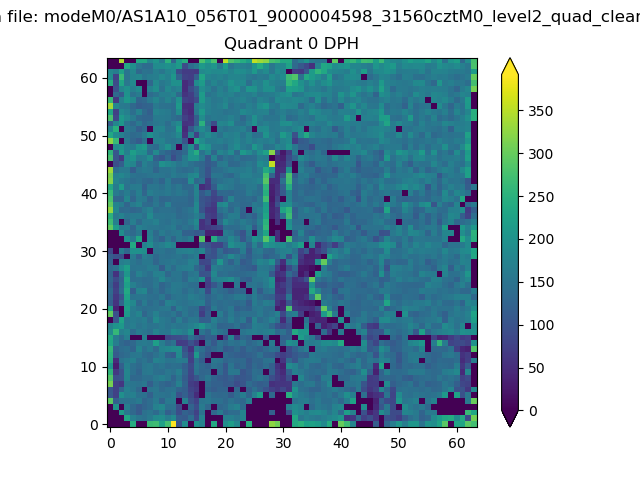 |
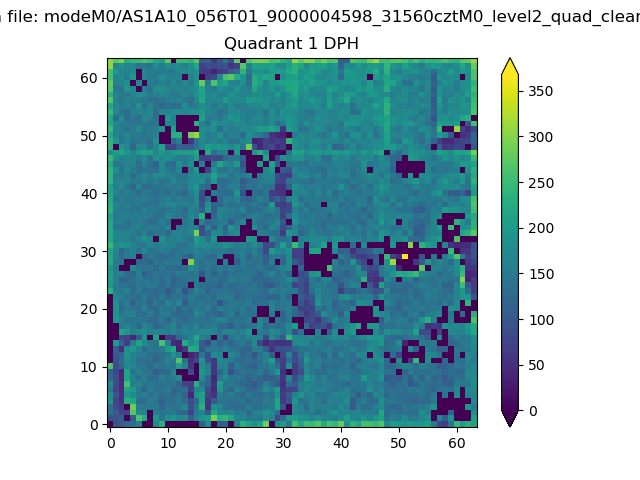 |
Quadrant B |
|---|---|---|---|
| Quadrant D | 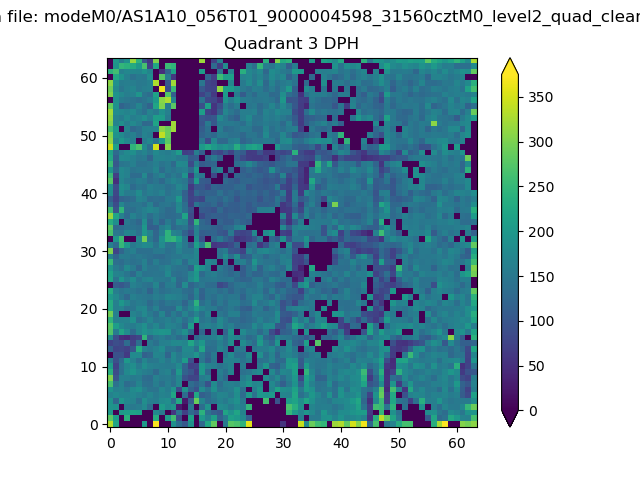 |
 |
Quadrant C |
| Plot type | Count rate plots | Images |
|---|---|---|
| Comparison with Poisson distribution Blue bars denote a histogram of data divided into 1 sec bins. Red curve is a Poisson curve with rate = median count rate of data. |
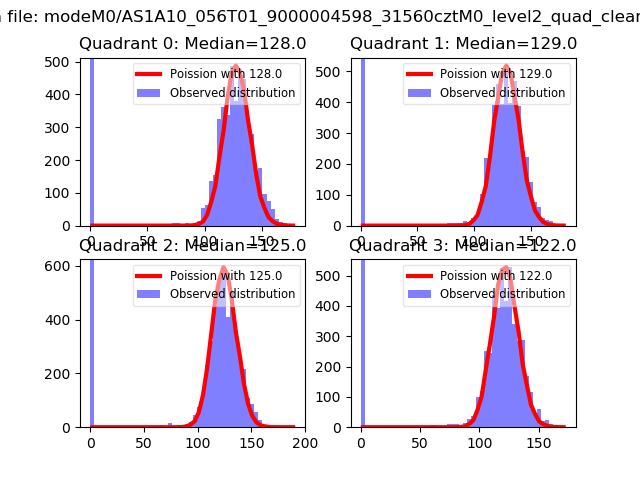 |
 |
| Quadrant-wise count rates Data is divided into 100 sec bins |
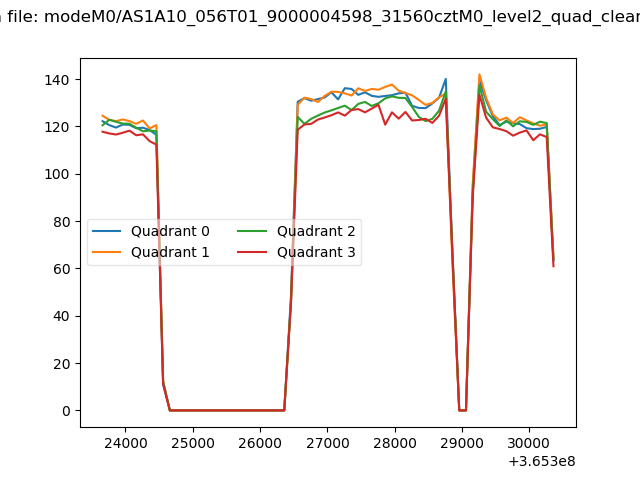 |
|
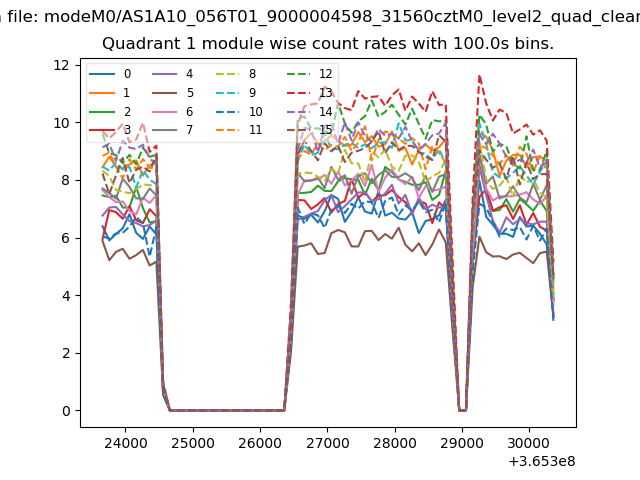
| Module-wise count rates for Quadrant A Data is divided into 100 sec bins |
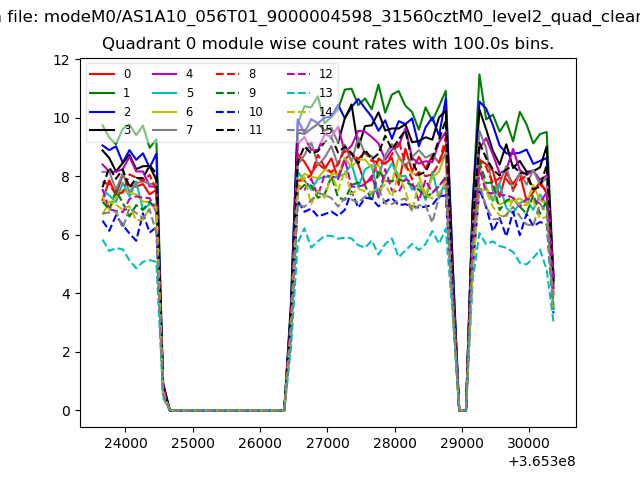 |
 |
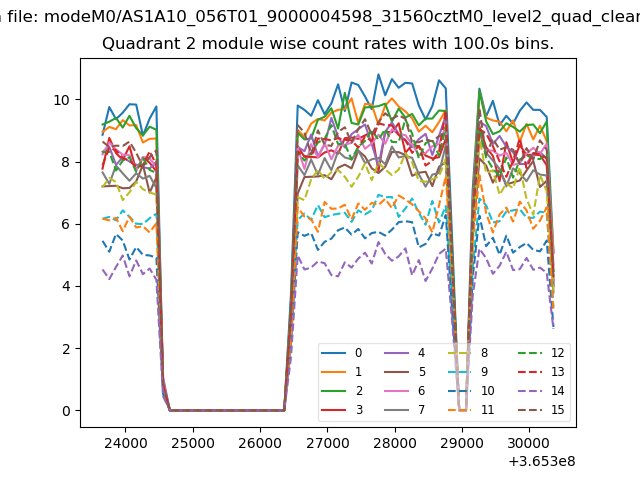
| Module-wise count rates for Quadrant B Data is divided into 100 sec bins |
 |
 |
| Module-wise count rates for Quadrant C Data is divided into 100 sec bins |
 |
 |
| Module-wise count rates for Quadrant D Data is divided into 100 sec bins |
 |
 |
| Parameter | Plot |
|---|---|
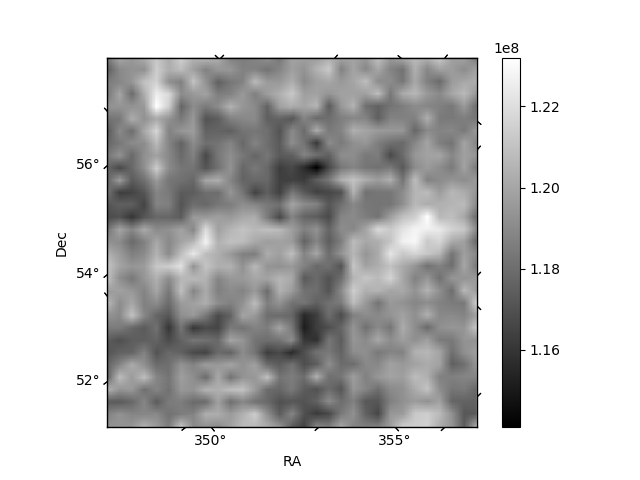
| CZT HV Monitor |  |
| D_VDD | 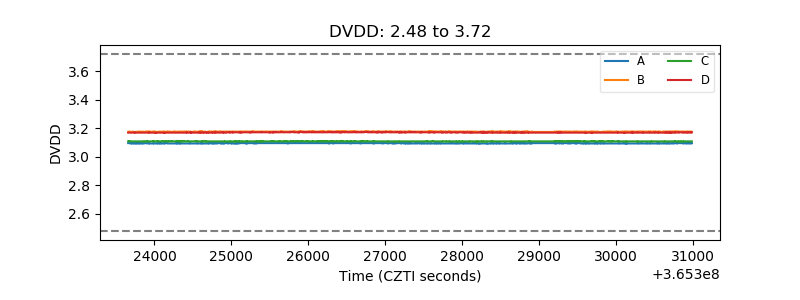 |
| Temperature 1 | 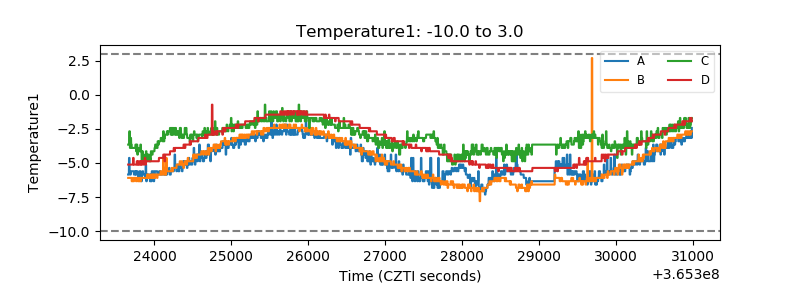 |
| Veto HV Monitor | 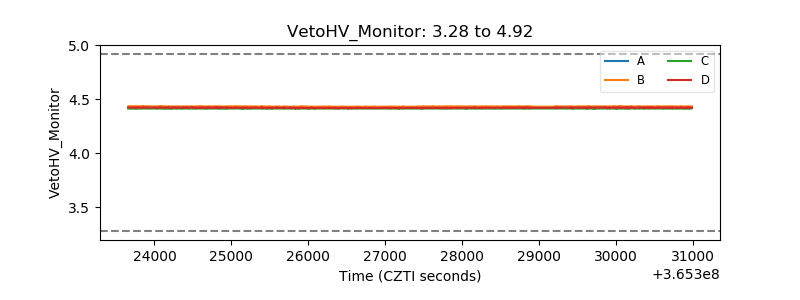 |
| Veto LLD | 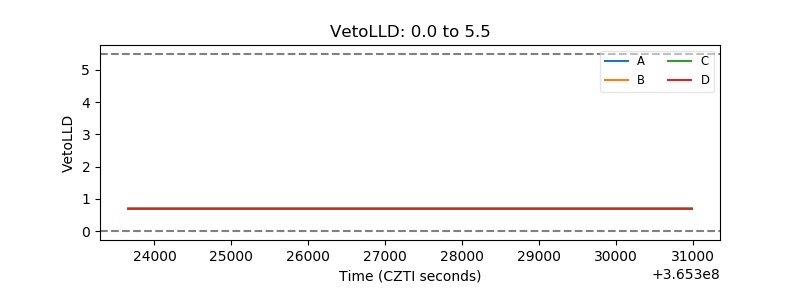 |
| Alpha Counter | 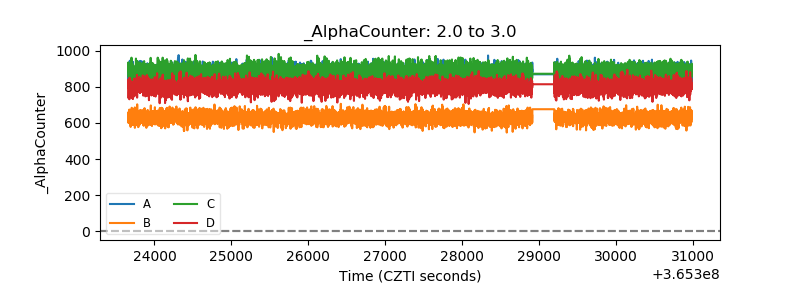 |
| _CPM_Rate | 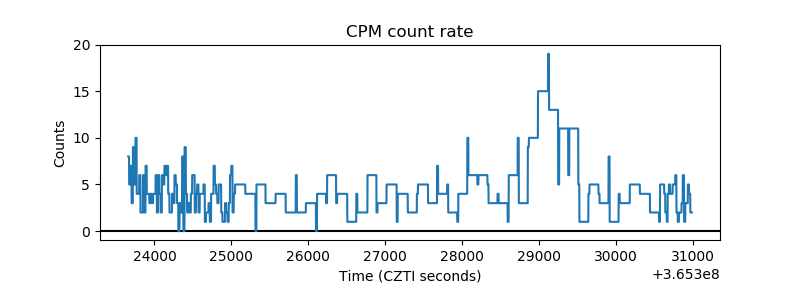 |
| CZT Counter | 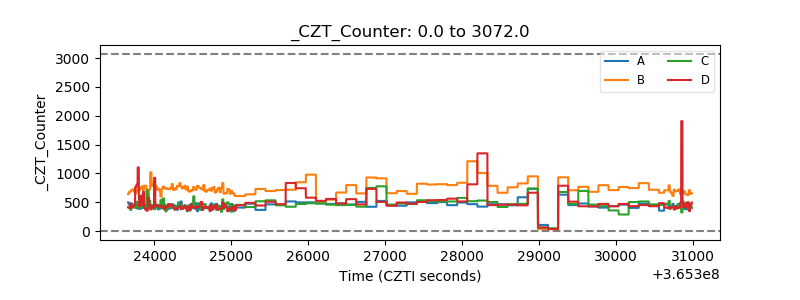 |
| +2.5 Volts monitor |  |
| +5 Volts monitor |  |
| _ROLL_ROT |  |
| _Roll_DEC | 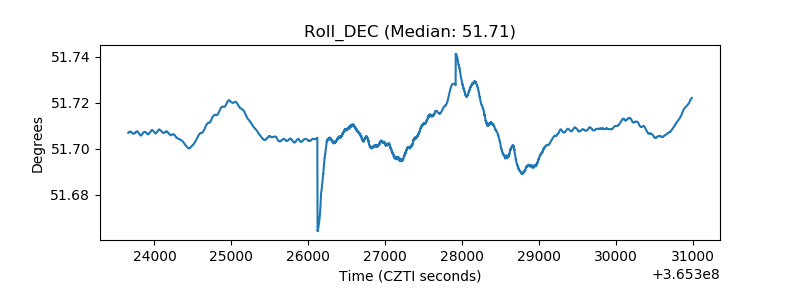 |
| _Roll_RA | 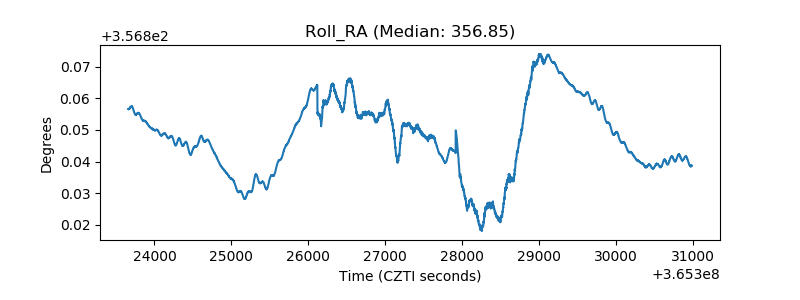 |
| Veto Counter |  |