| Param | Original file | Final file |
|---|---|---|
| Filename | modeM0/AS1A10_056T01_9000004598_31561cztM0_level2.evt | modeM0/AS1A10_056T01_9000004598_31561cztM0_level2_quad_clean.evt |
| Size (bytes) | 1,071,400,320 | 176,904,000 |
| Size | 1021.8 MB | 168.7 MB |
| Events in quadrant A | 6,243,816 | 1,124,872 |
| Events in quadrant B | 10,326,905 | 1,128,690 |
| Events in quadrant C | 6,468,696 | 1,094,205 |
| Events in quadrant D | 8,493,962 | 1,074,992 |
| Mode M0 | |||
|---|---|---|---|
| Quadrant | BADHDUFLAG | Total packets | Discarded packets |
| A | 0 | 27602 | 2 |
| B | 0 | 41259 | 2 |
| C | 0 | 28014 | 2 |
| D | 0 | 34258 | 2 |
| Mode M9 | |||
|---|---|---|---|
| Quadrant | BADHDUFLAG | Total packets | Discarded packets |
| A | 0 | 9 | 0 |
| B | 0 | 9 | 0 |
| C | 0 | 9 | 0 |
| D | 0 | 9 | 0 |
| Mode SS | |||
|---|---|---|---|
| Quadrant | BADHDUFLAG | Total packets | Discarded packets |
| A | 0 | 274 | 0 |
| B | 0 | 274 | 0 |
| C | 0 | 274 | 0 |
| D | 0 | 274 | 0 |
| Quadrant | Total seconds | Saturated seconds | Saturation percentage |
|---|---|---|---|
| A | 13542 | 218 | 1.609807% |
| B | 13543 | 355 | 2.621280% |
| C | 13544 | 291 | 2.148553% |
| D | 13544 | 564 | 4.164206% |
Noise dominated data is calculated using 1-second bins in cleaned event files. If a bin has >2000 counts, and if more than 50% of those come from <1% of pixels, then it is considered to be noise-dominated and hence unusable.
| Quadrant | # 1 sec bins | Bins with >0 counts | Bins with >2000 counts | High rate bins dominated by noise | Noise dominated (total time) | Noise dominated (detector-on time) | Marked lightcurve |
|---|---|---|---|---|---|---|---|
| A | 19249 | 13543 | 0 | 0 | 0.00% | 0.00% | 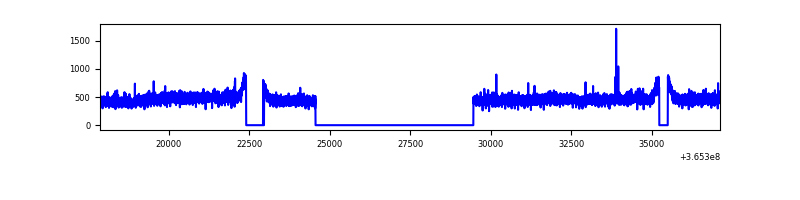 |
| B | 19250 | 13545 | 19 | 19 | 0.10% | 0.14% | 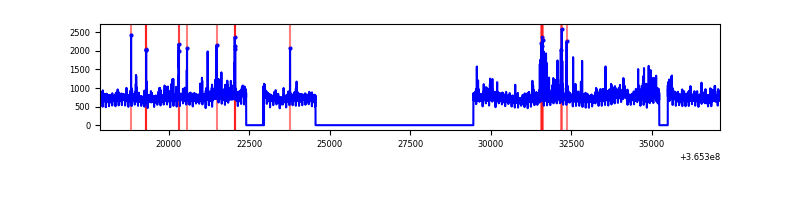 |
| C | 19250 | 13546 | 4 | 4 | 0.02% | 0.03% | 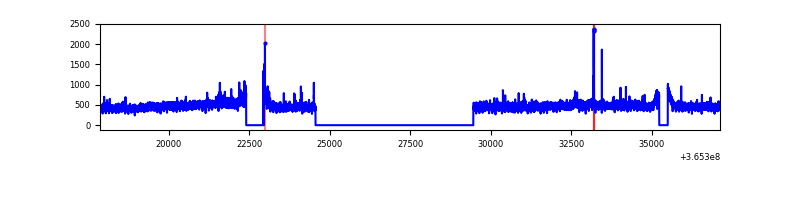 |
| D | 19250 | 13546 | 405 | 405 | 2.10% | 2.99% | 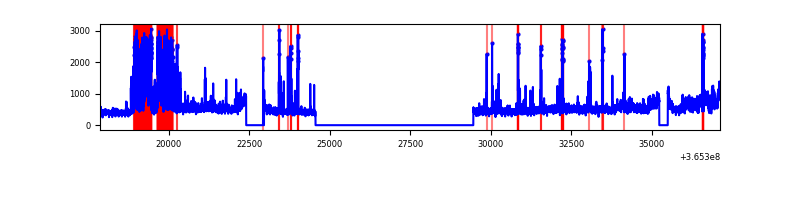 |
Top three noisy pixels from each quadrant. If the there are fewer than three noisy pixels in the level2.evt file, extra rows are filled as -1
| Pixel properties | Quadrant properties | ||||||
|---|---|---|---|---|---|---|---|
| Quadrant | DetID | PixID | Counts | Sigma | Mean | Median | Sigma |
| A | 13 | 254 | 21925 | 62.51 | 1615 | 1581 | 325.5 |
| A | 3 | 137 | 17142 | 47.81 | 1615 | 1581 | 325.5 |
| A | 0 | 226 | 13559 | 36.8 | 1615 | 1581 | 325.5 |
| B | 6 | 159 | 3612281 | 11753.5 | 1596 | 1553 | 307.2 |
| B | 4 | 80 | 292284 | 946.38 | 1596 | 1553 | 307.2 |
| B | 12 | 1 | 75602 | 241.04 | 1596 | 1553 | 307.2 |
| C | 14 | 238 | 258135 | 709.03 | 1538 | 1544 | 361.9 |
| C | 3 | 233 | 96272 | 261.76 | 1538 | 1544 | 361.9 |
| C | 10 | 22 | 32863 | 86.54 | 1538 | 1544 | 361.9 |
| D | 12 | 218 | 1461181 | 3995.4 | 1540 | 1495 | 365.3 |
| D | 8 | 195 | 922806 | 2521.78 | 1540 | 1495 | 365.3 |
| D | 2 | 250 | 108022 | 291.58 | 1540 | 1495 | 365.3 |
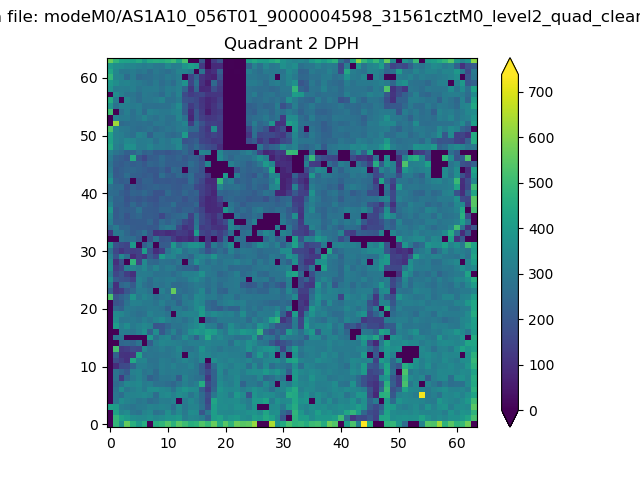
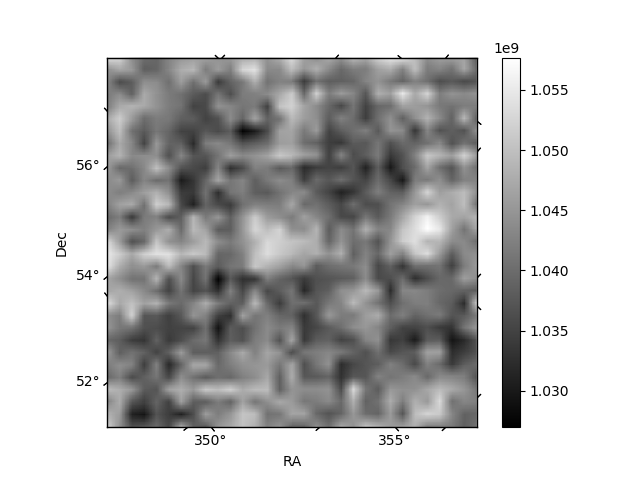
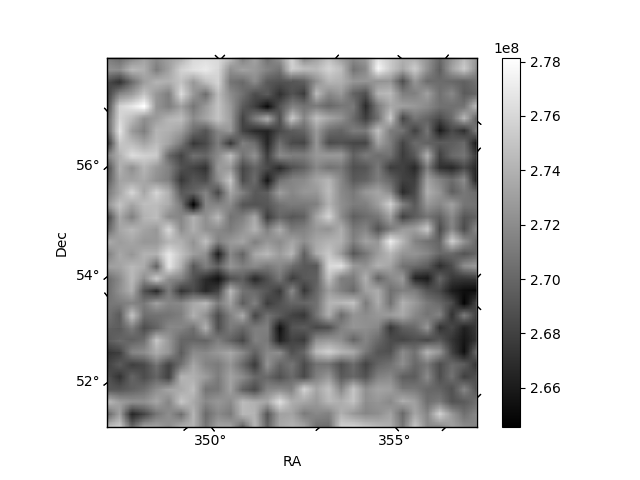
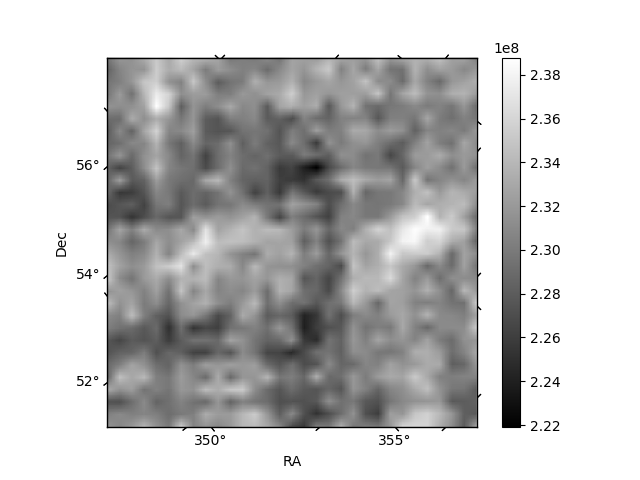
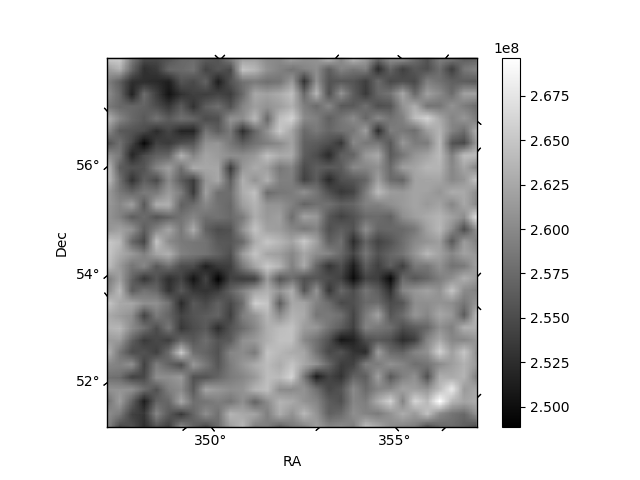
Histogram calculated using DETX and DETY for each event in the final _common_clean file
| Quadrant A | 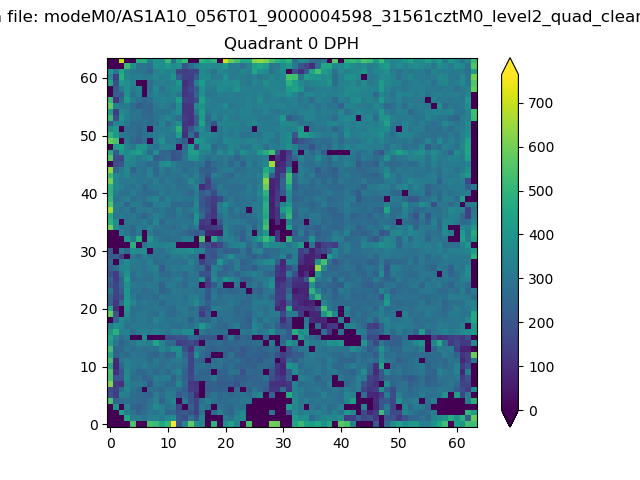 |
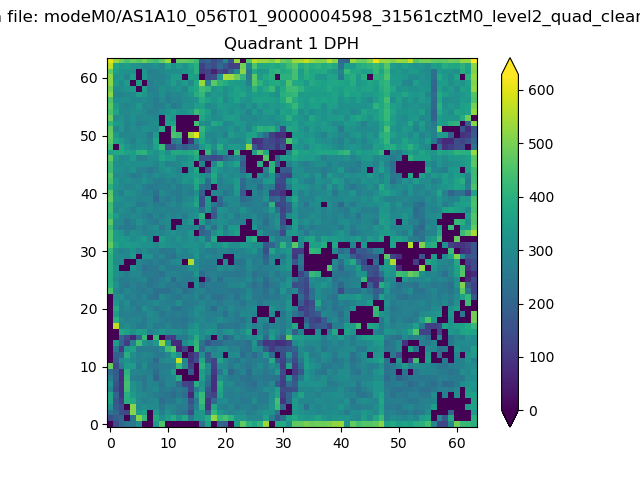 |
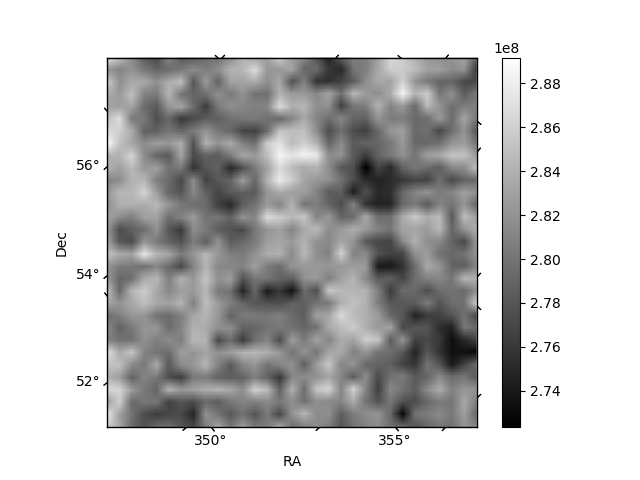
Quadrant B |
|---|---|---|---|
| Quadrant D | 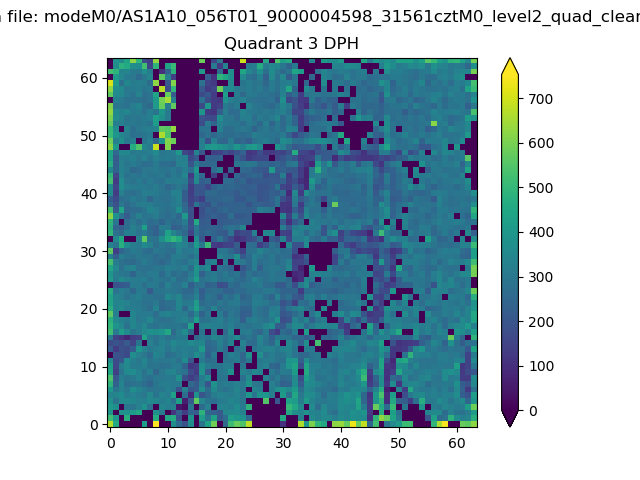 |
 |
Quadrant C |
| Plot type | Count rate plots | Images |
|---|---|---|
| Comparison with Poisson distribution Blue bars denote a histogram of data divided into 1 sec bins. Red curve is a Poisson curve with rate = median count rate of data. |
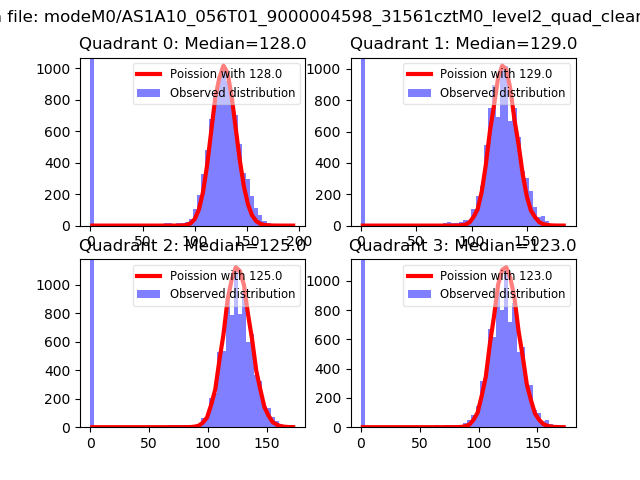 |
 |
| Quadrant-wise count rates Data is divided into 100 sec bins |
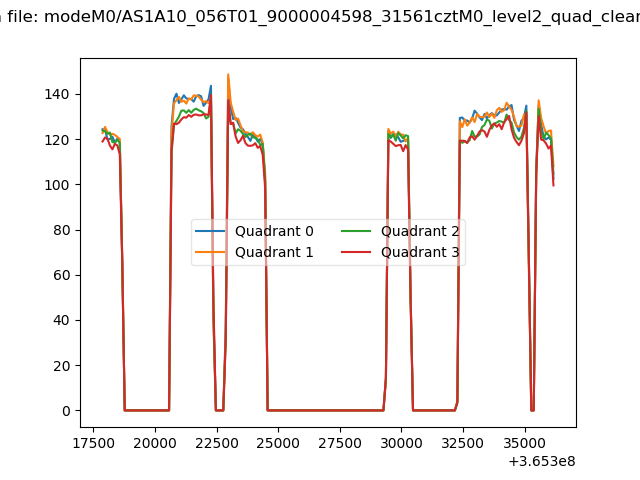 |
|
| Module-wise count rates for Quadrant A Data is divided into 100 sec bins |
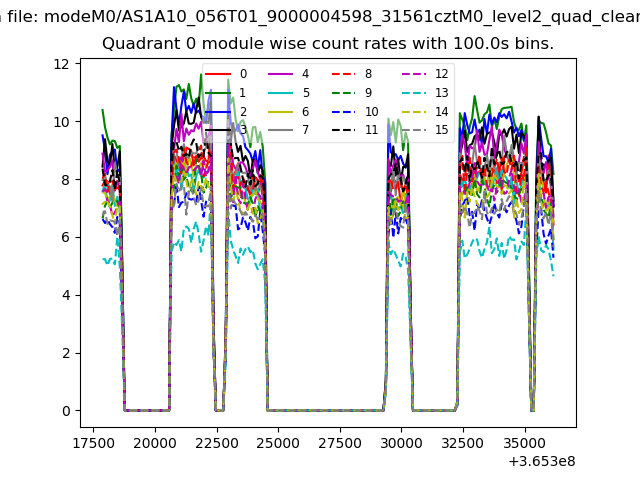 |
 |
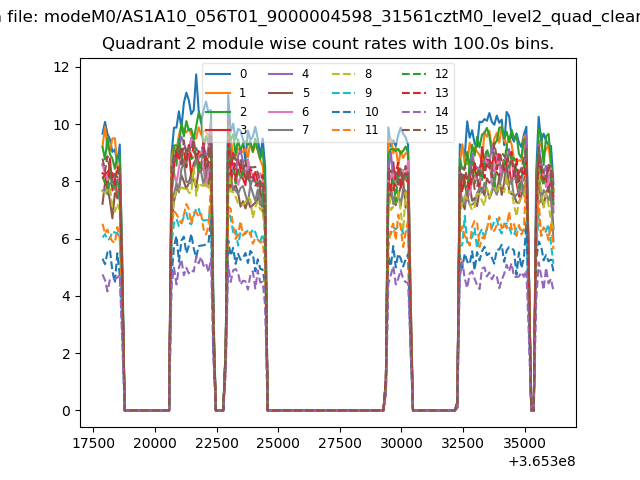
| Module-wise count rates for Quadrant B Data is divided into 100 sec bins |
 |
 |
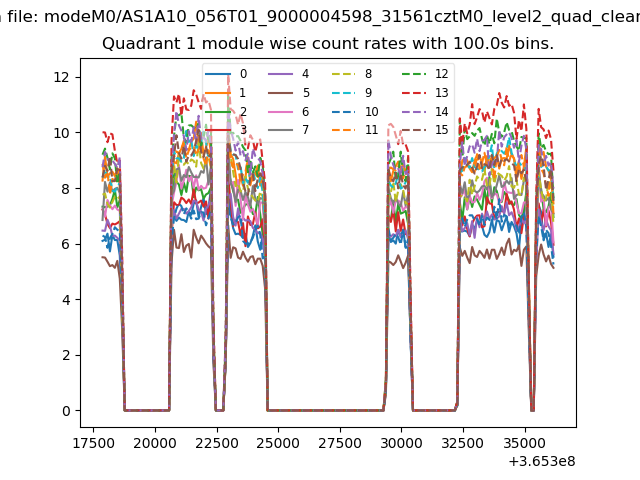
| Module-wise count rates for Quadrant C Data is divided into 100 sec bins |
 |
 |
| Module-wise count rates for Quadrant D Data is divided into 100 sec bins |
 |
 |
| Parameter | Plot |
|---|---|
| CZT HV Monitor | 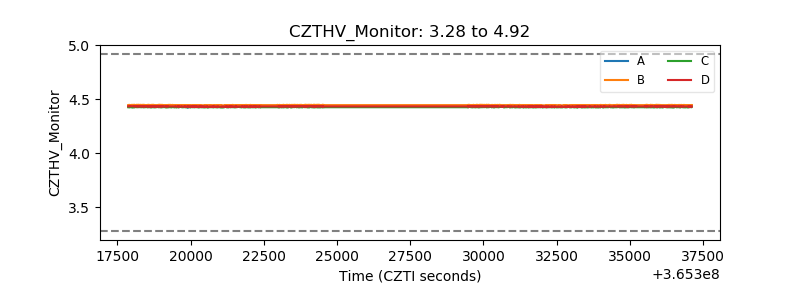 |
| D_VDD | 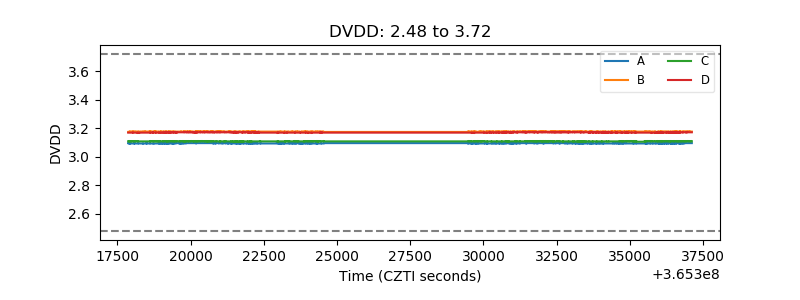 |
| Temperature 1 |  |
| Veto HV Monitor | 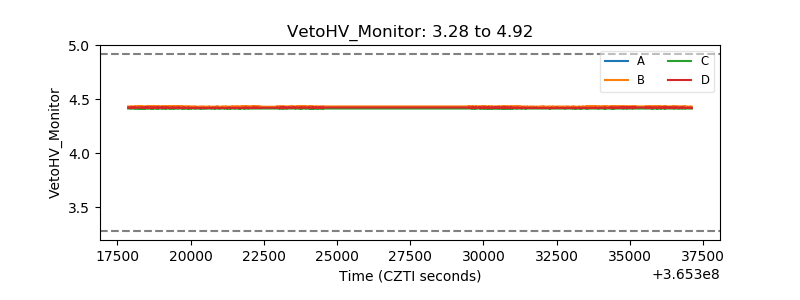 |
| Veto LLD | 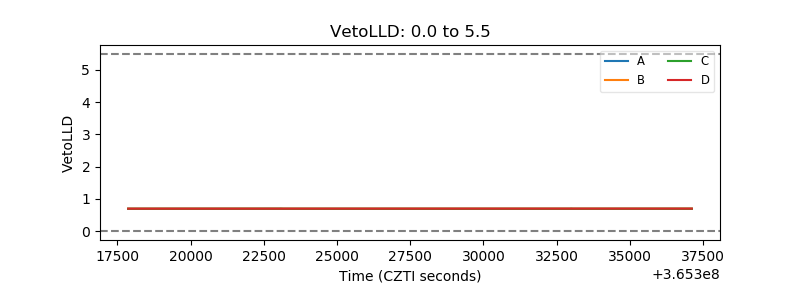 |
| Alpha Counter | 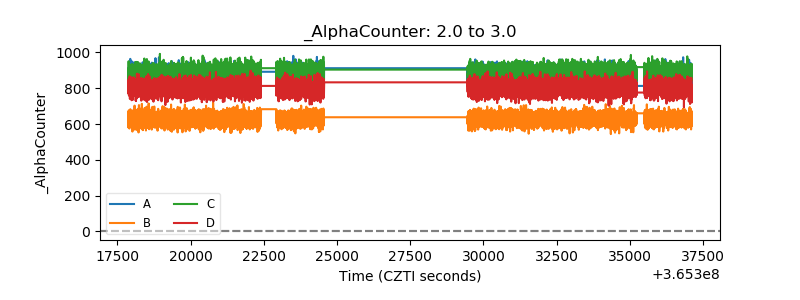 |
| _CPM_Rate | 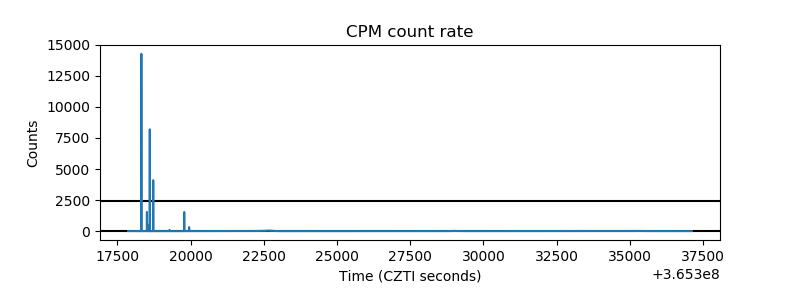 |
| CZT Counter | 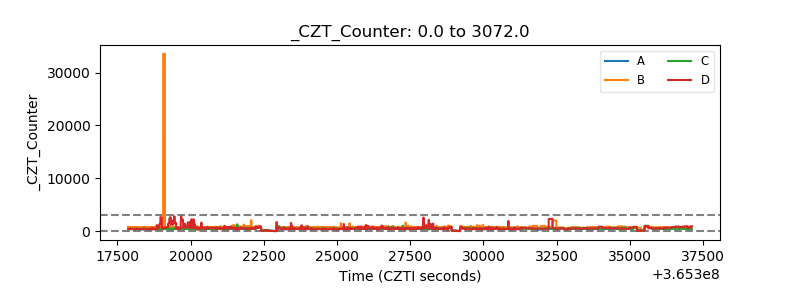 |
| +2.5 Volts monitor |  |
| +5 Volts monitor |  |
| _ROLL_ROT | 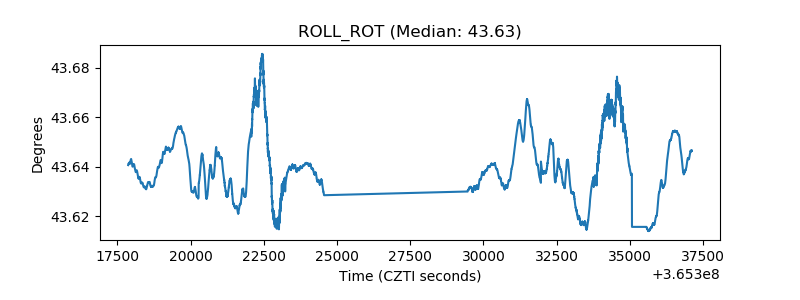 |
| _Roll_DEC |  |
| _Roll_RA | 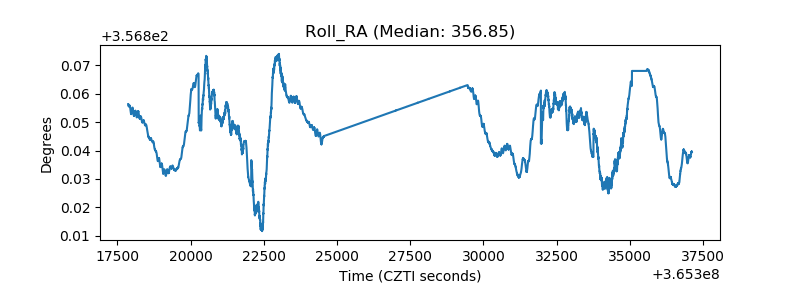 |
| Veto Counter |  |