| Param | Original file | Final file |
|---|---|---|
| Filename | modeM0/AS1A10_056T01_9000004598_31564cztM0_level2.evt | modeM0/AS1A10_056T01_9000004598_31564cztM0_level2_quad_clean.evt |
| Size (bytes) | 1,495,166,400 | 232,220,160 |
| Size | 1.4 GB | 221.5 MB |
| Events in quadrant A | 8,646,287 | 1,471,379 |
| Events in quadrant B | 14,475,036 | 1,468,127 |
| Events in quadrant C | 8,983,990 | 1,414,853 |
| Events in quadrant D | 11,921,237 | 1,396,590 |
| Mode M0 | |||
|---|---|---|---|
| Quadrant | BADHDUFLAG | Total packets | Discarded packets |
| A | 0 | 37956 | 4 |
| B | 0 | 57138 | 5 |
| C | 0 | 38495 | 4 |
| D | 0 | 47817 | 4 |
| Mode M9 | |||
|---|---|---|---|
| Quadrant | BADHDUFLAG | Total packets | Discarded packets |
| A | 0 | 21 | 0 |
| B | 0 | 21 | 0 |
| C | 0 | 21 | 0 |
| D | 0 | 21 | 0 |
| Mode SS | |||
|---|---|---|---|
| Quadrant | BADHDUFLAG | Total packets | Discarded packets |
| A | 0 | 382 | 0 |
| B | 0 | 382 | 0 |
| C | 0 | 382 | 0 |
| D | 0 | 382 | 0 |
| Quadrant | Total seconds | Saturated seconds | Saturation percentage |
|---|---|---|---|
| A | 18601 | 241 | 1.295629% |
| B | 18601 | 503 | 2.704156% |
| C | 18601 | 361 | 1.940756% |
| D | 18601 | 387 | 2.080533% |
Noise dominated data is calculated using 1-second bins in cleaned event files. If a bin has >2000 counts, and if more than 50% of those come from <1% of pixels, then it is considered to be noise-dominated and hence unusable.
| Quadrant | # 1 sec bins | Bins with >0 counts | Bins with >2000 counts | High rate bins dominated by noise | Noise dominated (total time) | Noise dominated (detector-on time) | Marked lightcurve |
|---|---|---|---|---|---|---|---|
| A | 20766 | 18601 | 0 | 0 | 0.00% | 0.00% | 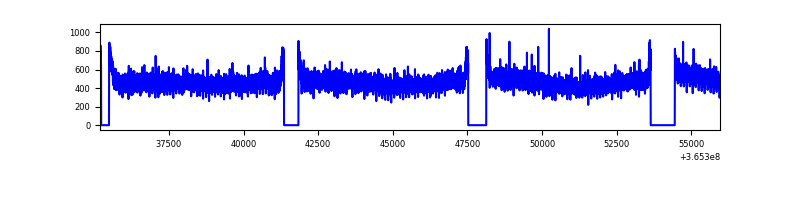 |
| B | 20766 | 18601 | 52 | 52 | 0.25% | 0.28% | 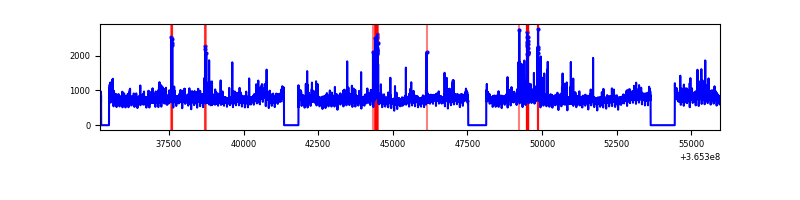 |
| C | 20766 | 18601 | 0 | 0 | 0.00% | 0.00% | 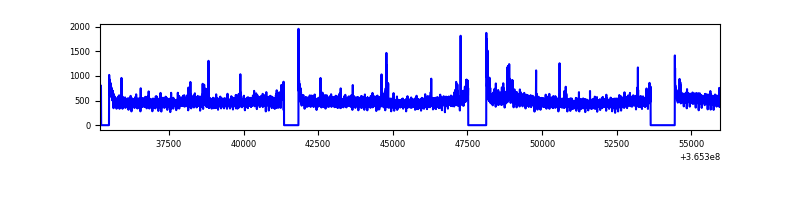 |
| D | 20766 | 18602 | 129 | 129 | 0.62% | 0.69% | 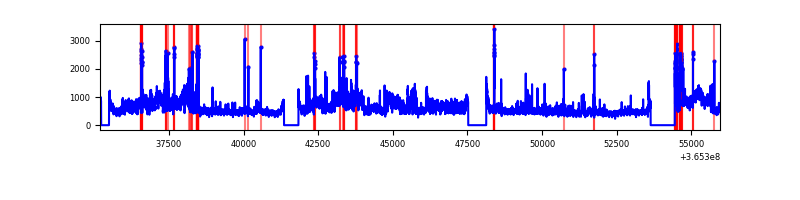 |
Top three noisy pixels from each quadrant. If the there are fewer than three noisy pixels in the level2.evt file, extra rows are filled as -1
| Pixel properties | Quadrant properties | ||||||
|---|---|---|---|---|---|---|---|
| Quadrant | DetID | PixID | Counts | Sigma | Mean | Median | Sigma |
| A | 13 | 254 | 34868 | 73.31 | 2240 | 2192 | 445.7 |
| A | 3 | 137 | 23680 | 48.21 | 2240 | 2192 | 445.7 |
| A | 0 | 226 | 18638 | 36.9 | 2240 | 2192 | 445.7 |
| B | 6 | 159 | 5012553 | 11773.96 | 2212 | 2152 | 425.5 |
| B | 4 | 80 | 299748 | 699.32 | 2212 | 2152 | 425.5 |
| B | 0 | 190 | 159088 | 368.78 | 2212 | 2152 | 425.5 |
| C | 14 | 238 | 342302 | 677.64 | 2137 | 2143 | 502.0 |
| C | 3 | 233 | 170727 | 335.84 | 2137 | 2143 | 502.0 |
| C | 4 | 175 | 50788 | 96.91 | 2137 | 2143 | 502.0 |
| D | 8 | 195 | 2719948 | 5322.55 | 2153 | 2088 | 510.6 |
| D | 7 | 223 | 476080 | 928.25 | 2153 | 2088 | 510.6 |
| D | 12 | 218 | 195843 | 379.44 | 2153 | 2088 | 510.6 |
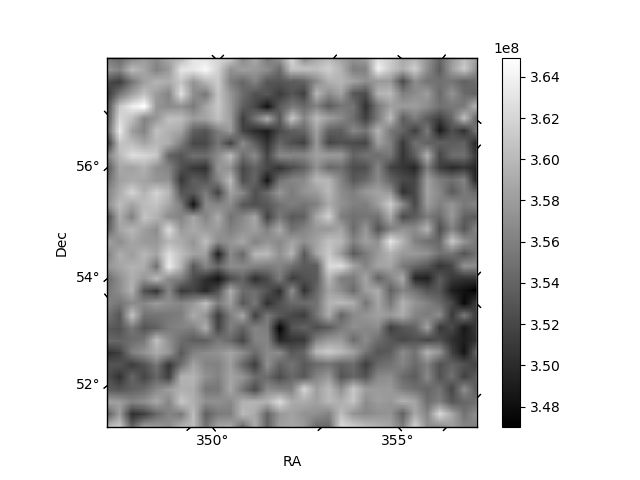
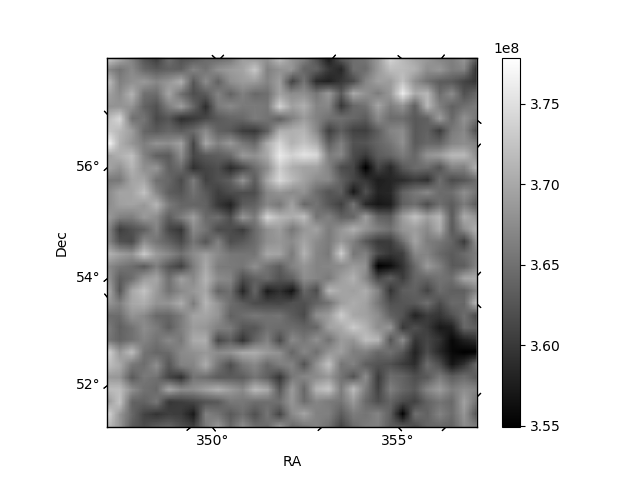
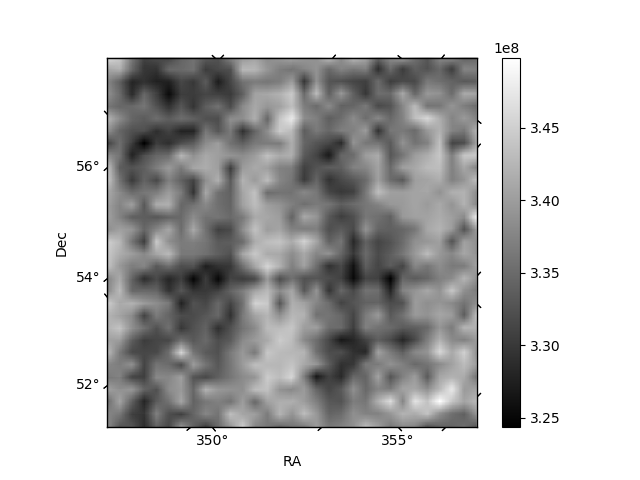
Histogram calculated using DETX and DETY for each event in the final _common_clean file
| Quadrant A | 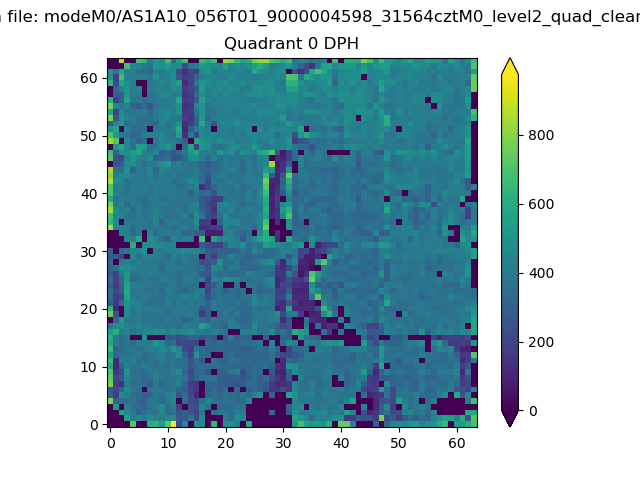 |
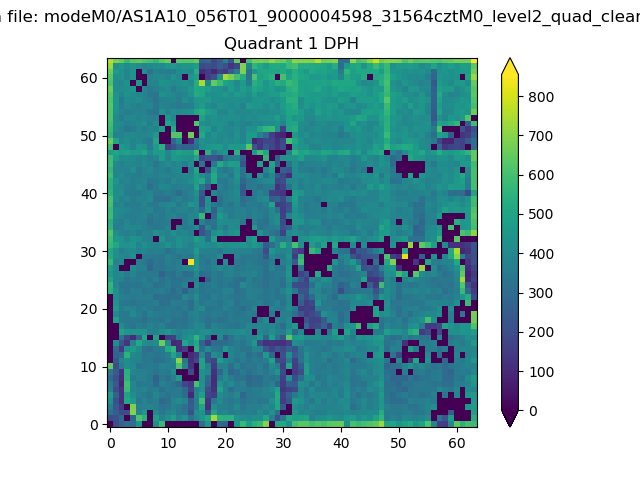 |
Quadrant B |
|---|---|---|---|
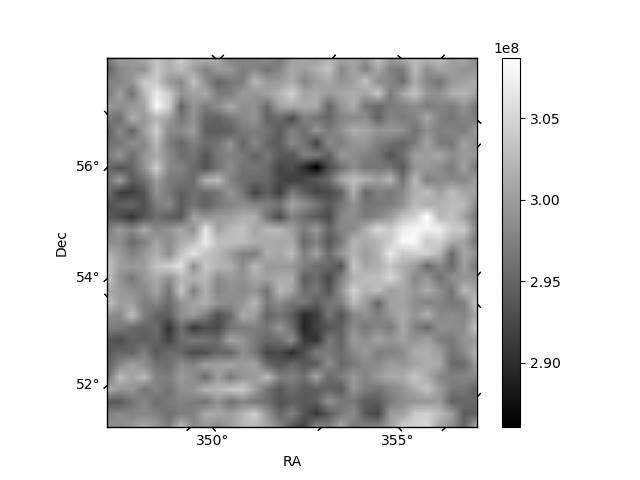
| Quadrant D | 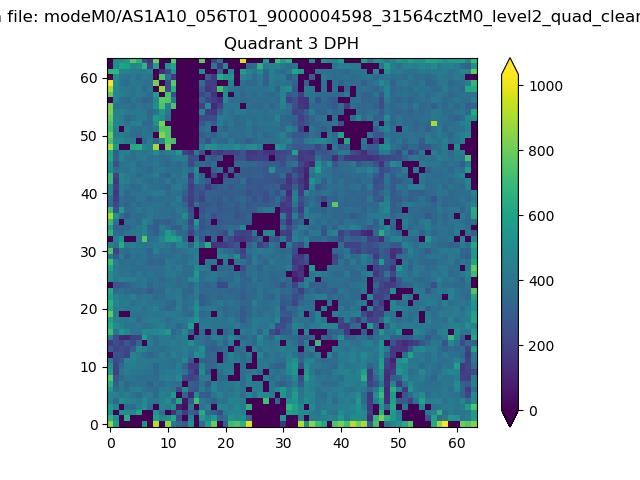 |
 |
Quadrant C |
| Plot type | Count rate plots | Images |
|---|---|---|
| Comparison with Poisson distribution Blue bars denote a histogram of data divided into 1 sec bins. Red curve is a Poisson curve with rate = median count rate of data. |
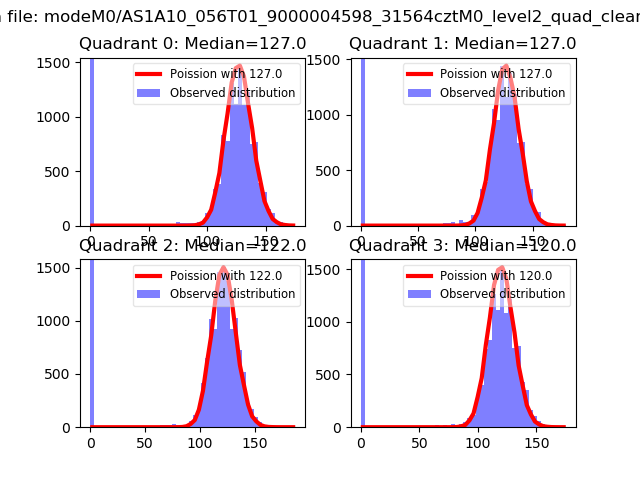 |
 |
| Quadrant-wise count rates Data is divided into 100 sec bins |
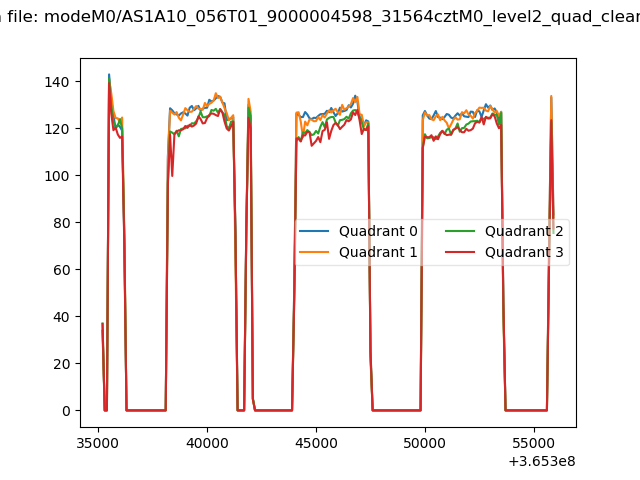 |
|
| Module-wise count rates for Quadrant A Data is divided into 100 sec bins |
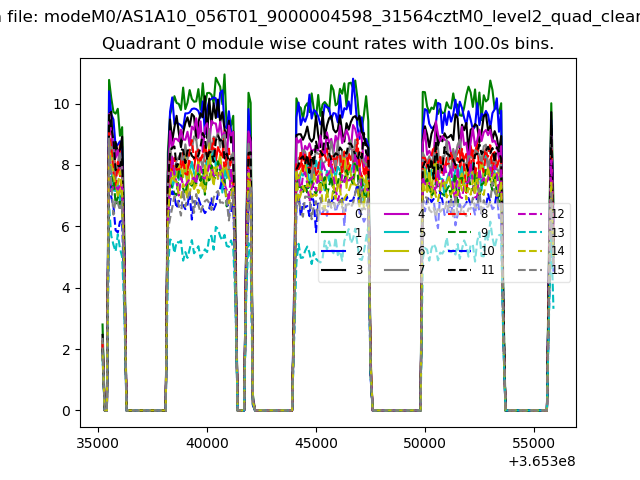 |
 |
| Module-wise count rates for Quadrant B Data is divided into 100 sec bins |
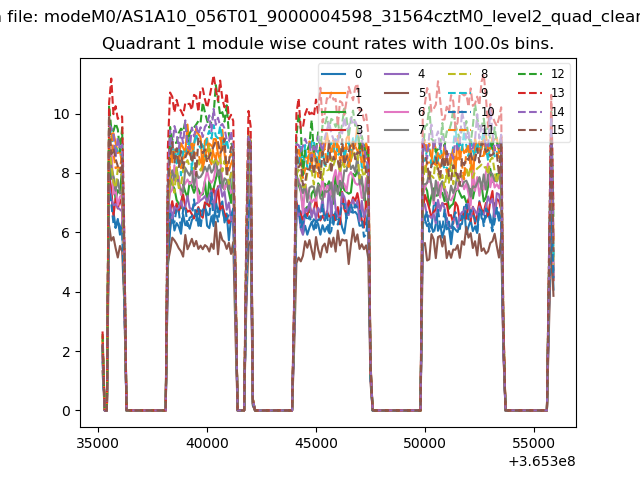 |
 |
| Module-wise count rates for Quadrant C Data is divided into 100 sec bins |
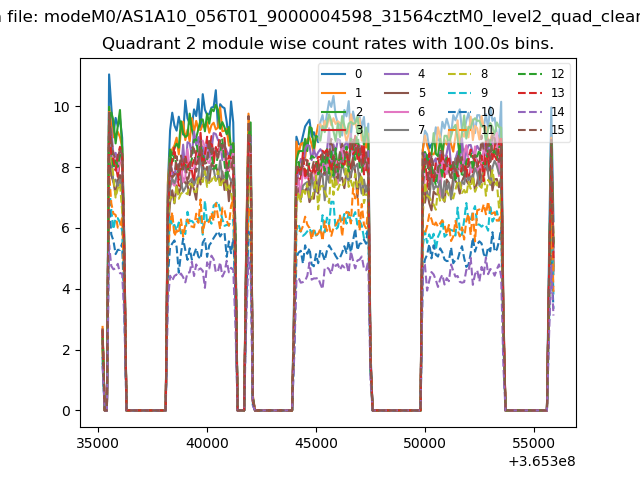 |
 |
| Module-wise count rates for Quadrant D Data is divided into 100 sec bins |
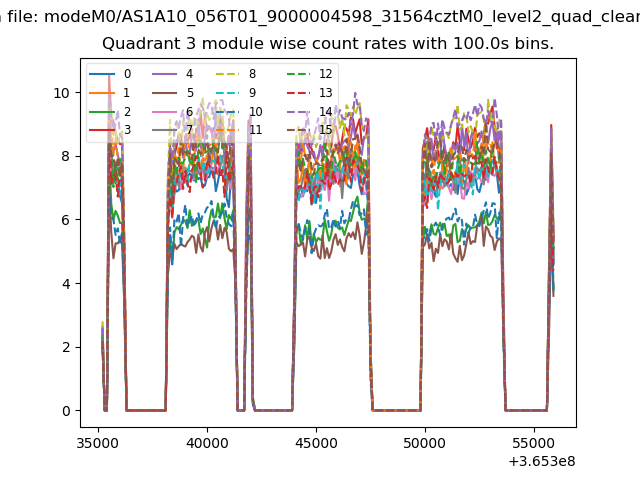 |
 |
| Parameter | Plot |
|---|---|
| CZT HV Monitor | 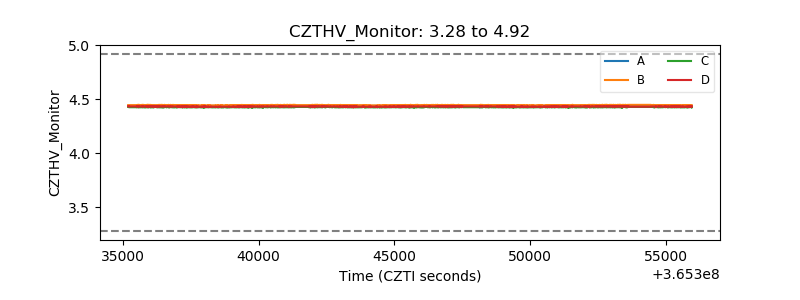 |
| D_VDD | 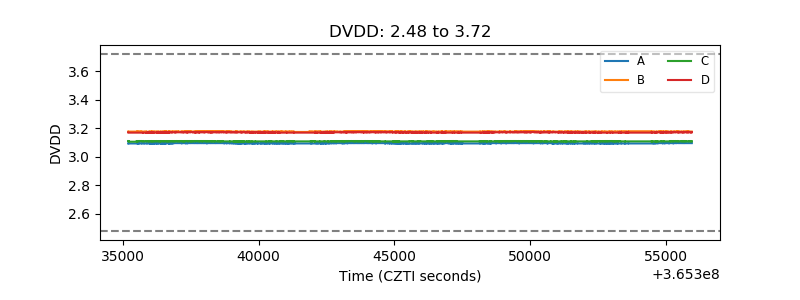 |
| Temperature 1 | 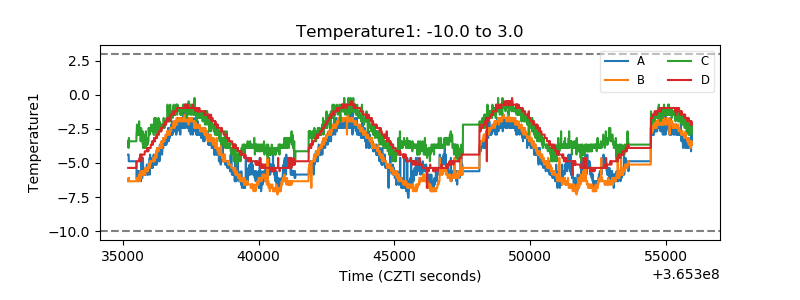 |
| Veto HV Monitor | 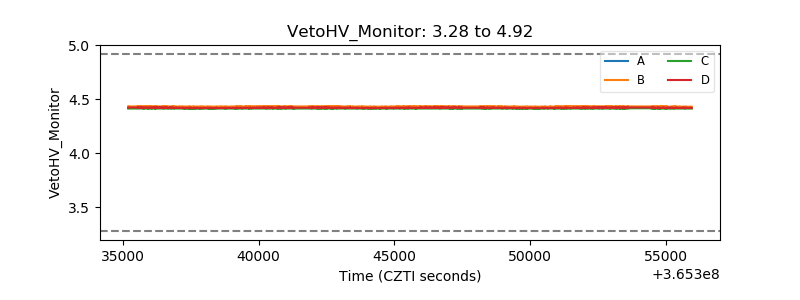 |
| Veto LLD | 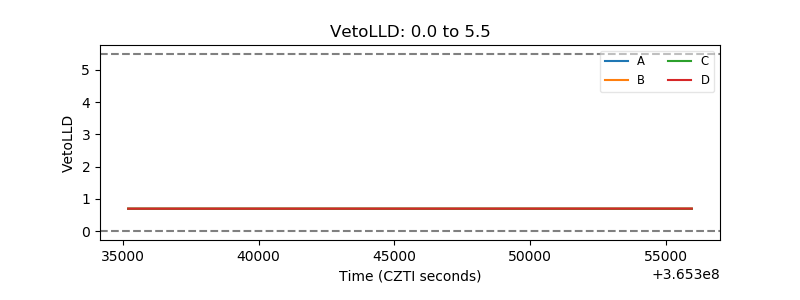 |
| Alpha Counter | 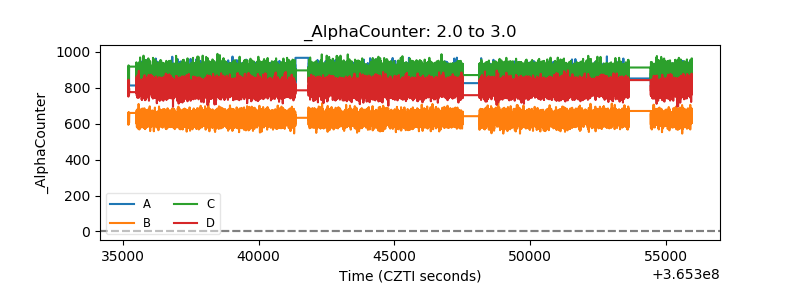 |
| _CPM_Rate | 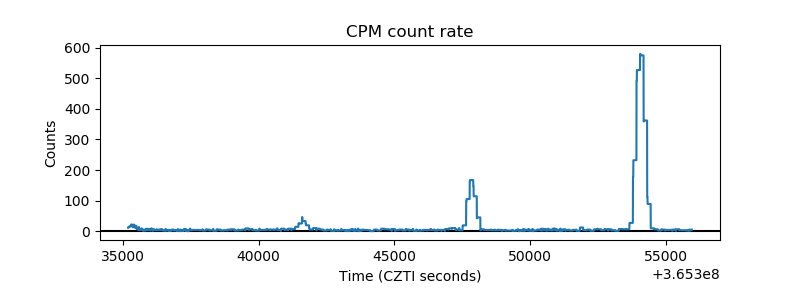 |
| CZT Counter |  |
| +2.5 Volts monitor |  |
| +5 Volts monitor | 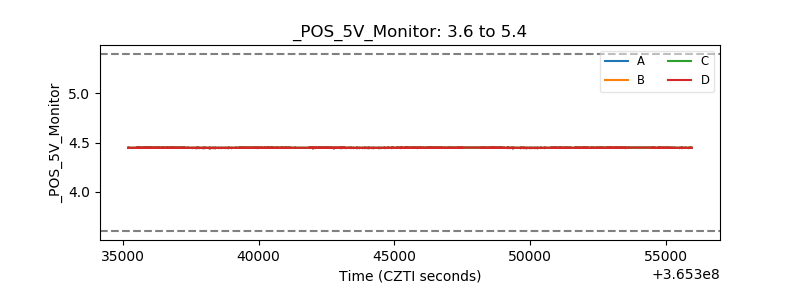 |
| _ROLL_ROT | 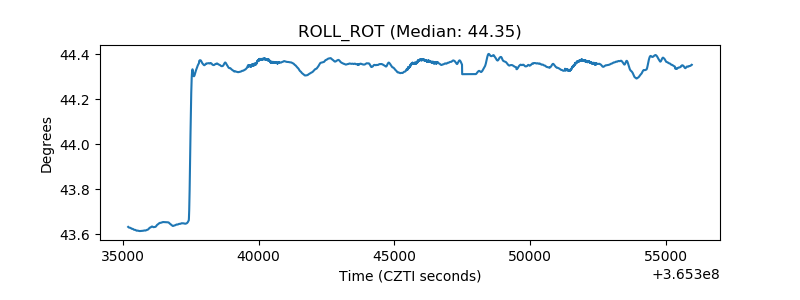 |
| _Roll_DEC | 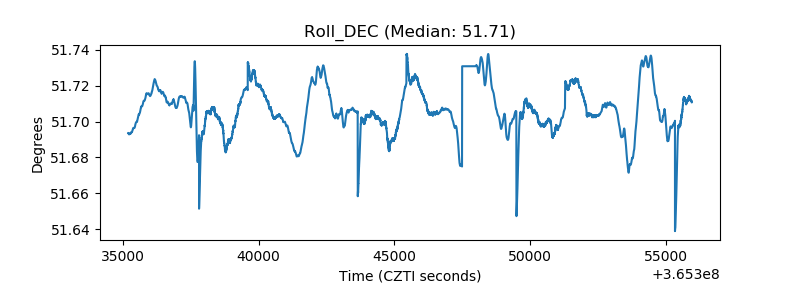 |
| _Roll_RA | 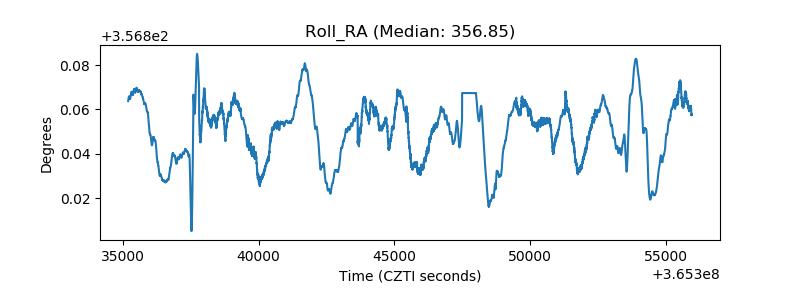 |
| Veto Counter | 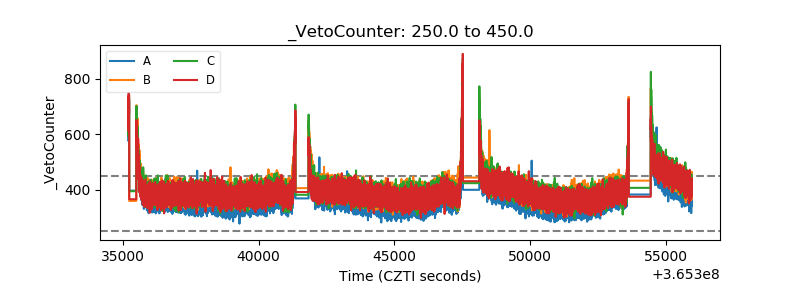 |