| Param | Original file | Final file |
|---|---|---|
| Filename | modeM0/AS1A10_056T01_9000004598_31567cztM0_level2.evt | modeM0/AS1A10_056T01_9000004598_31567cztM0_level2_quad_clean.evt |
| Size (bytes) | 525,087,360 | 98,953,920 |
| Size | 500.8 MB | 94.4 MB |
| Events in quadrant A | 2,970,124 | 655,461 |
| Events in quadrant B | 4,919,298 | 659,435 |
| Events in quadrant C | 3,286,478 | 634,228 |
| Events in quadrant D | 4,310,920 | 619,238 |
| Mode M0 | |||
|---|---|---|---|
| Quadrant | BADHDUFLAG | Total packets | Discarded packets |
| A | 0 | 12965 | 1 |
| B | 0 | 19107 | 1 |
| C | 0 | 13770 | 1 |
| D | 0 | 17060 | 1 |
| Mode M9 | |||
|---|---|---|---|
| Quadrant | BADHDUFLAG | Total packets | Discarded packets |
| A | 0 | 11 | 0 |
| B | 0 | 11 | 0 |
| C | 0 | 11 | 0 |
| D | 0 | 11 | 0 |
| Mode SS | |||
|---|---|---|---|
| Quadrant | BADHDUFLAG | Total packets | Discarded packets |
| A | 0 | 126 | 0 |
| B | 0 | 126 | 0 |
| C | 0 | 126 | 0 |
| D | 0 | 126 | 0 |
| Quadrant | Total seconds | Saturated seconds | Saturation percentage |
|---|---|---|---|
| A | 6132 | 43 | 0.701239% |
| B | 6132 | 121 | 1.973255% |
| C | 6133 | 127 | 2.070765% |
| D | 6133 | 105 | 1.712050% |
Noise dominated data is calculated using 1-second bins in cleaned event files. If a bin has >2000 counts, and if more than 50% of those come from <1% of pixels, then it is considered to be noise-dominated and hence unusable.
| Quadrant | # 1 sec bins | Bins with >0 counts | Bins with >2000 counts | High rate bins dominated by noise | Noise dominated (total time) | Noise dominated (detector-on time) | Marked lightcurve |
|---|---|---|---|---|---|---|---|
| A | 7232 | 6132 | 1 | 1 | 0.01% | 0.02% | 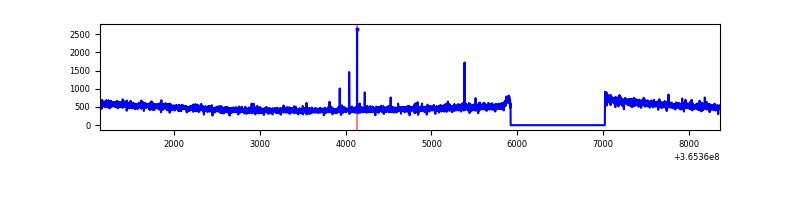 |
| B | 7232 | 6132 | 6 | 6 | 0.08% | 0.10% | 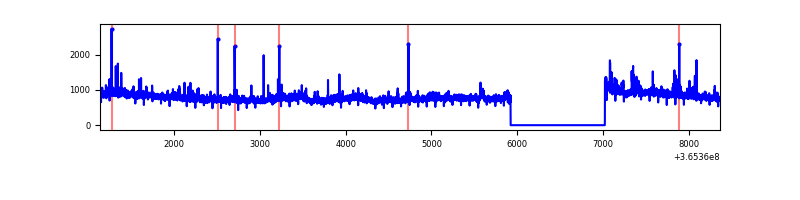 |
| C | 7233 | 6133 | 23 | 23 | 0.32% | 0.38% | 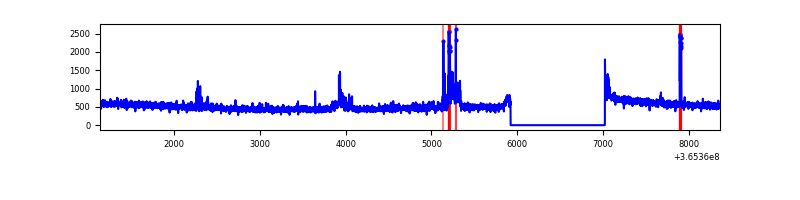 |
| D | 7233 | 6133 | 40 | 40 | 0.55% | 0.65% | 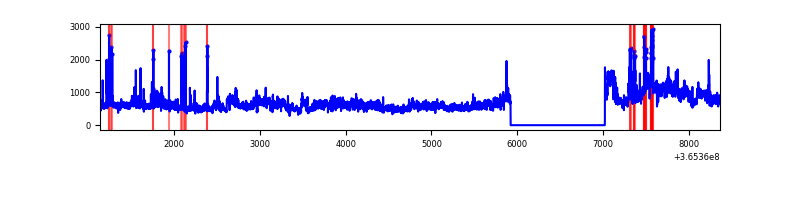 |
Top three noisy pixels from each quadrant. If the there are fewer than three noisy pixels in the level2.evt file, extra rows are filled as -1
| Pixel properties | Quadrant properties | ||||||
|---|---|---|---|---|---|---|---|
| Quadrant | DetID | PixID | Counts | Sigma | Mean | Median | Sigma |
| A | 5 | 168 | 12511 | 76.55 | 766 | 750 | 153.6 |
| A | 13 | 254 | 11164 | 67.79 | 766 | 750 | 153.6 |
| A | 3 | 137 | 7681 | 45.11 | 766 | 750 | 153.6 |
| B | 6 | 159 | 1701545 | 11783.72 | 764 | 745 | 144.3 |
| B | 4 | 80 | 93661 | 643.75 | 764 | 745 | 144.3 |
| B | 0 | 190 | 58798 | 402.21 | 764 | 745 | 144.3 |
| C | 3 | 233 | 155706 | 894.08 | 745 | 752 | 173.3 |
| C | 14 | 238 | 119091 | 682.81 | 745 | 752 | 173.3 |
| C | 10 | 22 | 58828 | 335.09 | 745 | 752 | 173.3 |
| D | 8 | 195 | 1158209 | 6544.81 | 747 | 726 | 176.9 |
| D | 13 | 249 | 146578 | 824.7 | 747 | 726 | 176.9 |
| D | 12 | 218 | 127757 | 718.28 | 747 | 726 | 176.9 |
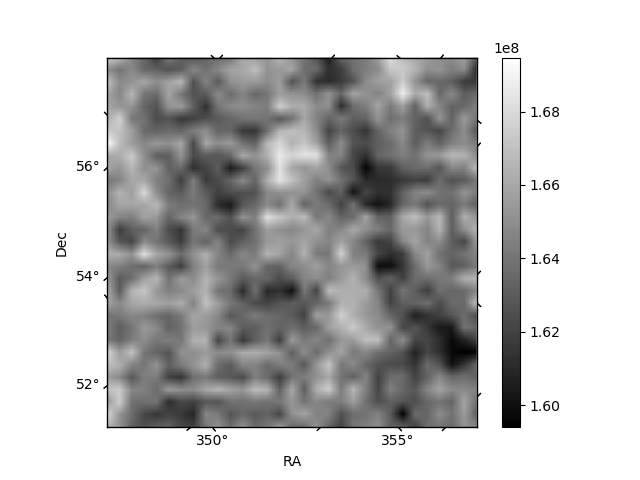
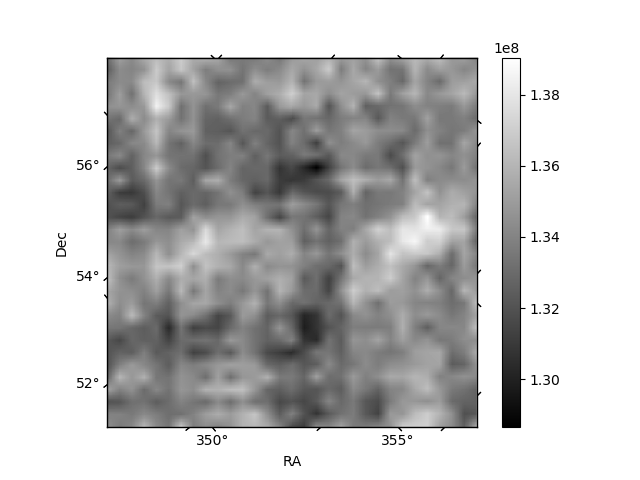
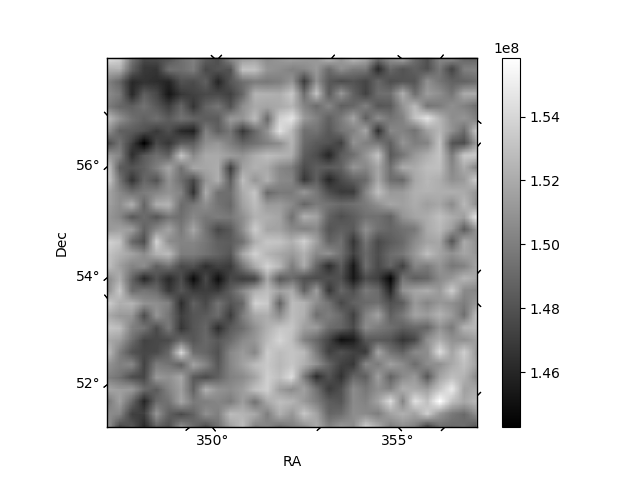
Histogram calculated using DETX and DETY for each event in the final _common_clean file
| Quadrant A | 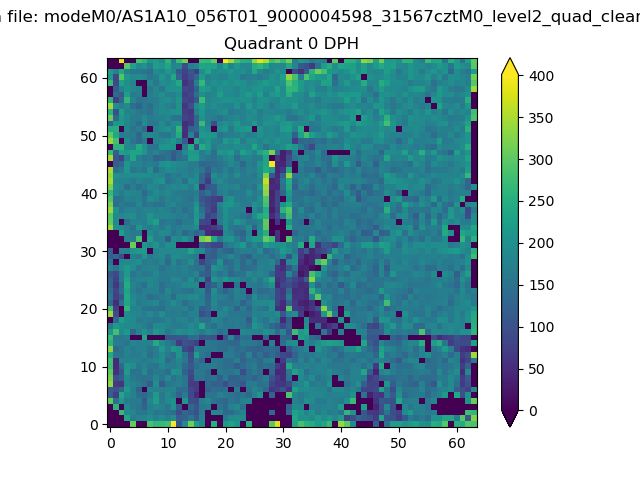 |
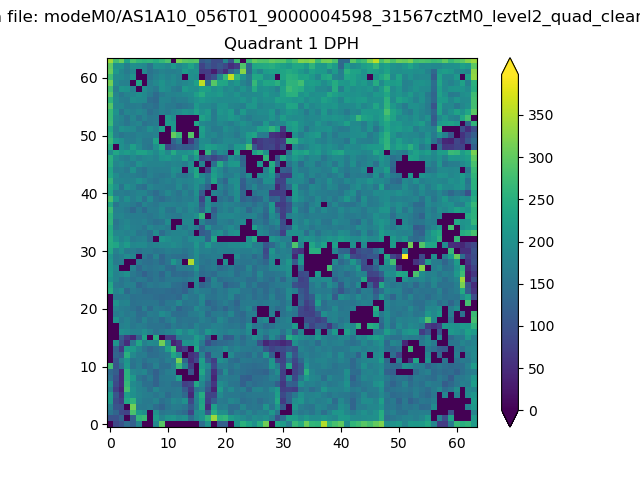 |
Quadrant B |
|---|---|---|---|
| Quadrant D | 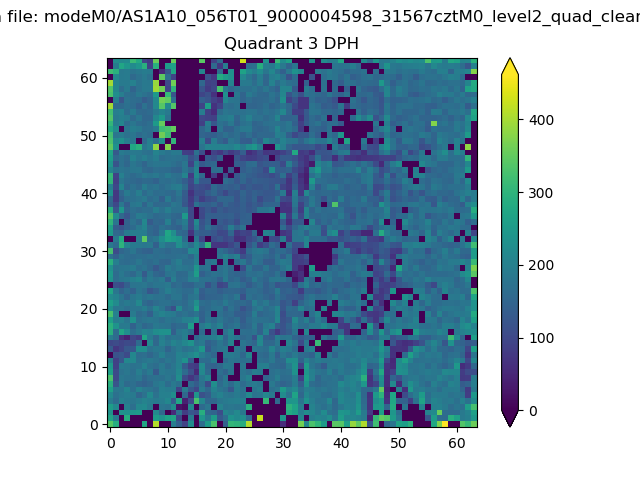 |
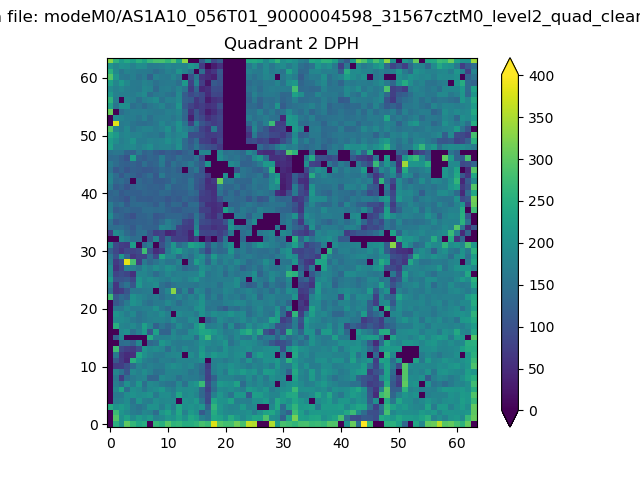 |
Quadrant C |
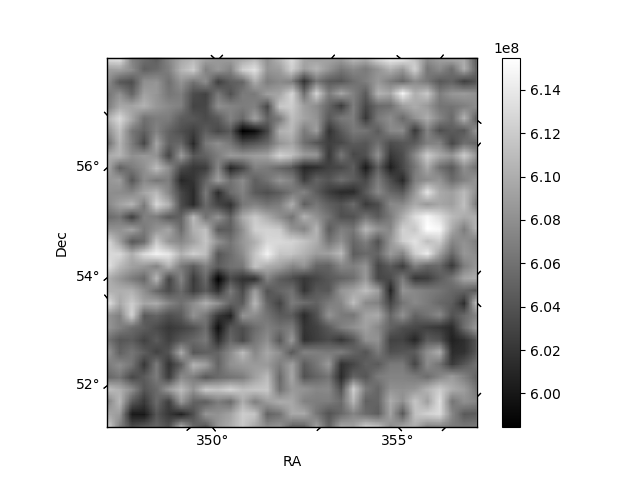
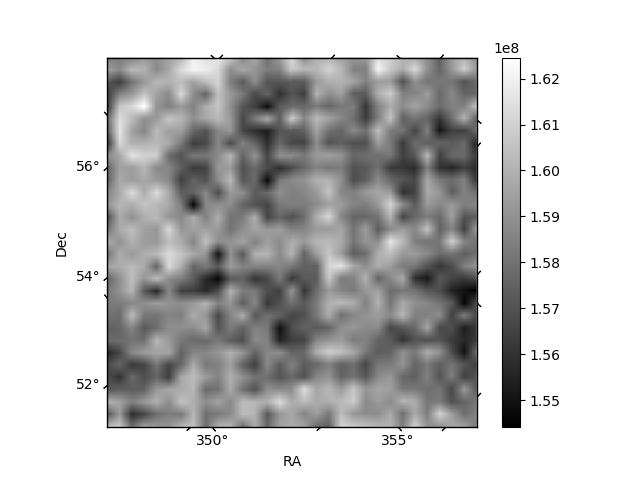
| Plot type | Count rate plots | Images |
|---|---|---|
| Comparison with Poisson distribution Blue bars denote a histogram of data divided into 1 sec bins. Red curve is a Poisson curve with rate = median count rate of data. |
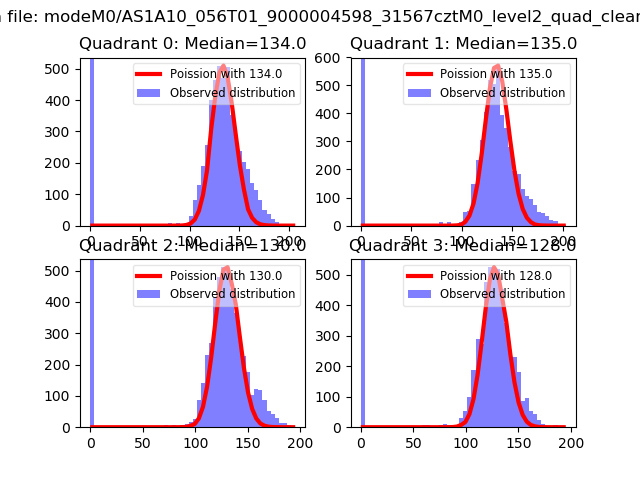 |
 |
| Quadrant-wise count rates Data is divided into 100 sec bins |
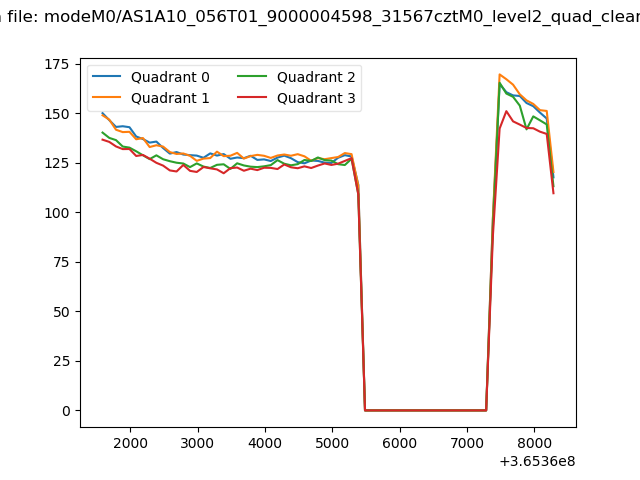 |
|
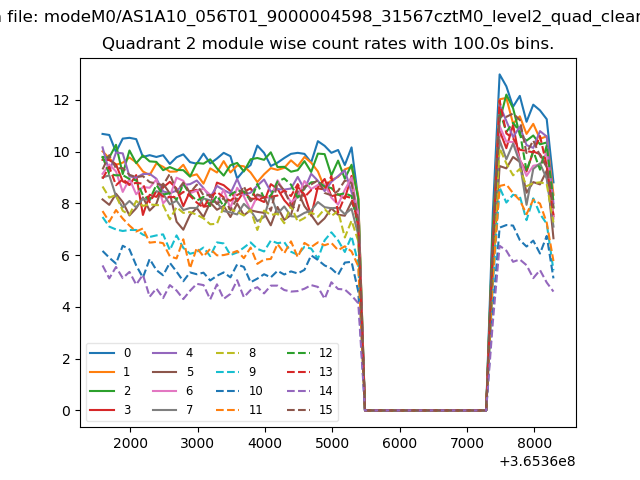
| Module-wise count rates for Quadrant A Data is divided into 100 sec bins |
 |
 |
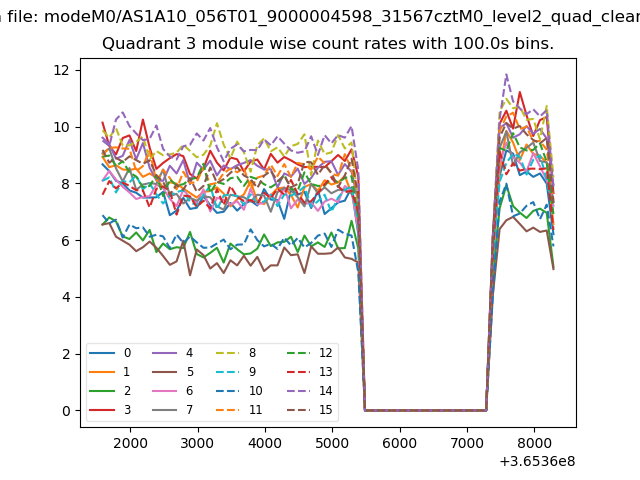
| Module-wise count rates for Quadrant B Data is divided into 100 sec bins |
 |
 |
| Module-wise count rates for Quadrant C Data is divided into 100 sec bins |
 |
 |
| Module-wise count rates for Quadrant D Data is divided into 100 sec bins |
 |
 |
| Parameter | Plot |
|---|---|
| CZT HV Monitor | 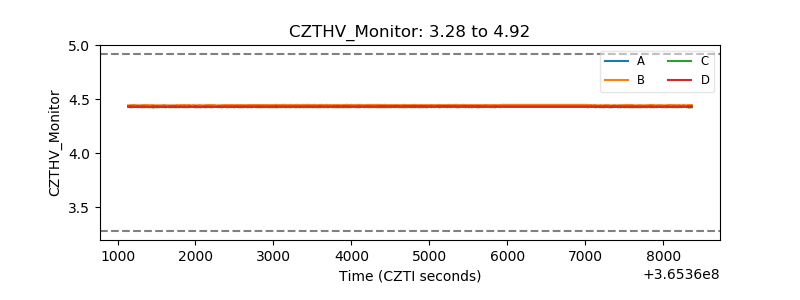 |
| D_VDD | 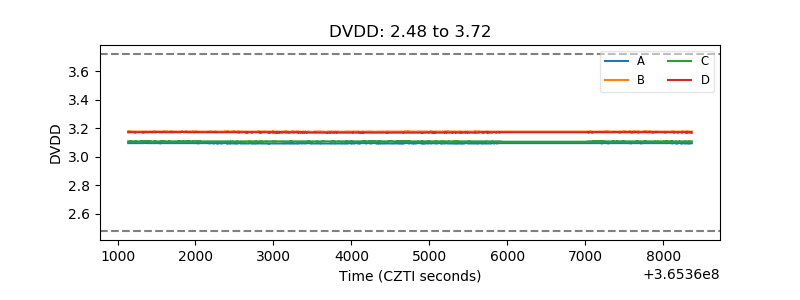 |
| Temperature 1 | 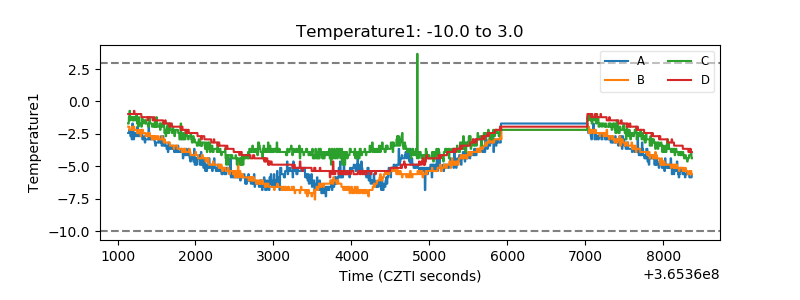 |
| Veto HV Monitor | 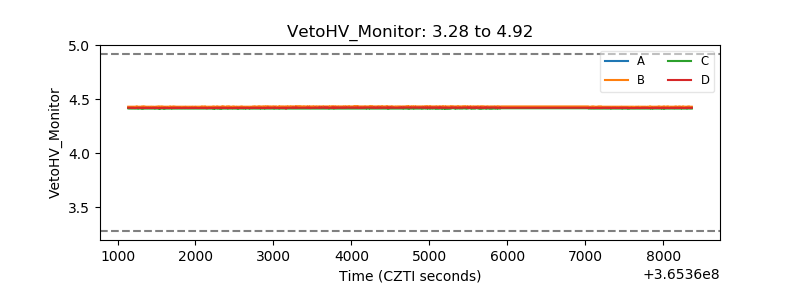 |
| Veto LLD |  |
| Alpha Counter | 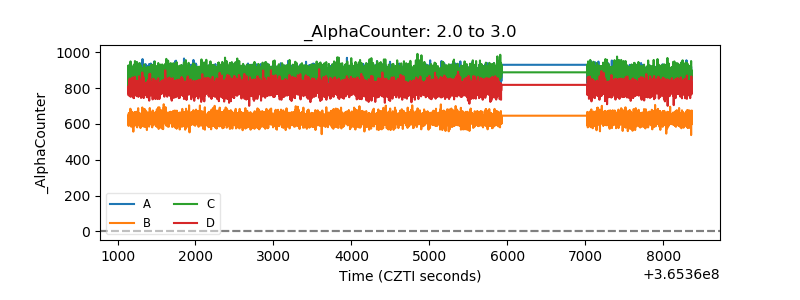 |
| _CPM_Rate | 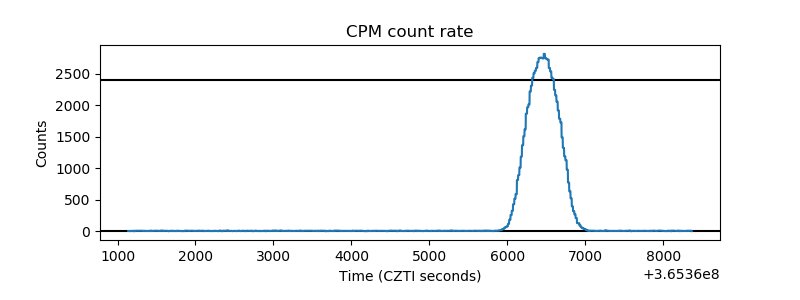 |
| CZT Counter | 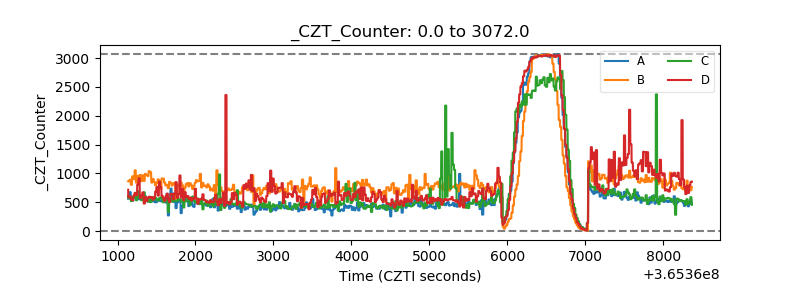 |
| +2.5 Volts monitor |  |
| +5 Volts monitor |  |
| _ROLL_ROT |  |
| _Roll_DEC | 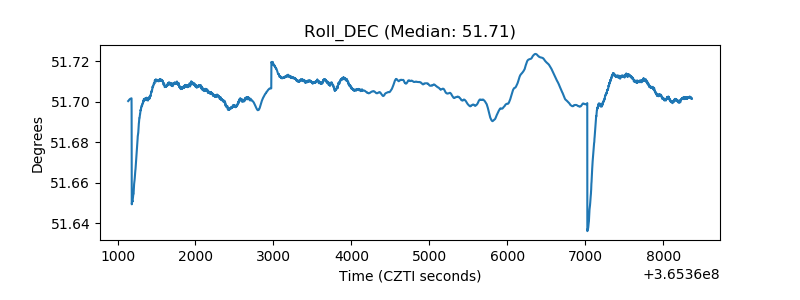 |
| _Roll_RA | 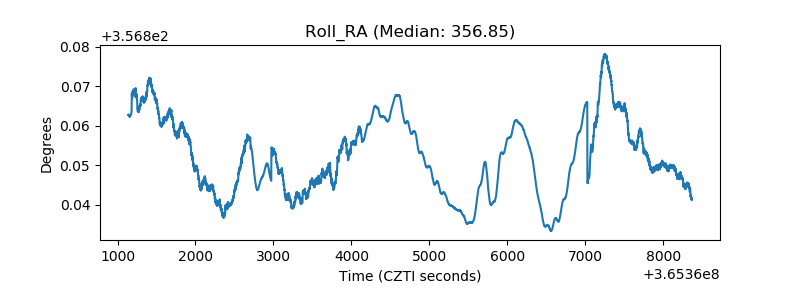 |
| Veto Counter |  |