| Param | Original file | Final file |
|---|---|---|
| Filename | modeM0/AS1A10_056T01_9000004598_31568cztM0_level2.evt | modeM0/AS1A10_056T01_9000004598_31568cztM0_level2_quad_clean.evt |
| Size (bytes) | 562,533,120 | 113,195,520 |
| Size | 536.5 MB | 108.0 MB |
| Events in quadrant A | 3,138,963 | 760,797 |
| Events in quadrant B | 5,137,557 | 774,300 |
| Events in quadrant C | 3,433,372 | 746,219 |
| Events in quadrant D | 4,903,843 | 710,950 |
| Mode M0 | |||
|---|---|---|---|
| Quadrant | BADHDUFLAG | Total packets | Discarded packets |
| A | 0 | 13542 | 1 |
| B | 0 | 19810 | 1 |
| C | 0 | 14305 | 1 |
| D | 0 | 18973 | 1 |
| Mode M9 | |||
|---|---|---|---|
| Quadrant | BADHDUFLAG | Total packets | Discarded packets |
| A | 0 | 12 | 0 |
| B | 0 | 12 | 0 |
| C | 0 | 12 | 0 |
| D | 0 | 12 | 0 |
| Mode SS | |||
|---|---|---|---|
| Quadrant | BADHDUFLAG | Total packets | Discarded packets |
| A | 0 | 128 | 0 |
| B | 0 | 128 | 0 |
| C | 0 | 128 | 0 |
| D | 0 | 128 | 0 |
| Quadrant | Total seconds | Saturated seconds | Saturation percentage |
|---|---|---|---|
| A | 6243 | 36 | 0.576646% |
| B | 6244 | 109 | 1.745676% |
| C | 6243 | 145 | 2.322601% |
| D | 6243 | 137 | 2.194458% |
Noise dominated data is calculated using 1-second bins in cleaned event files. If a bin has >2000 counts, and if more than 50% of those come from <1% of pixels, then it is considered to be noise-dominated and hence unusable.
| Quadrant | # 1 sec bins | Bins with >0 counts | Bins with >2000 counts | High rate bins dominated by noise | Noise dominated (total time) | Noise dominated (detector-on time) | Marked lightcurve |
|---|---|---|---|---|---|---|---|
| A | 7463 | 6243 | 5 | 5 | 0.07% | 0.08% | 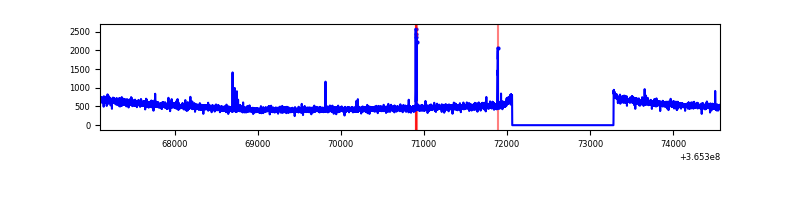 |
| B | 7464 | 6244 | 8 | 8 | 0.11% | 0.13% | 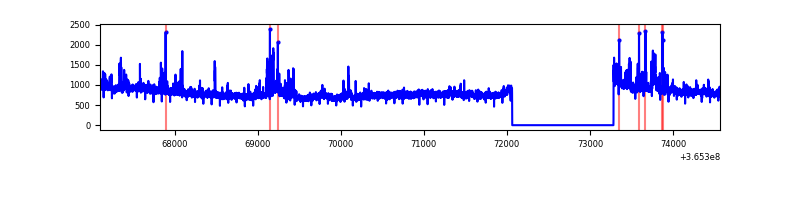 |
| C | 7463 | 6243 | 27 | 27 | 0.36% | 0.43% | 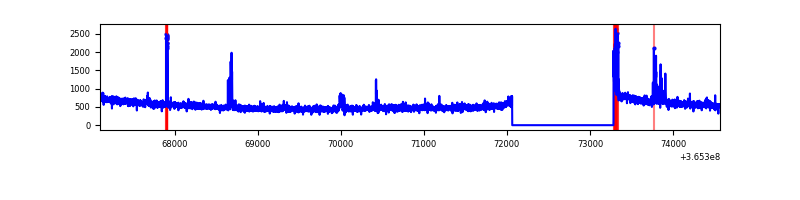 |
| D | 7463 | 6243 | 87 | 87 | 1.17% | 1.39% | 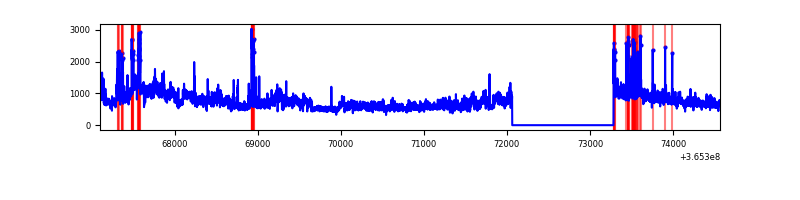 |
Top three noisy pixels from each quadrant. If the there are fewer than three noisy pixels in the level2.evt file, extra rows are filled as -1
| Pixel properties | Quadrant properties | ||||||
|---|---|---|---|---|---|---|---|
| Quadrant | DetID | PixID | Counts | Sigma | Mean | Median | Sigma |
| A | 5 | 168 | 17643 | 106.61 | 805 | 789 | 158.1 |
| A | 8 | 255 | 15809 | 95.01 | 805 | 789 | 158.1 |
| A | 13 | 254 | 11917 | 70.39 | 805 | 789 | 158.1 |
| B | 6 | 159 | 1698773 | 11333.72 | 806 | 788 | 149.8 |
| B | 4 | 80 | 154685 | 1027.23 | 806 | 788 | 149.8 |
| B | 0 | 190 | 51414 | 337.92 | 806 | 788 | 149.8 |
| C | 14 | 238 | 127216 | 689.78 | 786 | 792 | 183.3 |
| C | 10 | 22 | 103133 | 558.38 | 786 | 792 | 183.3 |
| C | 0 | 10 | 68058 | 367.01 | 786 | 792 | 183.3 |
| D | 8 | 195 | 1545385 | 8431.57 | 782 | 762 | 183.2 |
| D | 13 | 249 | 266634 | 1451.3 | 782 | 762 | 183.2 |
| D | 12 | 218 | 58853 | 317.1 | 782 | 762 | 183.2 |
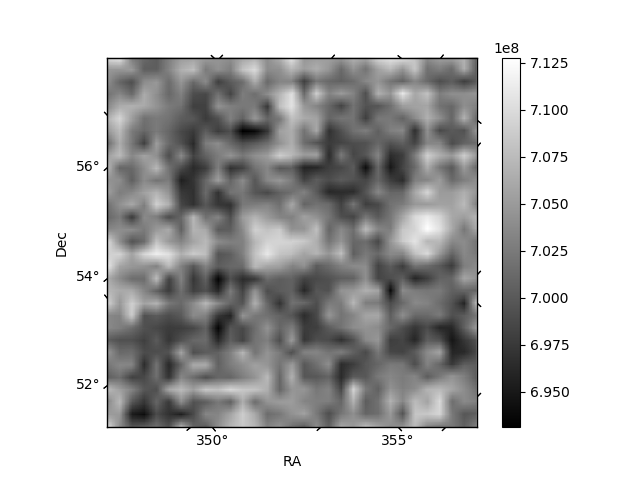
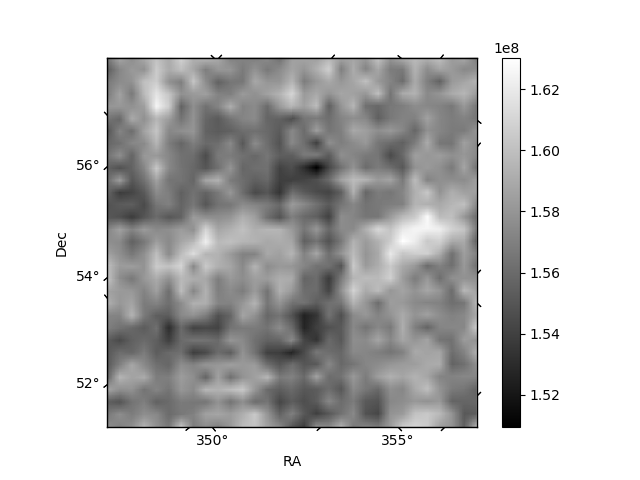
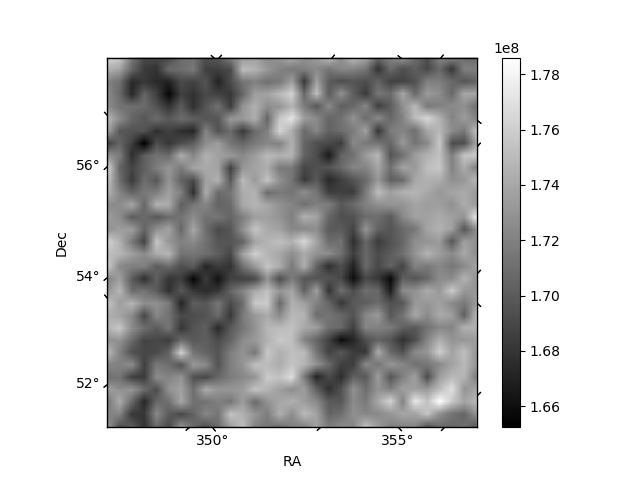
Histogram calculated using DETX and DETY for each event in the final _common_clean file
| Quadrant A | 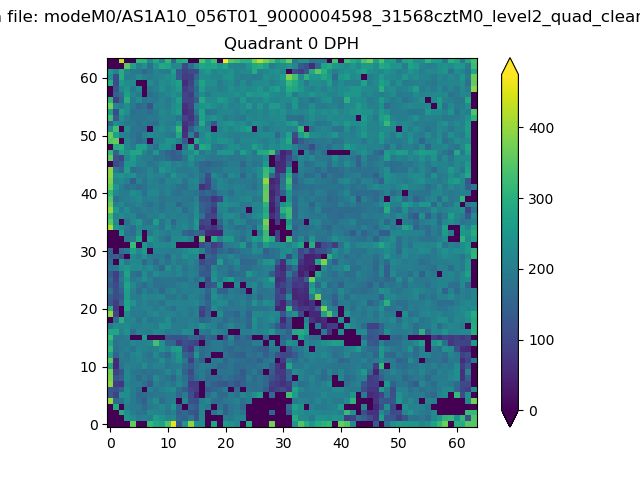 |
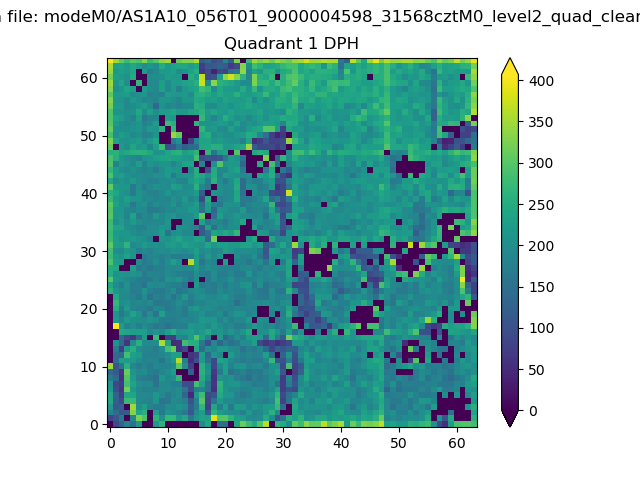 |
Quadrant B |
|---|---|---|---|
| Quadrant D | 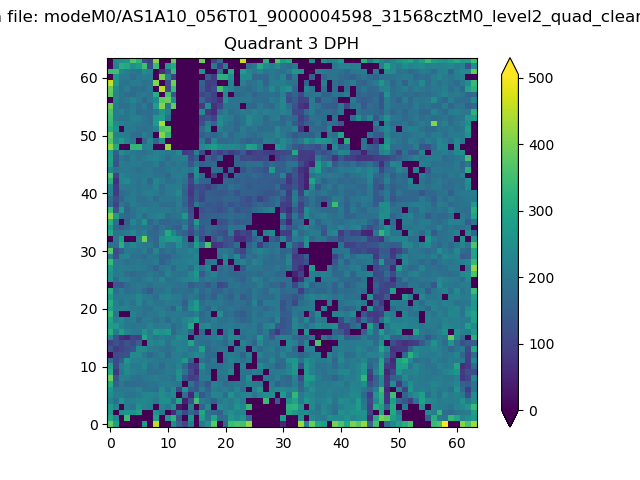 |
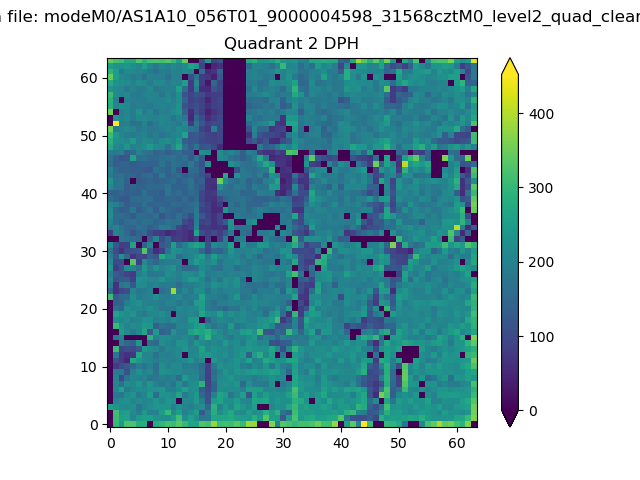 |
Quadrant C |
| Plot type | Count rate plots | Images |
|---|---|---|
| Comparison with Poisson distribution Blue bars denote a histogram of data divided into 1 sec bins. Red curve is a Poisson curve with rate = median count rate of data. |
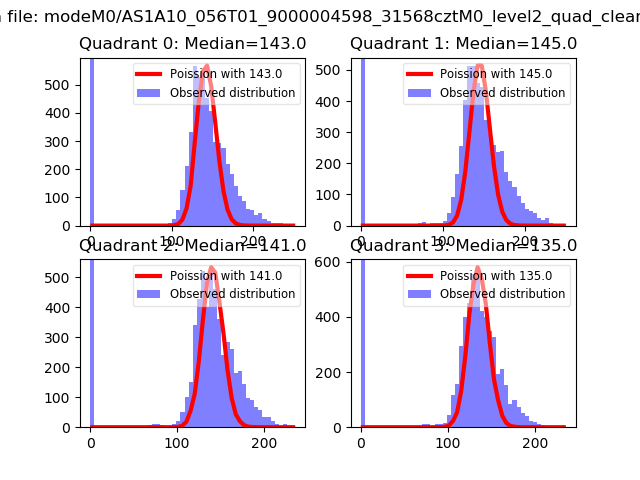 |
 |
| Quadrant-wise count rates Data is divided into 100 sec bins |
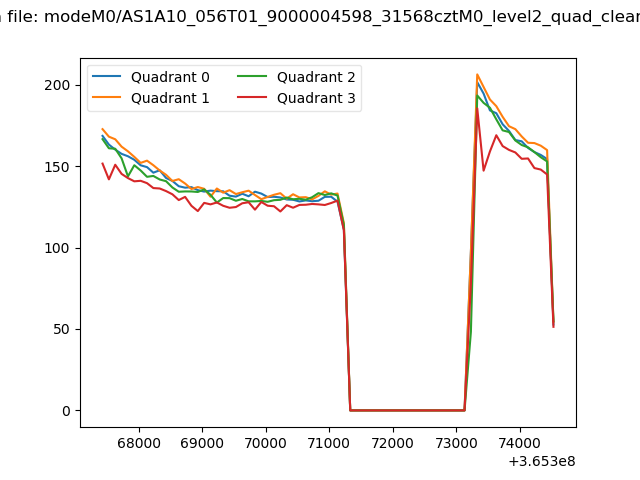 |
|
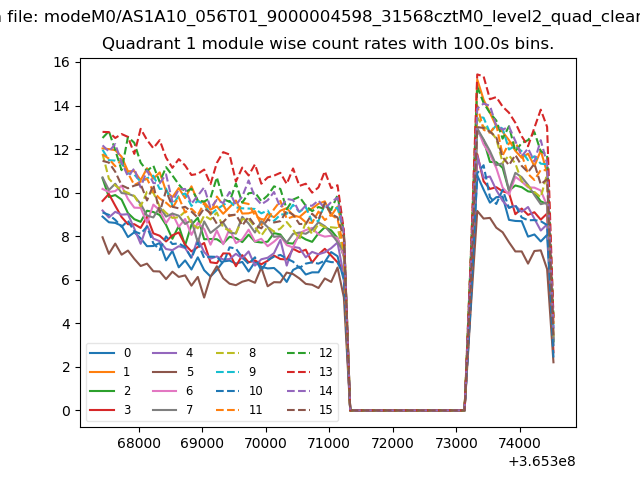
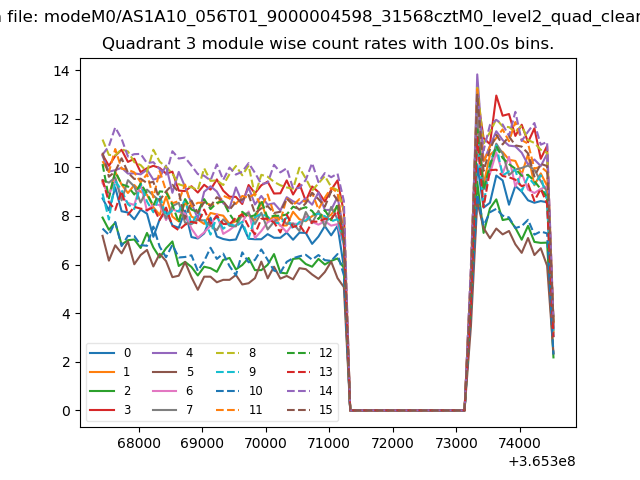
| Module-wise count rates for Quadrant A Data is divided into 100 sec bins |
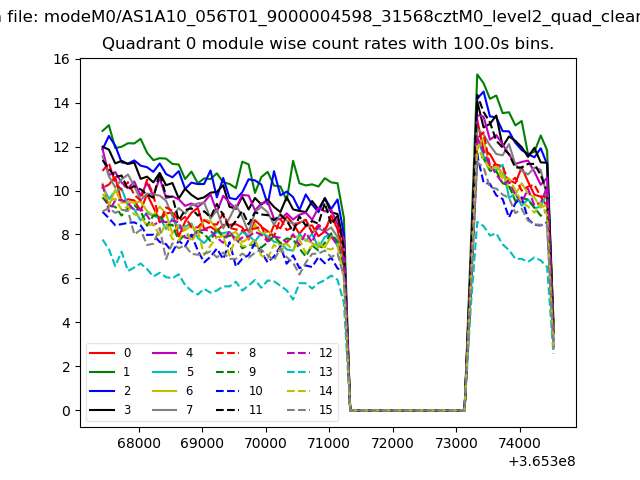 |
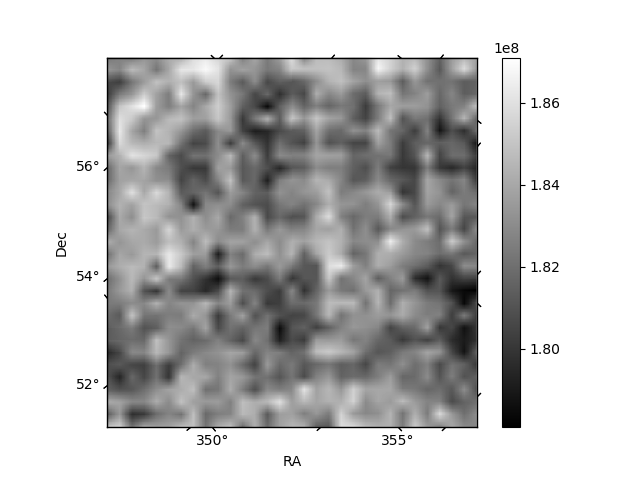 |
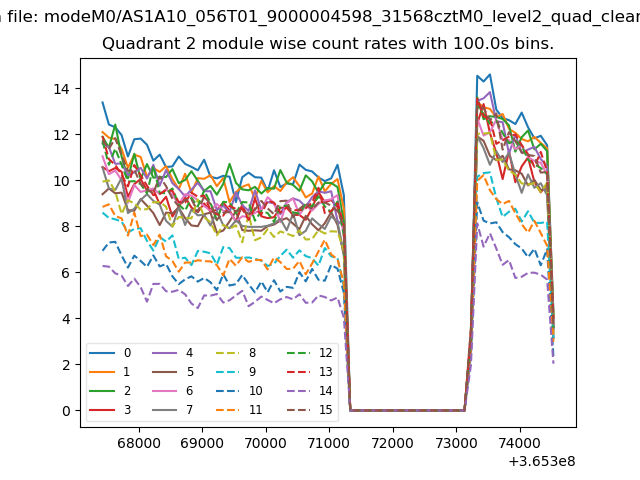
| Module-wise count rates for Quadrant B Data is divided into 100 sec bins |
 |
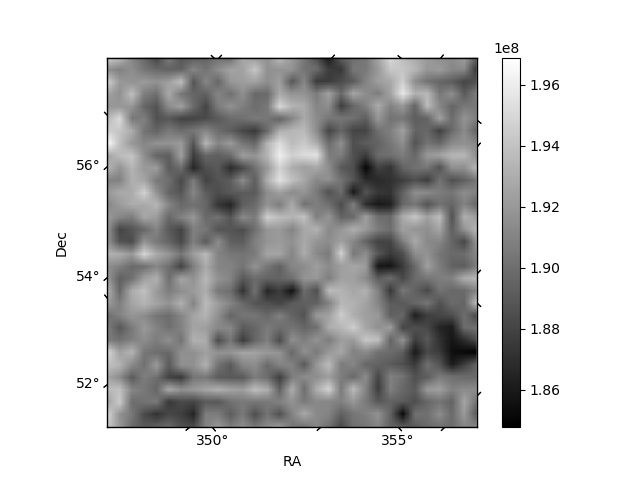 |
| Module-wise count rates for Quadrant C Data is divided into 100 sec bins |
 |
 |
| Module-wise count rates for Quadrant D Data is divided into 100 sec bins |
 |
 |
| Parameter | Plot |
|---|---|
| CZT HV Monitor | 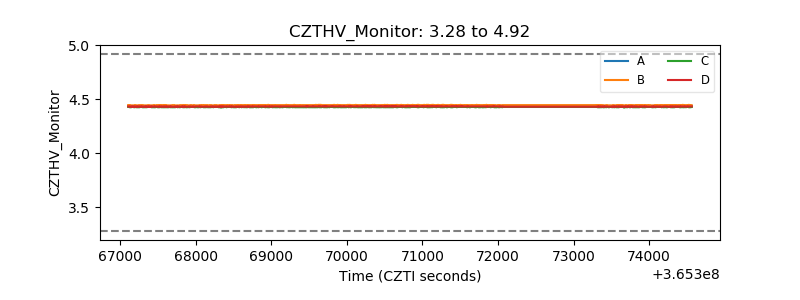 |
| D_VDD | 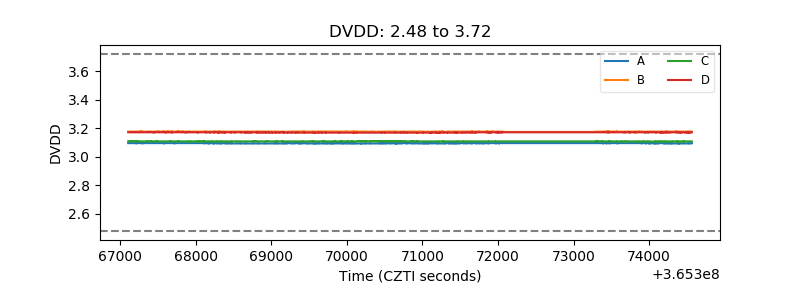 |
| Temperature 1 |  |
| Veto HV Monitor | 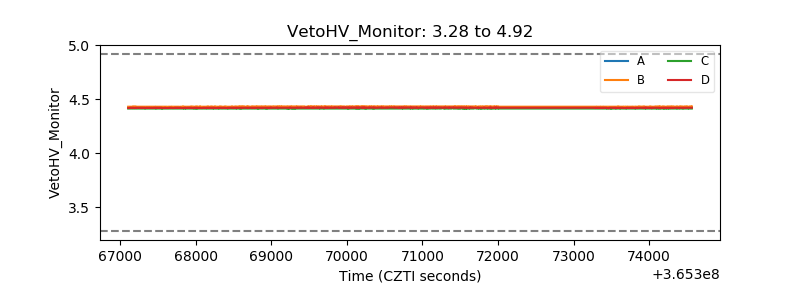 |
| Veto LLD |  |
| Alpha Counter | 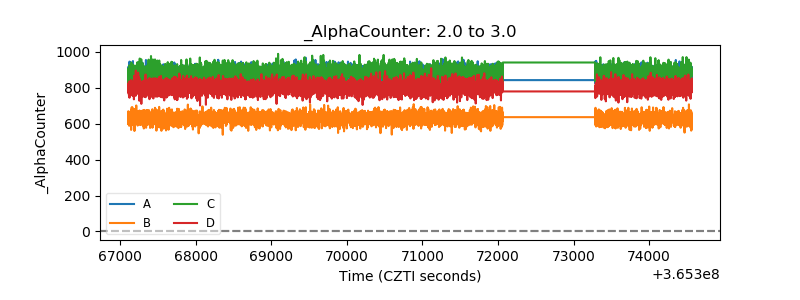 |
| _CPM_Rate | 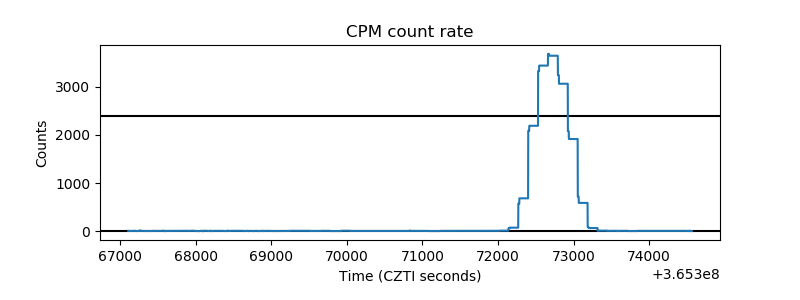 |
| CZT Counter | 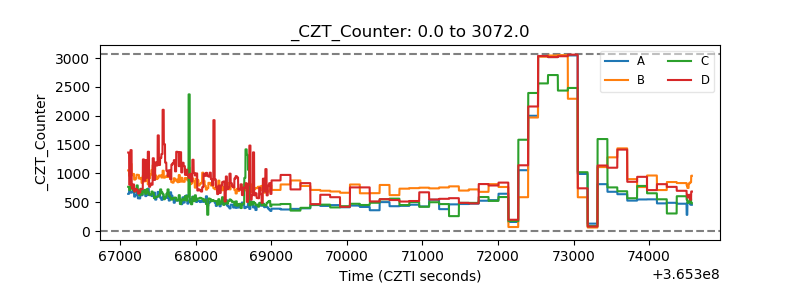 |
| +2.5 Volts monitor |  |
| +5 Volts monitor |  |
| _ROLL_ROT |  |
| _Roll_DEC | 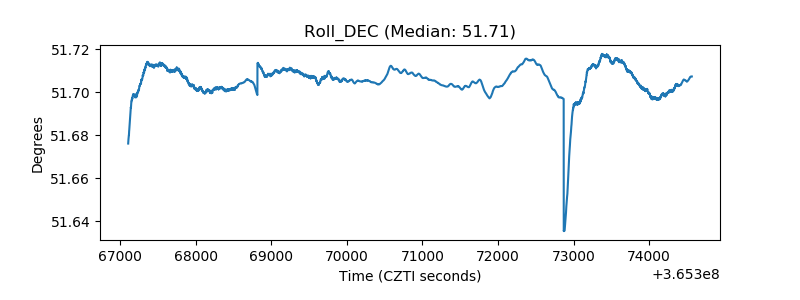 |
| _Roll_RA | 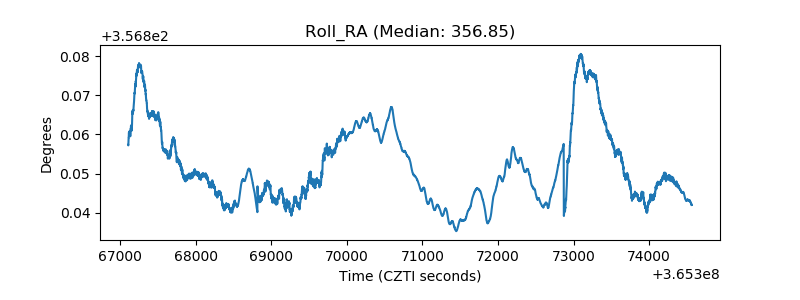 |
| Veto Counter |  |