| Param | Original file | Final file |
|---|---|---|
| Filename | modeM0/AS1A10_056T01_9000004598_31569cztM0_level2.evt | modeM0/AS1A10_056T01_9000004598_31569cztM0_level2_quad_clean.evt |
| Size (bytes) | 561,453,120 | 117,774,720 |
| Size | 535.4 MB | 112.3 MB |
| Events in quadrant A | 3,161,242 | 795,059 |
| Events in quadrant B | 5,175,073 | 812,804 |
| Events in quadrant C | 3,700,647 | 784,241 |
| Events in quadrant D | 4,547,398 | 742,335 |
| Mode M0 | |||
|---|---|---|---|
| Quadrant | BADHDUFLAG | Total packets | Discarded packets |
| A | 0 | 13430 | 2 |
| B | 0 | 19732 | 2 |
| C | 0 | 14972 | 2 |
| D | 0 | 17501 | 4 |
| Mode M9 | |||
|---|---|---|---|
| Quadrant | BADHDUFLAG | Total packets | Discarded packets |
| A | 0 | 14 | 0 |
| B | 0 | 15 | 0 |
| C | 0 | 15 | 0 |
| D | 0 | 15 | 0 |
| Mode SS | |||
|---|---|---|---|
| Quadrant | BADHDUFLAG | Total packets | Discarded packets |
| A | 0 | 128 | 0 |
| B | 0 | 128 | 0 |
| C | 0 | 128 | 0 |
| D | 0 | 128 | 0 |
| Quadrant | Total seconds | Saturated seconds | Saturation percentage |
|---|---|---|---|
| A | 6190 | 48 | 0.775444% |
| B | 6190 | 150 | 2.423263% |
| C | 6190 | 223 | 3.602585% |
| D | 6189 | 170 | 2.746809% |
Noise dominated data is calculated using 1-second bins in cleaned event files. If a bin has >2000 counts, and if more than 50% of those come from <1% of pixels, then it is considered to be noise-dominated and hence unusable.
| Quadrant | # 1 sec bins | Bins with >0 counts | Bins with >2000 counts | High rate bins dominated by noise | Noise dominated (total time) | Noise dominated (detector-on time) | Marked lightcurve |
|---|---|---|---|---|---|---|---|
| A | 7465 | 6190 | 3 | 3 | 0.04% | 0.05% | 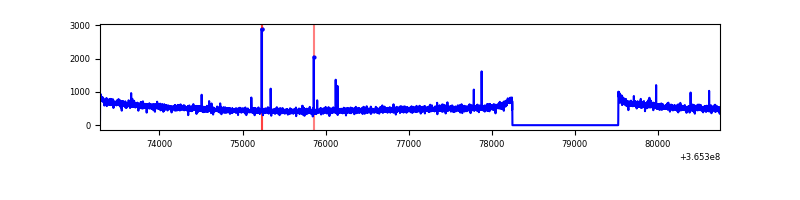 |
| B | 7465 | 6190 | 11 | 11 | 0.15% | 0.18% | 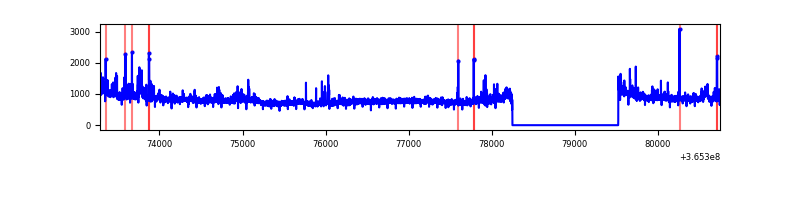 |
| C | 7465 | 6190 | 36 | 36 | 0.48% | 0.58% | 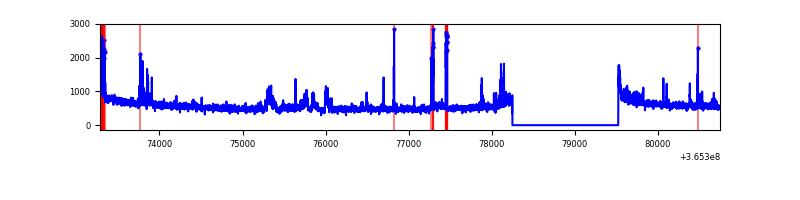 |
| D | 7464 | 6189 | 81 | 81 | 1.09% | 1.31% | 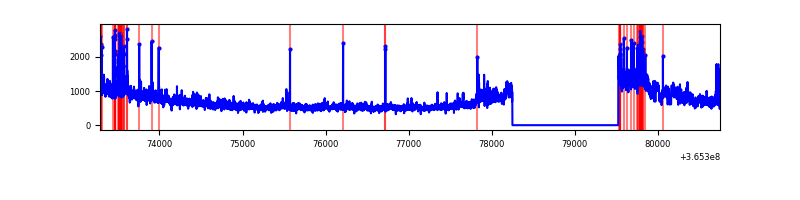 |
Top three noisy pixels from each quadrant. If the there are fewer than three noisy pixels in the level2.evt file, extra rows are filled as -1
| Pixel properties | Quadrant properties | ||||||
|---|---|---|---|---|---|---|---|
| Quadrant | DetID | PixID | Counts | Sigma | Mean | Median | Sigma |
| A | 5 | 168 | 17674 | 104.75 | 813 | 798 | 161.1 |
| A | 13 | 254 | 11743 | 67.94 | 813 | 798 | 161.1 |
| A | 3 | 137 | 7771 | 43.28 | 813 | 798 | 161.1 |
| B | 6 | 159 | 1686754 | 11265.85 | 818 | 799 | 149.7 |
| B | 4 | 80 | 129177 | 857.84 | 818 | 799 | 149.7 |
| B | 0 | 190 | 70914 | 468.52 | 818 | 799 | 149.7 |
| C | 3 | 233 | 255660 | 1376.91 | 797 | 803 | 185.1 |
| C | 14 | 238 | 130635 | 701.44 | 797 | 803 | 185.1 |
| C | 0 | 10 | 76424 | 408.56 | 797 | 803 | 185.1 |
| D | 8 | 195 | 1236572 | 6642.68 | 788 | 768 | 186.0 |
| D | 13 | 249 | 129864 | 693.92 | 788 | 768 | 186.0 |
| D | 12 | 218 | 122181 | 652.62 | 788 | 768 | 186.0 |
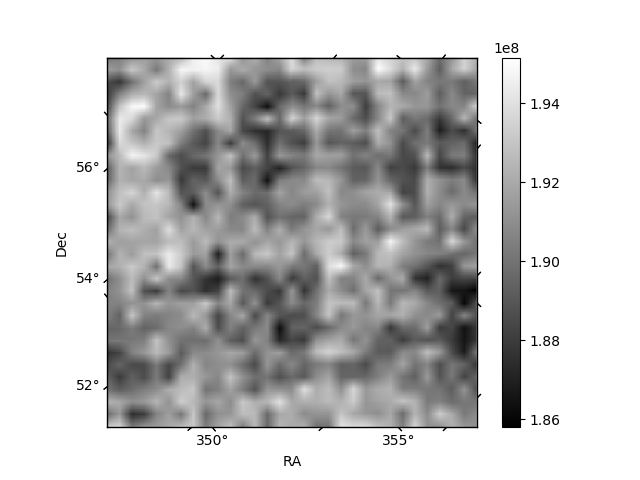
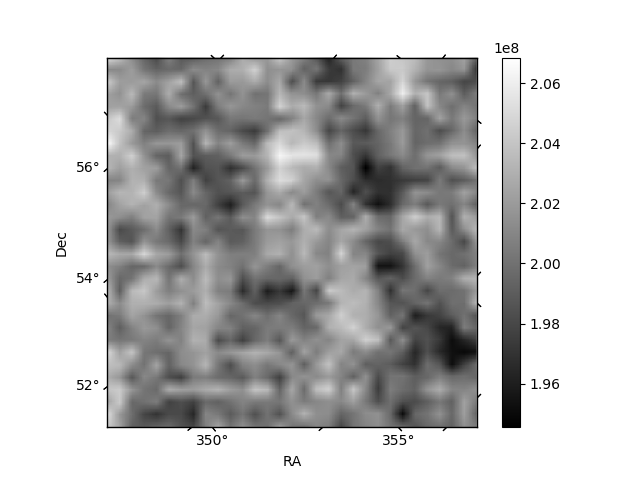
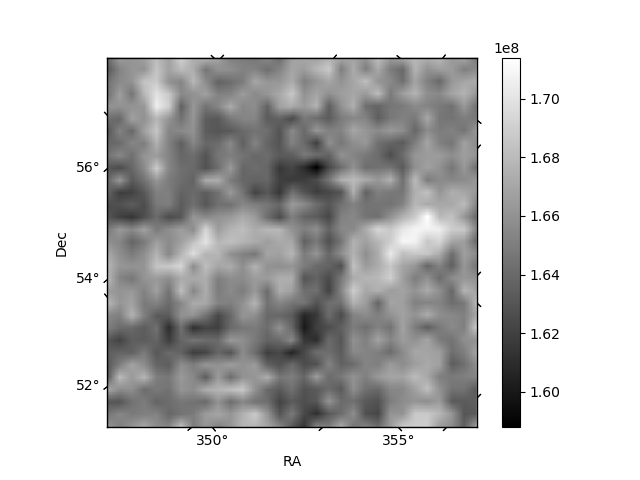
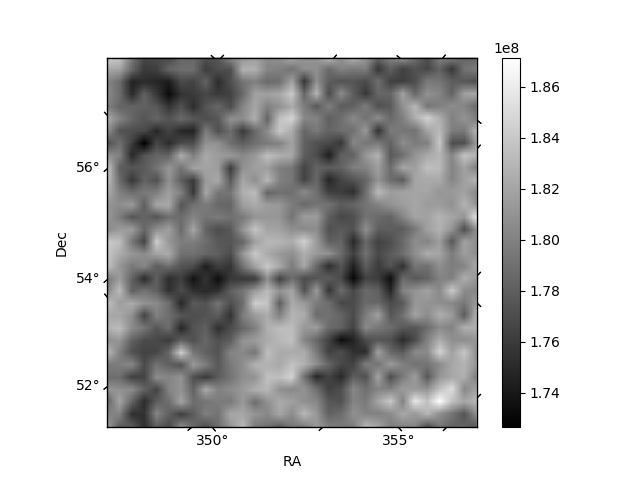
Histogram calculated using DETX and DETY for each event in the final _common_clean file
| Quadrant A | 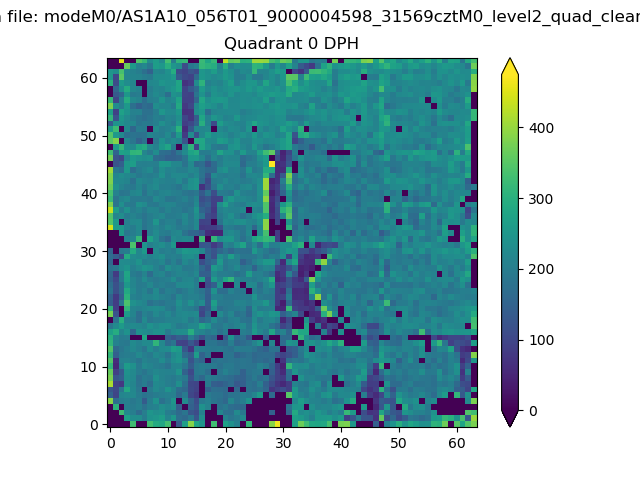 |
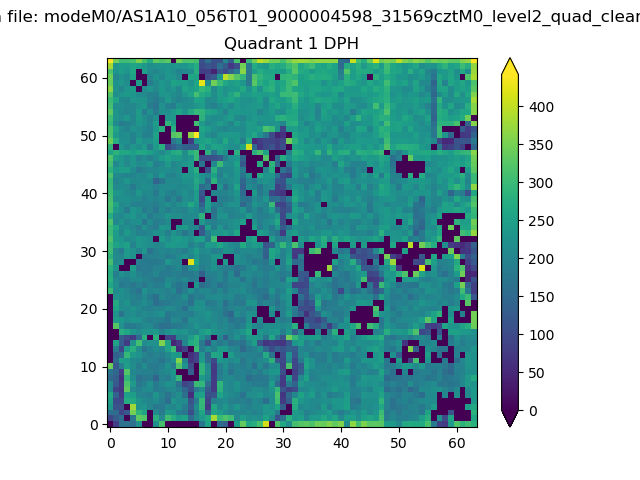 |
Quadrant B |
|---|---|---|---|
| Quadrant D | 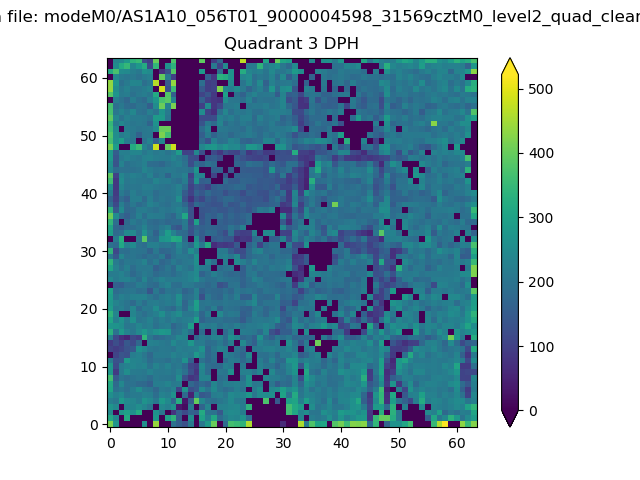 |
 |
Quadrant C |
| Plot type | Count rate plots | Images |
|---|---|---|
| Comparison with Poisson distribution Blue bars denote a histogram of data divided into 1 sec bins. Red curve is a Poisson curve with rate = median count rate of data. |
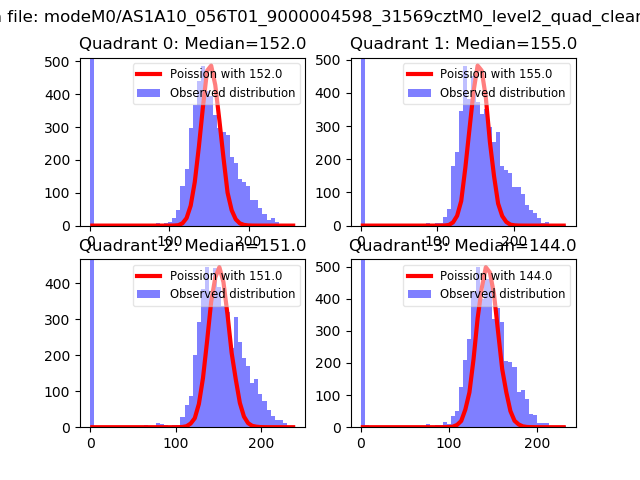 |
 |
| Quadrant-wise count rates Data is divided into 100 sec bins |
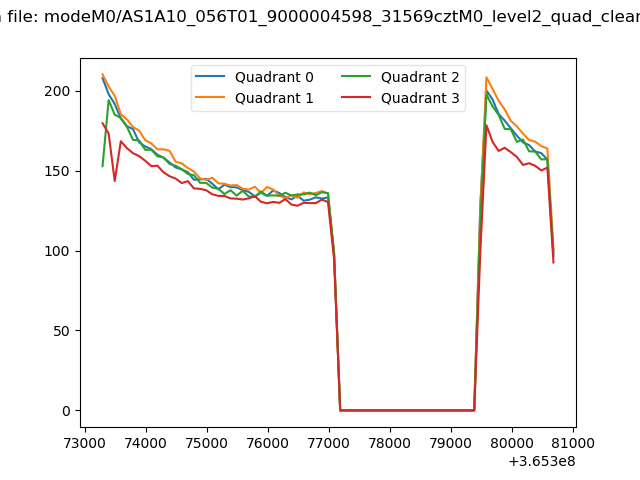 |
|
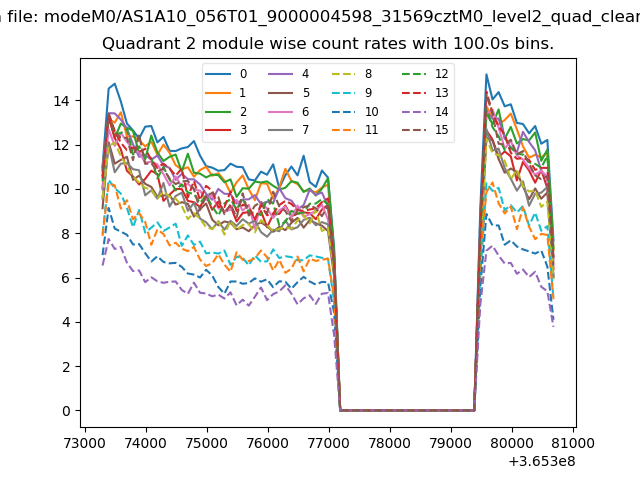
| Module-wise count rates for Quadrant A Data is divided into 100 sec bins |
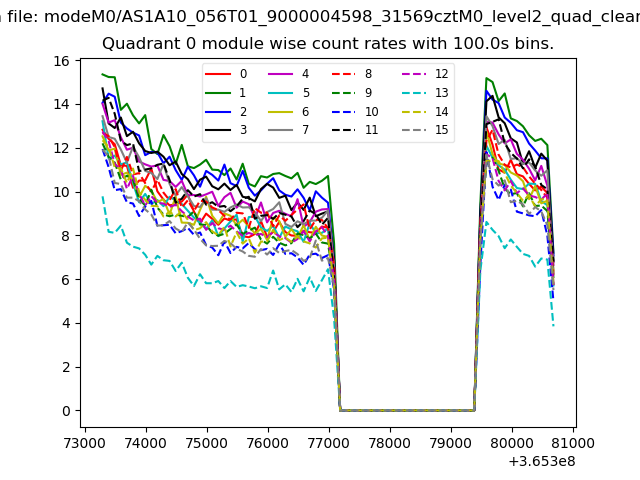 |
 |
| Module-wise count rates for Quadrant B Data is divided into 100 sec bins |
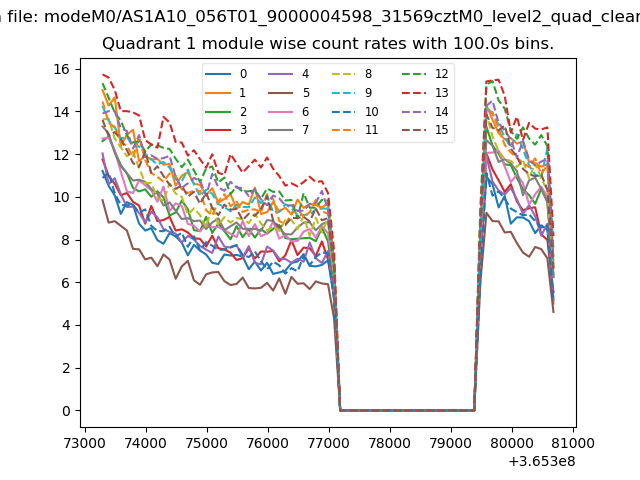 |
 |
| Module-wise count rates for Quadrant C Data is divided into 100 sec bins |
 |
 |
| Module-wise count rates for Quadrant D Data is divided into 100 sec bins |
 |
 |
| Parameter | Plot |
|---|---|
| CZT HV Monitor | 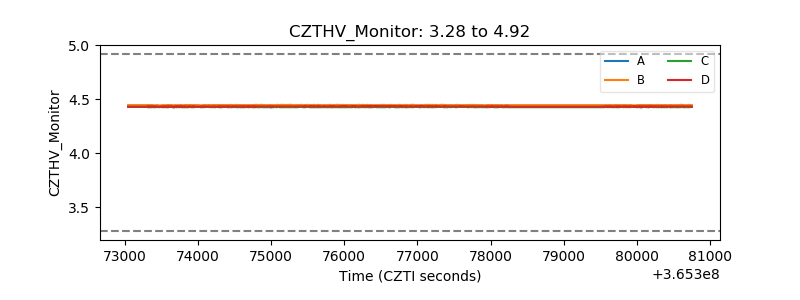 |
| D_VDD | 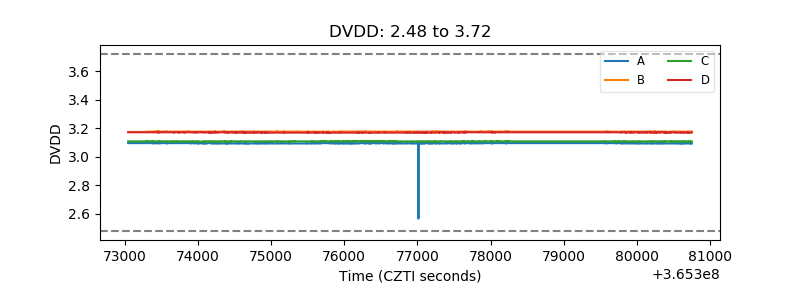 |
| Temperature 1 | 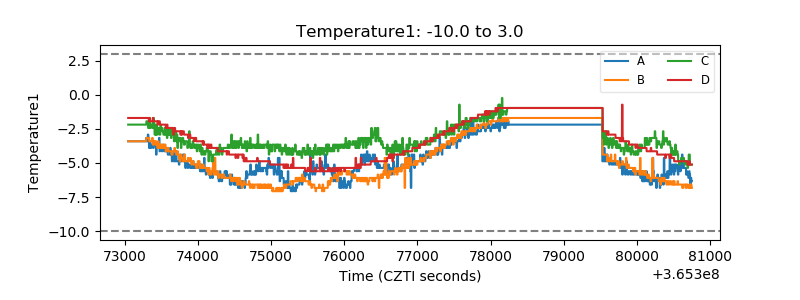 |
| Veto HV Monitor | 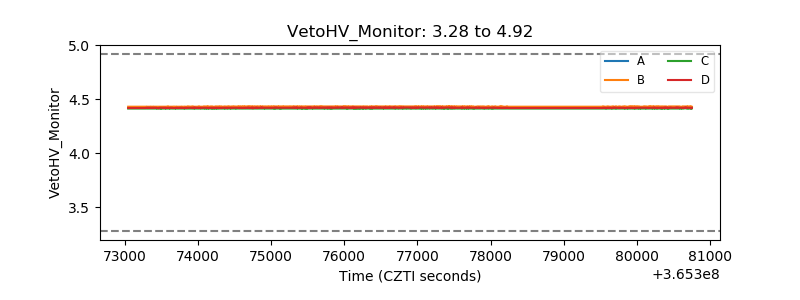 |
| Veto LLD | 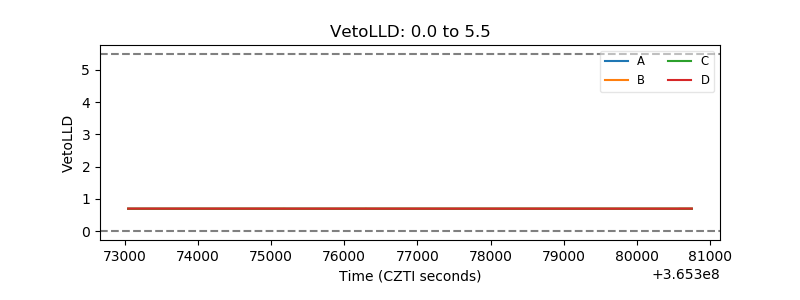 |
| Alpha Counter | 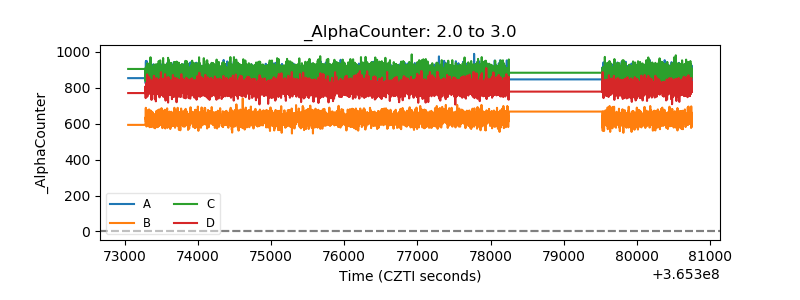 |
| _CPM_Rate | 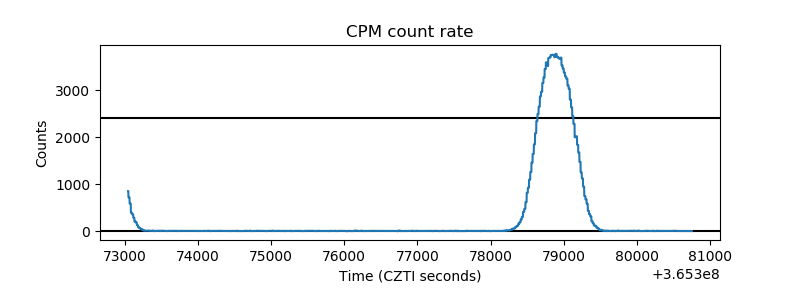 |
| CZT Counter |  |
| +2.5 Volts monitor |  |
| +5 Volts monitor | 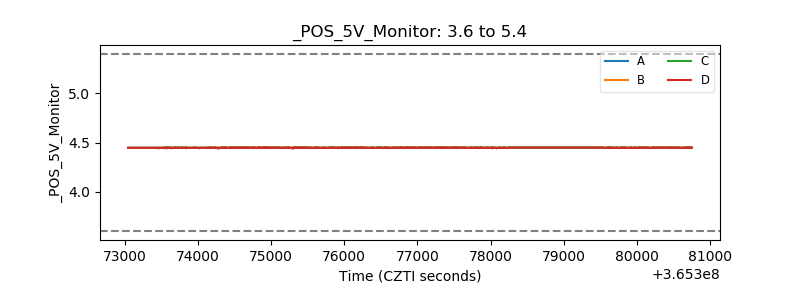 |
| _ROLL_ROT | 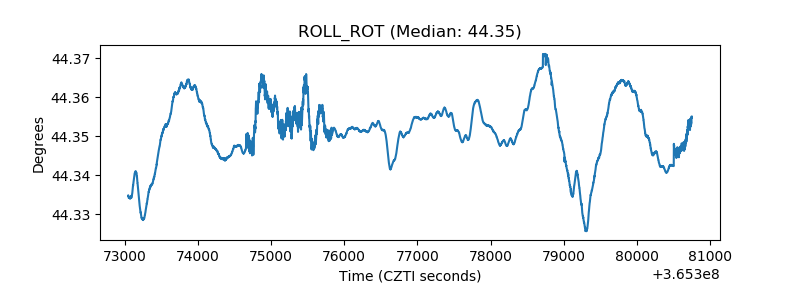 |
| _Roll_DEC | 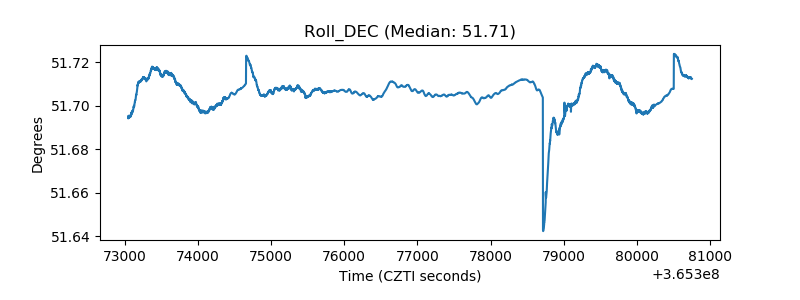 |
| _Roll_RA | 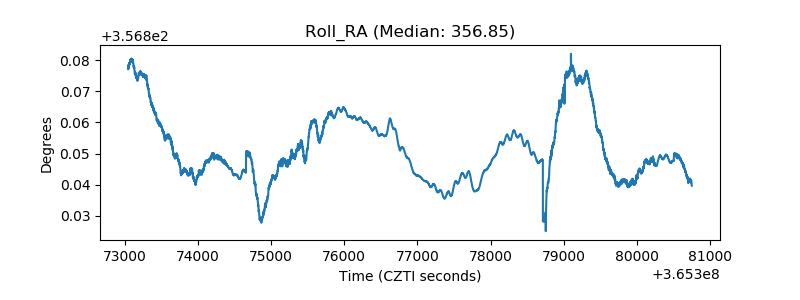 |
| Veto Counter | 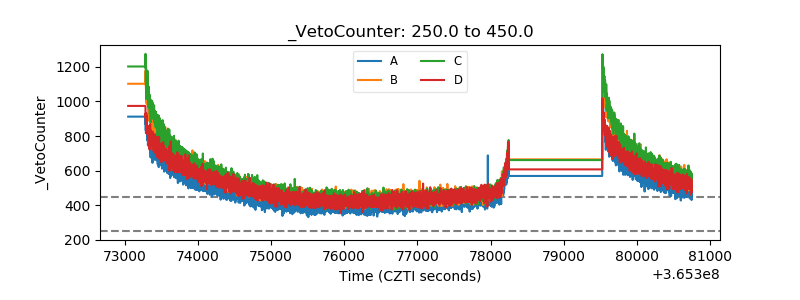 |