| Param | Original file | Final file |
|---|---|---|
| Filename | modeM0/AS1A10_056T01_9000004598_31570cztM0_level2.evt | modeM0/AS1A10_056T01_9000004598_31570cztM0_level2_quad_clean.evt |
| Size (bytes) | 549,141,120 | 110,157,120 |
| Size | 523.7 MB | 105.1 MB |
| Events in quadrant A | 3,124,513 | 736,590 |
| Events in quadrant B | 5,074,643 | 758,479 |
| Events in quadrant C | 3,622,596 | 728,060 |
| Events in quadrant D | 4,394,509 | 685,251 |
| Mode M0 | |||
|---|---|---|---|
| Quadrant | BADHDUFLAG | Total packets | Discarded packets |
| A | 0 | 13190 | 2 |
| B | 0 | 19304 | 2 |
| C | 0 | 14655 | 2 |
| D | 0 | 17315 | 4 |
| Mode M9 | |||
|---|---|---|---|
| Quadrant | BADHDUFLAG | Total packets | Discarded packets |
| A | 0 | 20 | 0 |
| B | 0 | 21 | 0 |
| C | 0 | 21 | 0 |
| D | 0 | 21 | 0 |
| Mode SS | |||
|---|---|---|---|
| Quadrant | BADHDUFLAG | Total packets | Discarded packets |
| A | 0 | 124 | 0 |
| B | 0 | 124 | 0 |
| C | 0 | 124 | 0 |
| D | 0 | 124 | 0 |
| Quadrant | Total seconds | Saturated seconds | Saturation percentage |
|---|---|---|---|
| A | 6133 | 11 | 0.179358% |
| B | 6133 | 78 | 1.271808% |
| C | 6133 | 150 | 2.445785% |
| D | 6132 | 107 | 1.744945% |
Noise dominated data is calculated using 1-second bins in cleaned event files. If a bin has >2000 counts, and if more than 50% of those come from <1% of pixels, then it is considered to be noise-dominated and hence unusable.
| Quadrant | # 1 sec bins | Bins with >0 counts | Bins with >2000 counts | High rate bins dominated by noise | Noise dominated (total time) | Noise dominated (detector-on time) | Marked lightcurve |
|---|---|---|---|---|---|---|---|
| A | 7503 | 6134 | 0 | 0 | 0.00% | 0.00% | 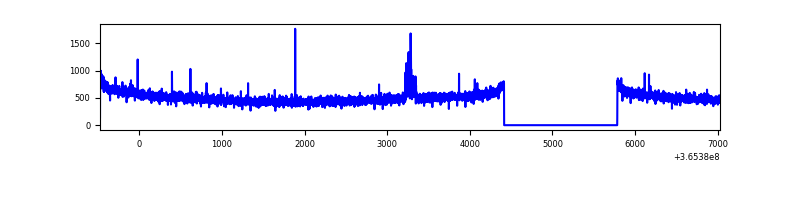 |
| B | 7503 | 6133 | 5 | 5 | 0.07% | 0.08% | 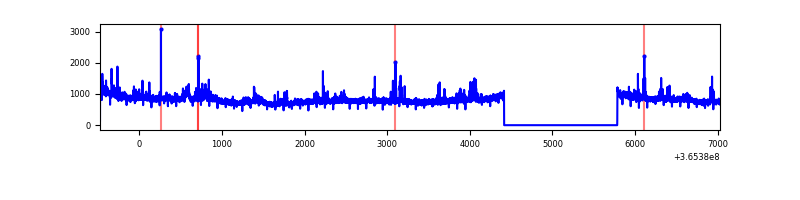 |
| C | 7503 | 6134 | 11 | 11 | 0.15% | 0.18% | 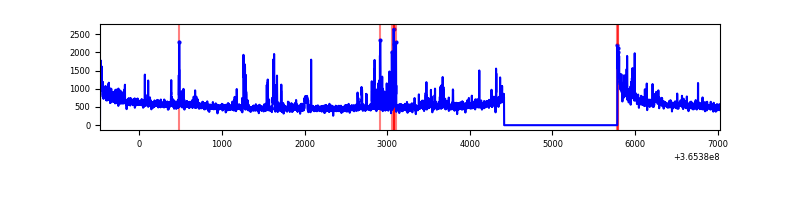 |
| D | 7502 | 6132 | 62 | 62 | 0.83% | 1.01% | 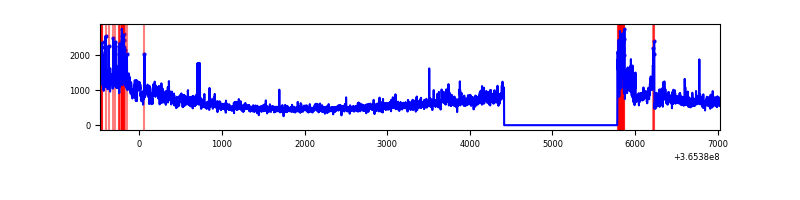 |
Top three noisy pixels from each quadrant. If the there are fewer than three noisy pixels in the level2.evt file, extra rows are filled as -1
| Pixel properties | Quadrant properties | ||||||
|---|---|---|---|---|---|---|---|
| Quadrant | DetID | PixID | Counts | Sigma | Mean | Median | Sigma |
| A | 8 | 255 | 43067 | 267.83 | 797 | 784 | 157.9 |
| A | 13 | 254 | 11098 | 65.33 | 797 | 784 | 157.9 |
| A | 3 | 137 | 7596 | 43.15 | 797 | 784 | 157.9 |
| B | 6 | 159 | 1688197 | 11219.85 | 805 | 787 | 150.4 |
| B | 4 | 80 | 149928 | 991.66 | 805 | 787 | 150.4 |
| B | 0 | 190 | 43737 | 285.58 | 805 | 787 | 150.4 |
| C | 10 | 22 | 210750 | 1158.33 | 782 | 788 | 181.3 |
| C | 3 | 233 | 159736 | 876.89 | 782 | 788 | 181.3 |
| C | 14 | 238 | 130180 | 713.84 | 782 | 788 | 181.3 |
| D | 8 | 195 | 1236828 | 6810.65 | 769 | 750 | 181.5 |
| D | 12 | 218 | 172140 | 944.34 | 769 | 750 | 181.5 |
| D | 7 | 223 | 27255 | 146.04 | 769 | 750 | 181.5 |
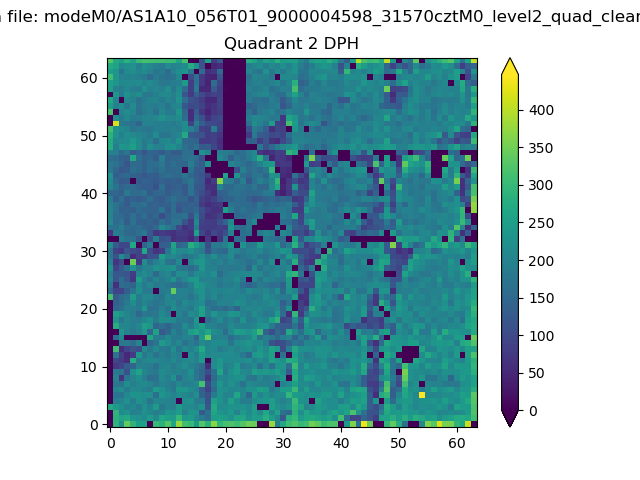
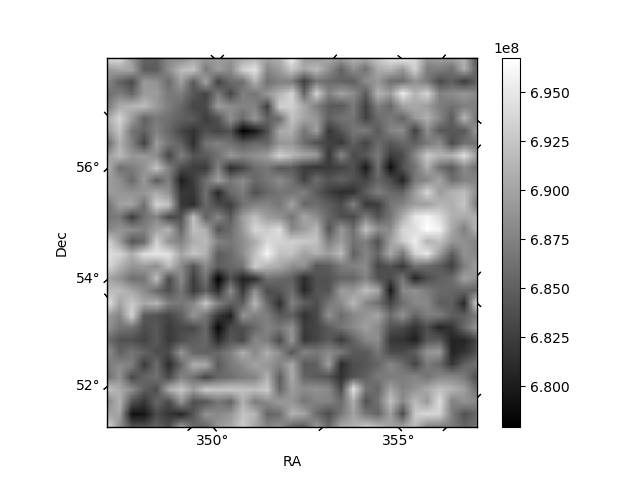
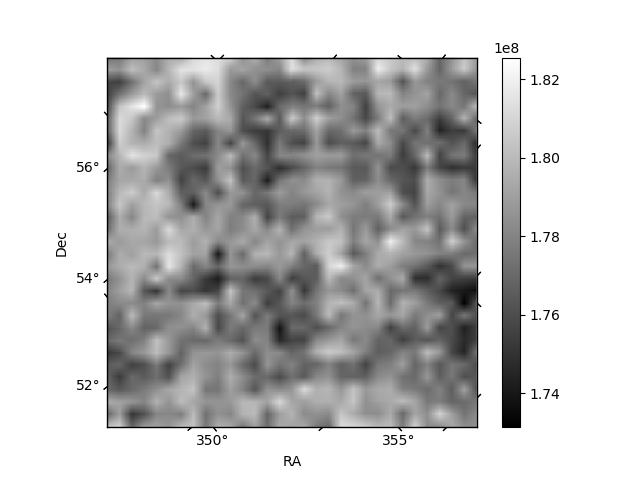
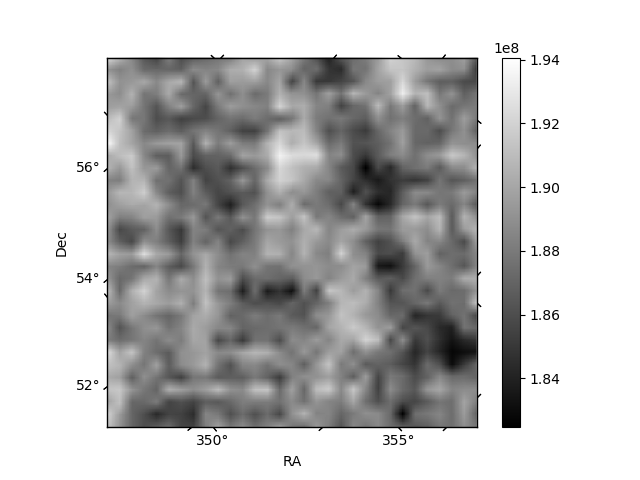
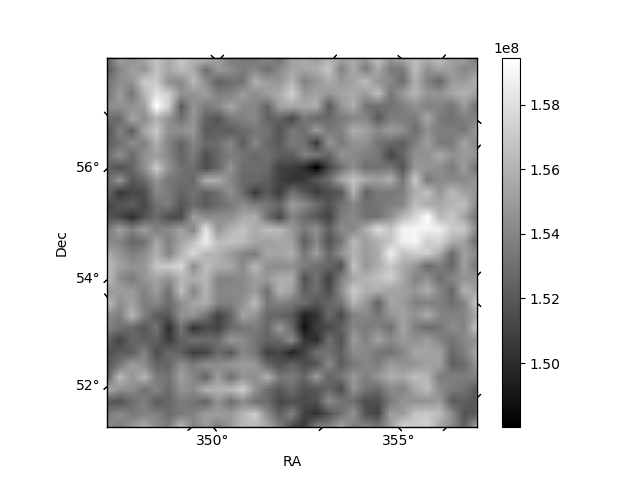
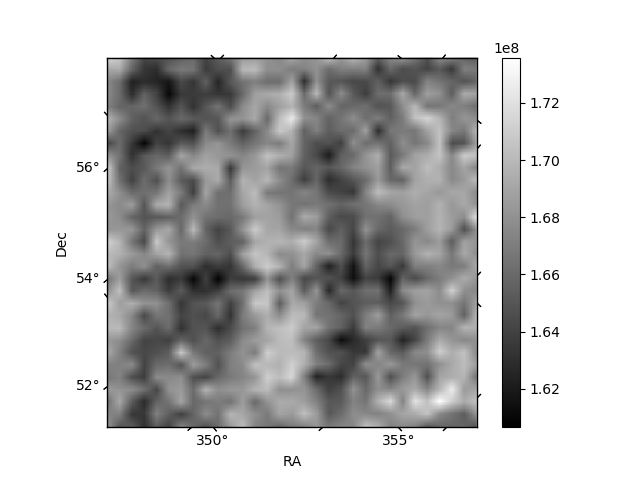
Histogram calculated using DETX and DETY for each event in the final _common_clean file
| Quadrant A | 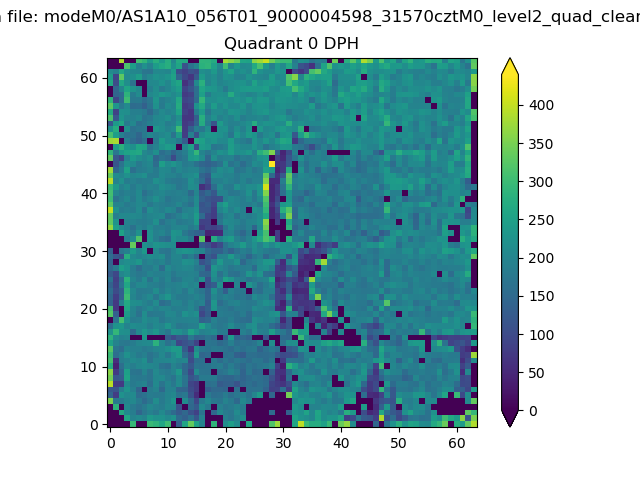 |
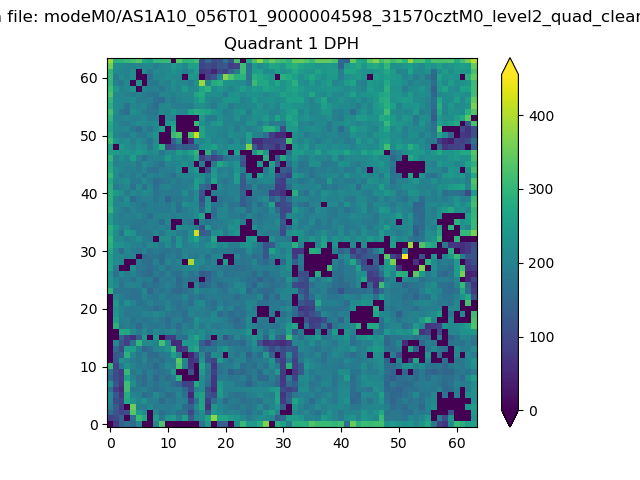 |
Quadrant B |
|---|---|---|---|
| Quadrant D | 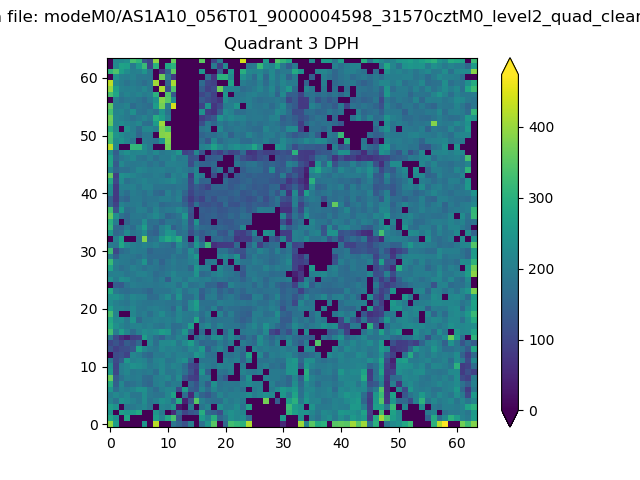 |
 |
Quadrant C |
| Plot type | Count rate plots | Images |
|---|---|---|
| Comparison with Poisson distribution Blue bars denote a histogram of data divided into 1 sec bins. Red curve is a Poisson curve with rate = median count rate of data. |
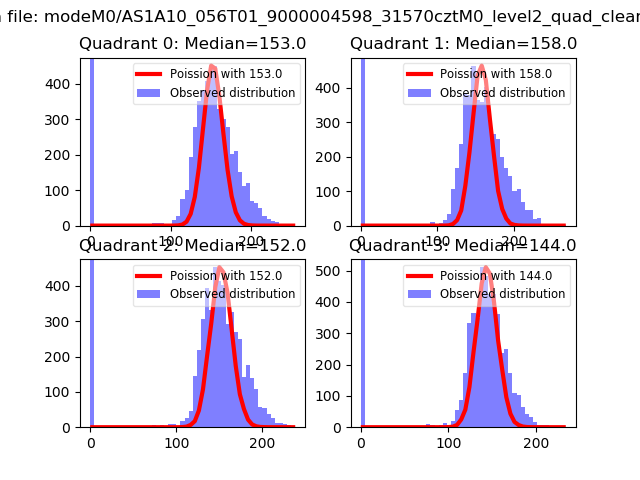 |
 |
| Quadrant-wise count rates Data is divided into 100 sec bins |
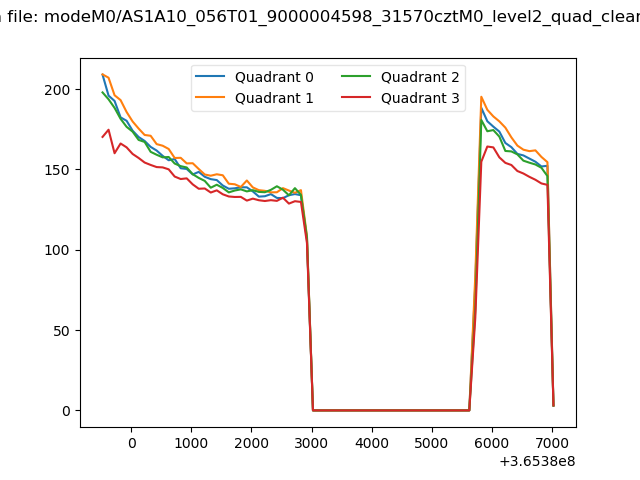 |
|
| Module-wise count rates for Quadrant A Data is divided into 100 sec bins |
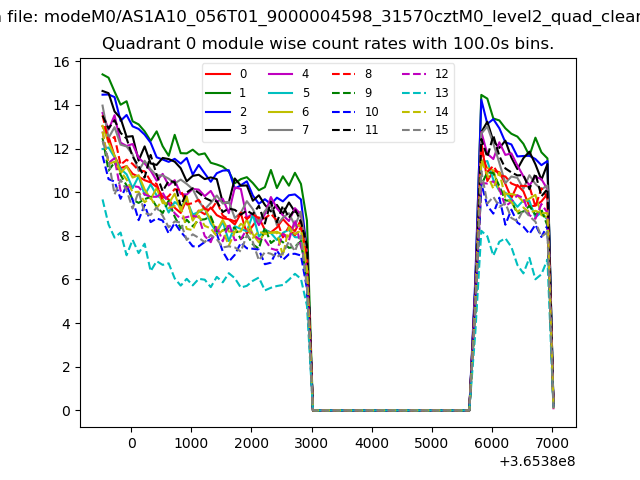 |
 |
| Module-wise count rates for Quadrant B Data is divided into 100 sec bins |
 |
 |
| Module-wise count rates for Quadrant C Data is divided into 100 sec bins |
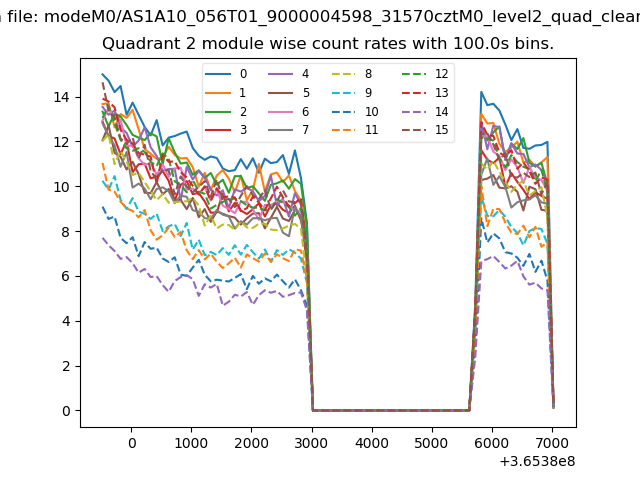 |
 |
| Module-wise count rates for Quadrant D Data is divided into 100 sec bins |
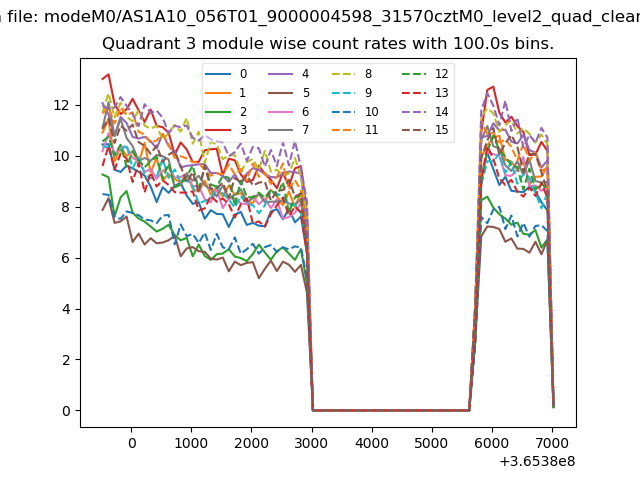 |
 |
| Parameter | Plot |
|---|---|
| CZT HV Monitor | 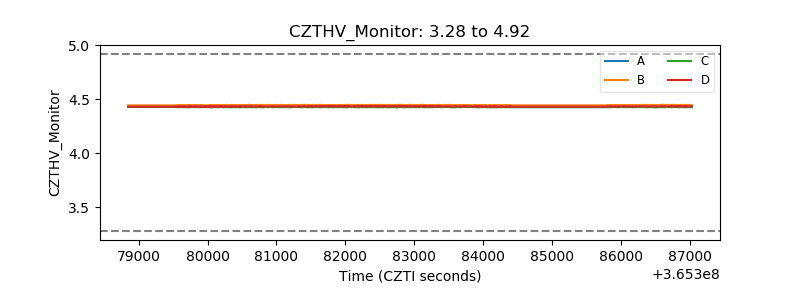 |
| D_VDD |  |
| Temperature 1 | 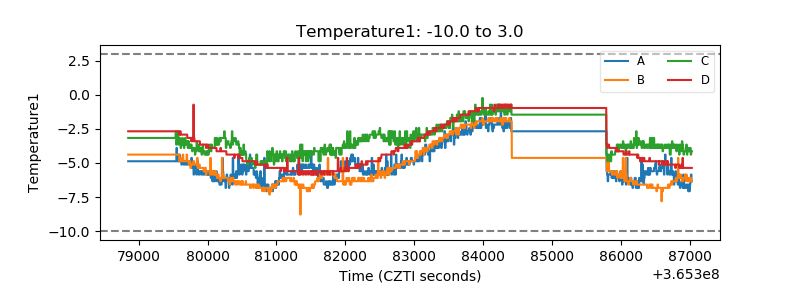 |
| Veto HV Monitor | 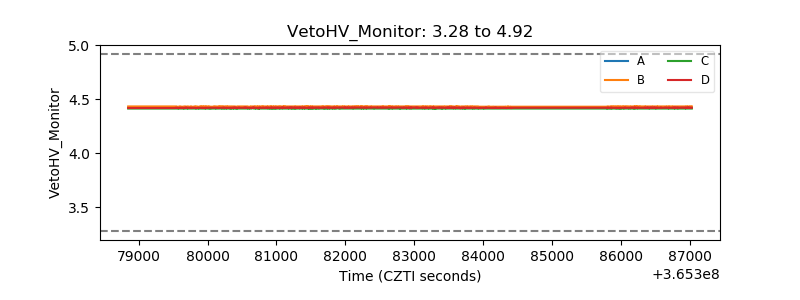 |
| Veto LLD |  |
| Alpha Counter | 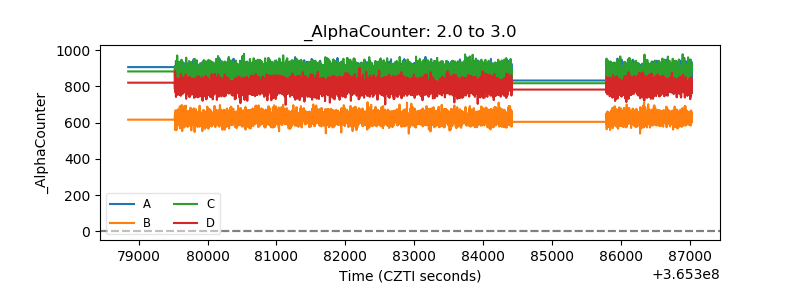 |
| _CPM_Rate | 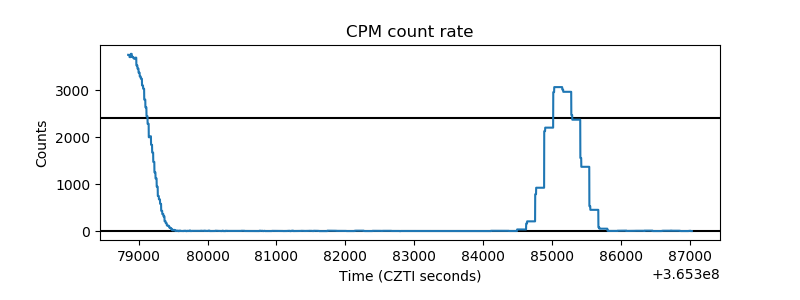 |
| CZT Counter | 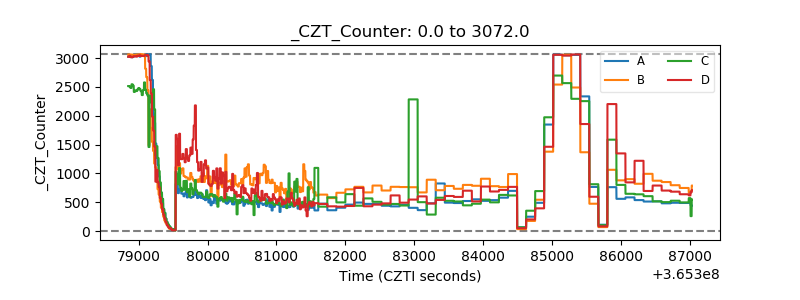 |
| +2.5 Volts monitor |  |
| +5 Volts monitor |  |
| _ROLL_ROT |  |
| _Roll_DEC | 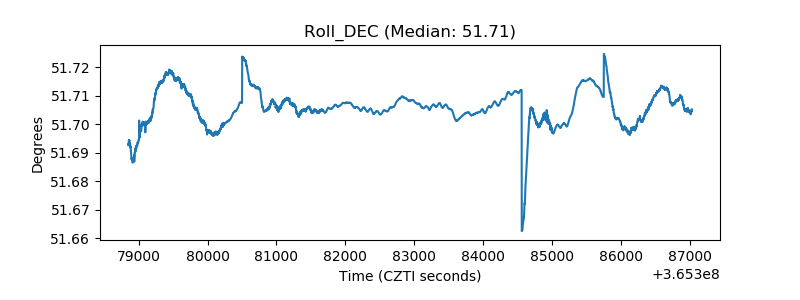 |
| _Roll_RA | 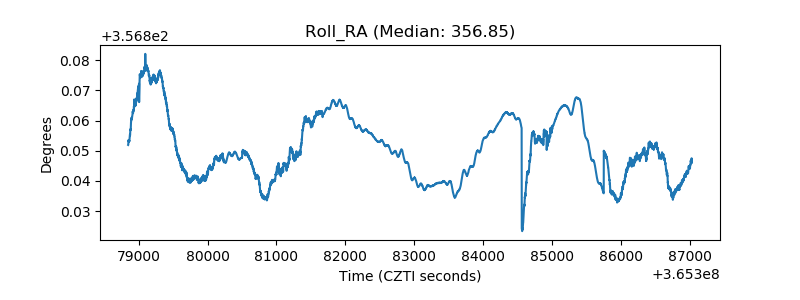 |
| Veto Counter | 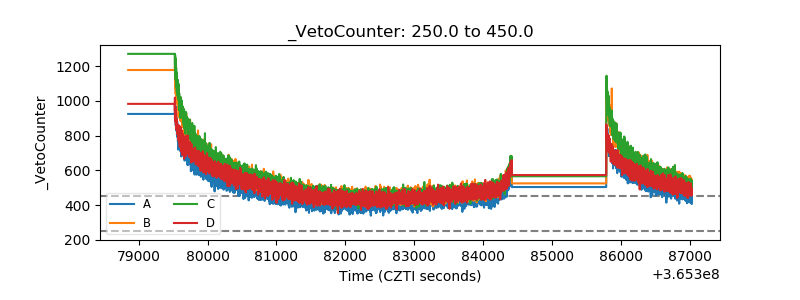 |