| Param | Original file | Final file |
|---|---|---|
| Filename | modeM0/AS1A10_056T01_9000004598_31571cztM0_level2.evt | modeM0/AS1A10_056T01_9000004598_31571cztM0_level2_quad_clean.evt |
| Size (bytes) | 354,795,840 | 77,264,640 |
| Size | 338.4 MB | 73.7 MB |
| Events in quadrant A | 1,946,330 | 520,604 |
| Events in quadrant B | 3,239,696 | 536,883 |
| Events in quadrant C | 2,430,787 | 509,855 |
| Events in quadrant D | 2,850,940 | 484,998 |
| Mode M0 | |||
|---|---|---|---|
| Quadrant | BADHDUFLAG | Total packets | Discarded packets |
| A | 0 | 8592 | 162 |
| B | 0 | 12785 | 223 |
| C | 0 | 9972 | 167 |
| D | 0 | 11495 | 224 |
| Mode M9 | |||
|---|---|---|---|
| Quadrant | BADHDUFLAG | Total packets | Discarded packets |
| A | 0 | 10 | 1 |
| B | 0 | 10 | 1 |
| C | 0 | 10 | 0 |
| D | 0 | 10 | 0 |
| Mode SS | |||
|---|---|---|---|
| Quadrant | BADHDUFLAG | Total packets | Discarded packets |
| A | 0 | 83 | 1 |
| B | 0 | 83 | 1 |
| C | 0 | 82 | 0 |
| D | 0 | 82 | 0 |
| Quadrant | Total seconds | Saturated seconds | Saturation percentage |
|---|---|---|---|
| A | 4074 | 3 | 0.073638% |
| B | 4078 | 29 | 0.711133% |
| C | 4076 | 93 | 2.281649% |
| D | 4077 | 62 | 1.520726% |
Noise dominated data is calculated using 1-second bins in cleaned event files. If a bin has >2000 counts, and if more than 50% of those come from <1% of pixels, then it is considered to be noise-dominated and hence unusable.
| Quadrant | # 1 sec bins | Bins with >0 counts | Bins with >2000 counts | High rate bins dominated by noise | Noise dominated (total time) | Noise dominated (detector-on time) | Marked lightcurve |
|---|---|---|---|---|---|---|---|
| A | 6715 | 4086 | 0 | 0 | 0.00% | 0.00% | 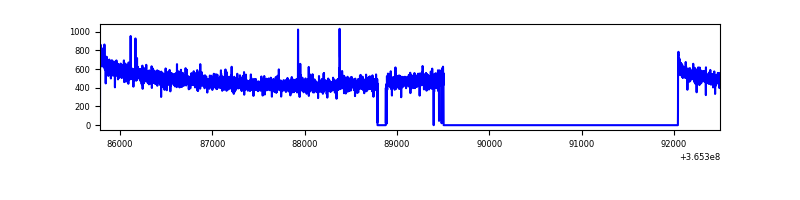 |
| B | 6715 | 4089 | 7 | 7 | 0.10% | 0.17% | 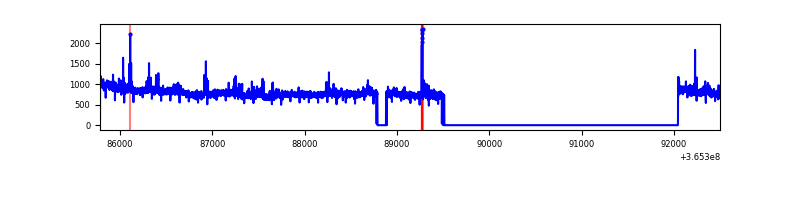 |
| C | 6715 | 4087 | 17 | 17 | 0.25% | 0.42% |  |
| D | 6715 | 4087 | 41 | 41 | 0.61% | 1.00% | 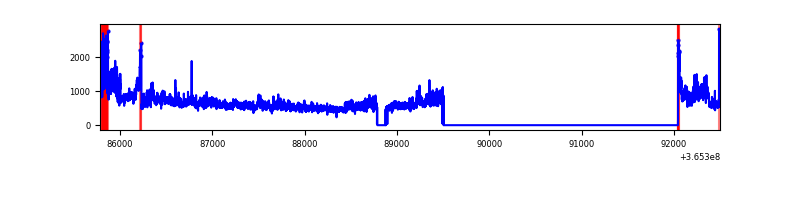 |
Top three noisy pixels from each quadrant. If the there are fewer than three noisy pixels in the level2.evt file, extra rows are filled as -1
| Pixel properties | Quadrant properties | ||||||
|---|---|---|---|---|---|---|---|
| Quadrant | DetID | PixID | Counts | Sigma | Mean | Median | Sigma |
| A | 13 | 254 | 7259 | 67.88 | 502 | 493 | 99.7 |
| A | 8 | 255 | 7038 | 65.66 | 502 | 493 | 99.7 |
| A | 3 | 137 | 4791 | 43.12 | 502 | 493 | 99.7 |
| B | 6 | 159 | 1131821 | 11753.15 | 509 | 498 | 96.3 |
| B | 4 | 80 | 68774 | 709.31 | 509 | 498 | 96.3 |
| B | 0 | 190 | 20282 | 205.53 | 509 | 498 | 96.3 |
| C | 3 | 233 | 366381 | 3253.77 | 490 | 494 | 112.5 |
| C | 14 | 238 | 81478 | 720.18 | 490 | 494 | 112.5 |
| C | 0 | 10 | 23946 | 208.55 | 490 | 494 | 112.5 |
| D | 8 | 195 | 843462 | 7357.85 | 481 | 470 | 114.6 |
| D | 12 | 218 | 76108 | 660.19 | 481 | 470 | 114.6 |
| D | 7 | 223 | 27779 | 238.36 | 481 | 470 | 114.6 |
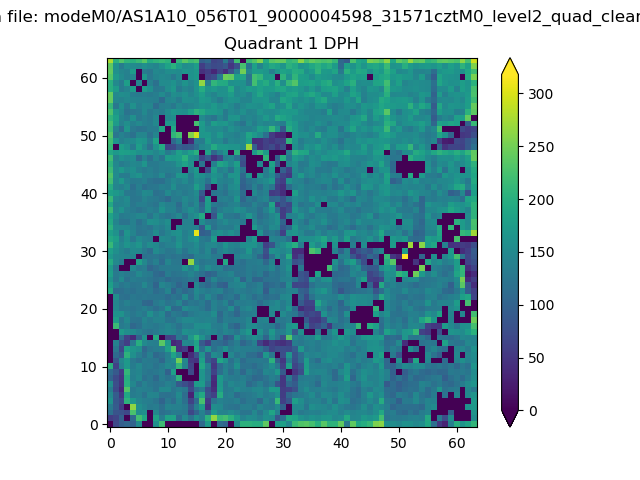
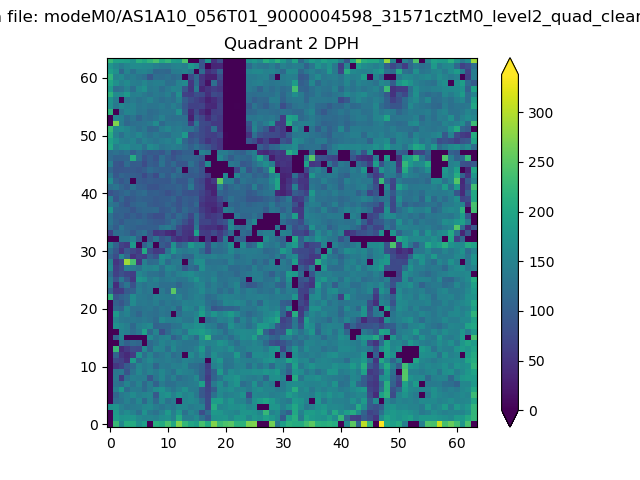
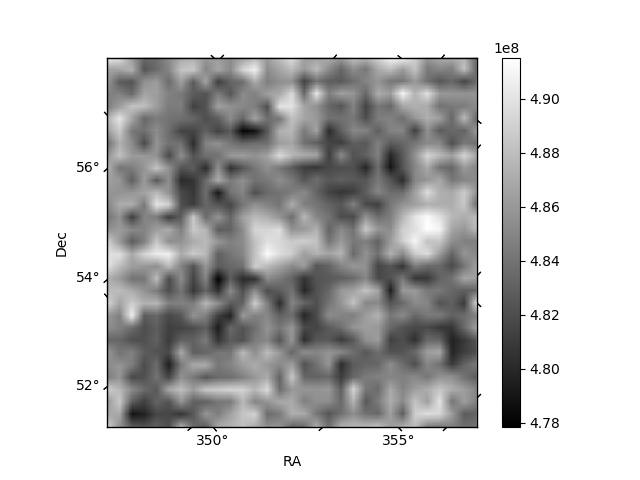
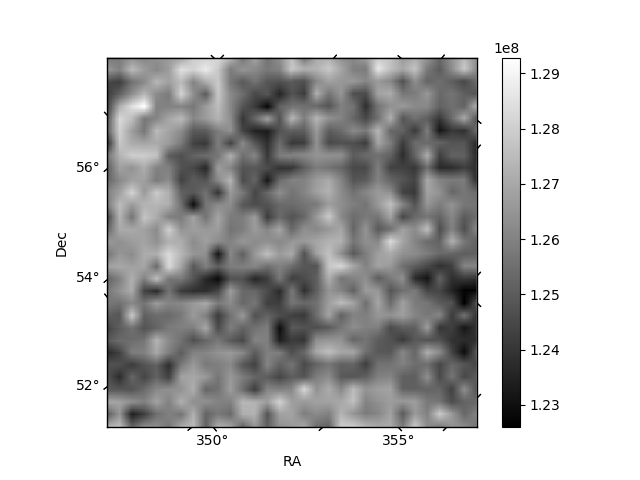
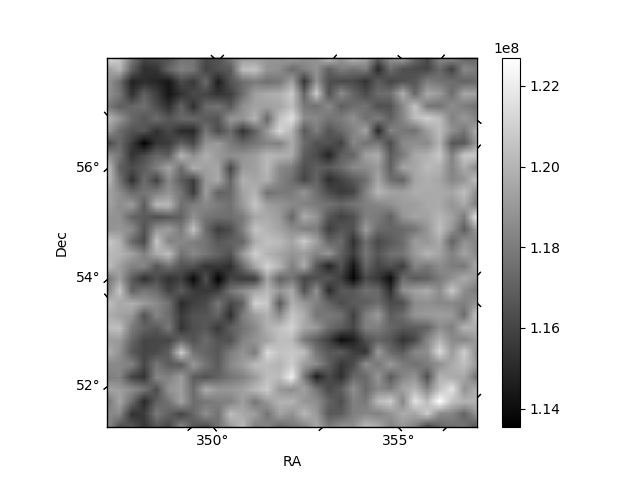
Histogram calculated using DETX and DETY for each event in the final _common_clean file
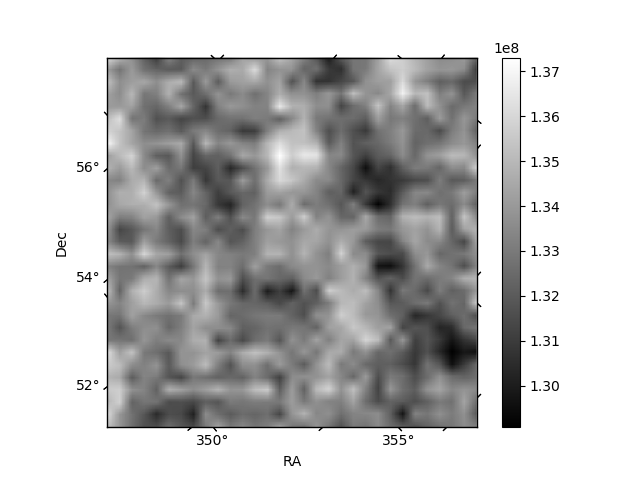
| Quadrant A | 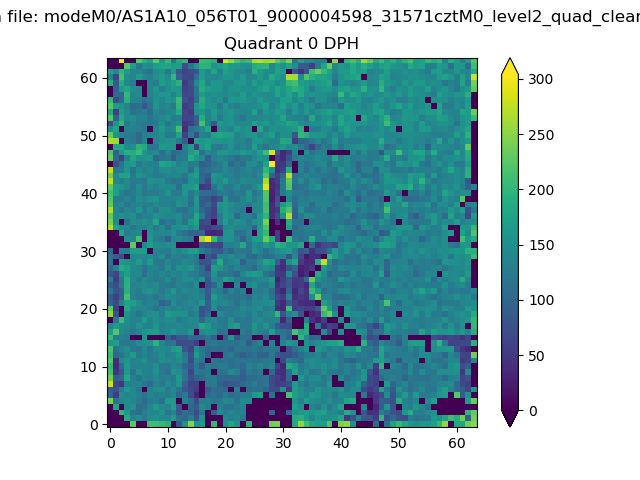 |
 |
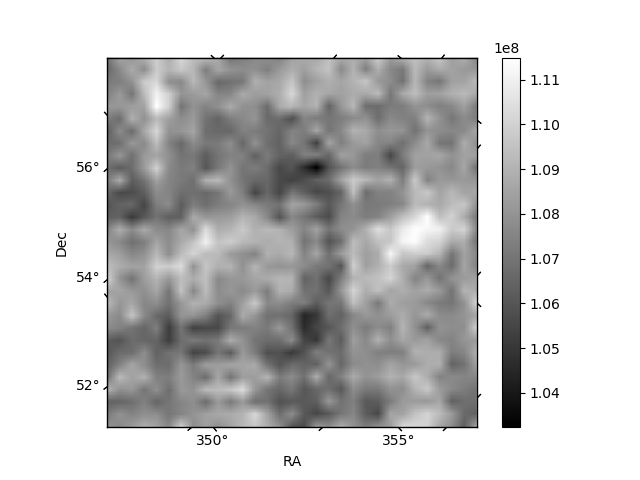
Quadrant B |
|---|---|---|---|
| Quadrant D | 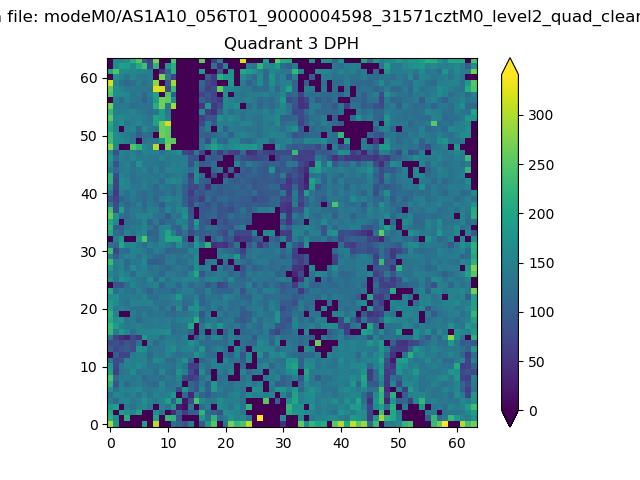 |
 |
Quadrant C |
| Plot type | Count rate plots | Images |
|---|---|---|
| Comparison with Poisson distribution Blue bars denote a histogram of data divided into 1 sec bins. Red curve is a Poisson curve with rate = median count rate of data. |
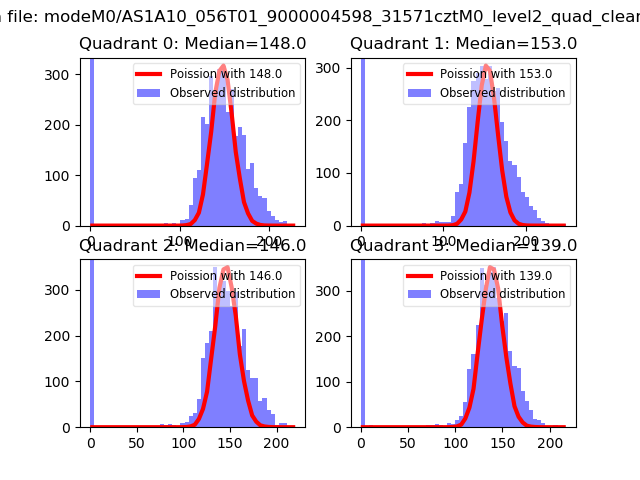 |
 |
| Quadrant-wise count rates Data is divided into 100 sec bins |
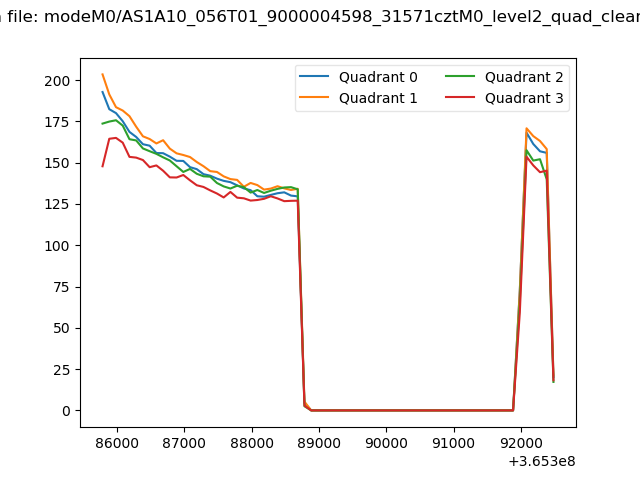 |
|
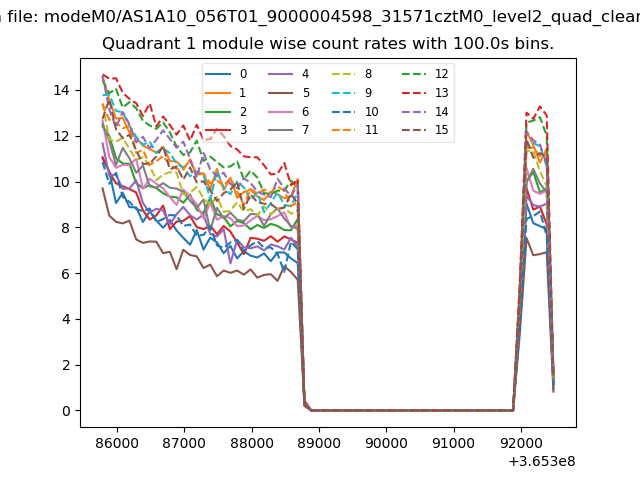
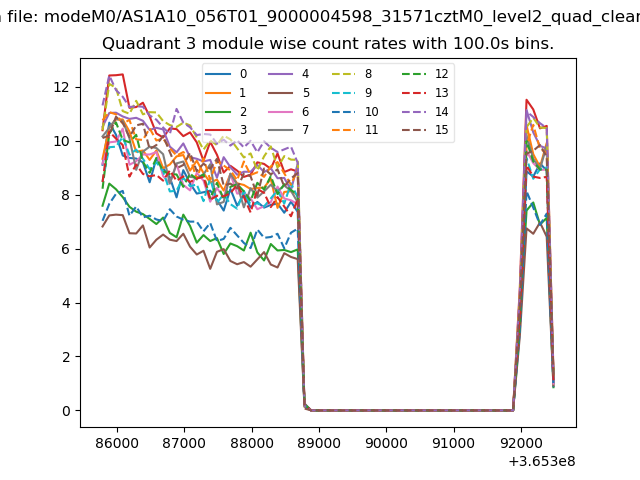
| Module-wise count rates for Quadrant A Data is divided into 100 sec bins |
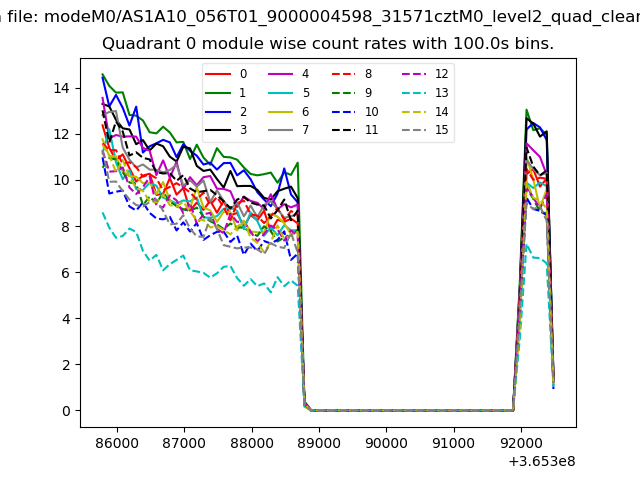 |
 |
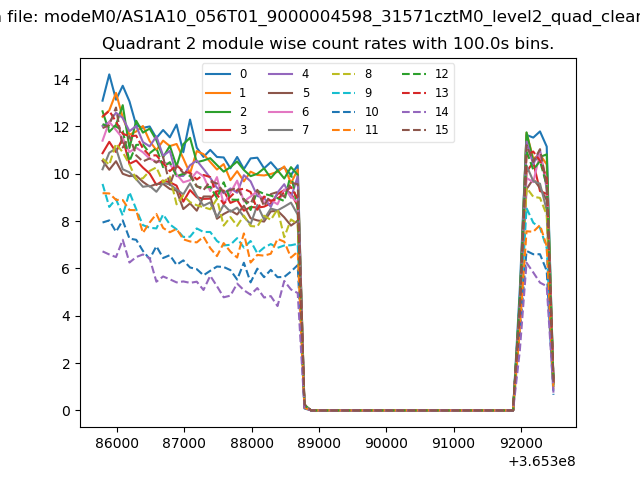
| Module-wise count rates for Quadrant B Data is divided into 100 sec bins |
 |
 |
| Module-wise count rates for Quadrant C Data is divided into 100 sec bins |
 |
 |
| Module-wise count rates for Quadrant D Data is divided into 100 sec bins |
 |
 |
| Parameter | Plot |
|---|---|
| CZT HV Monitor | 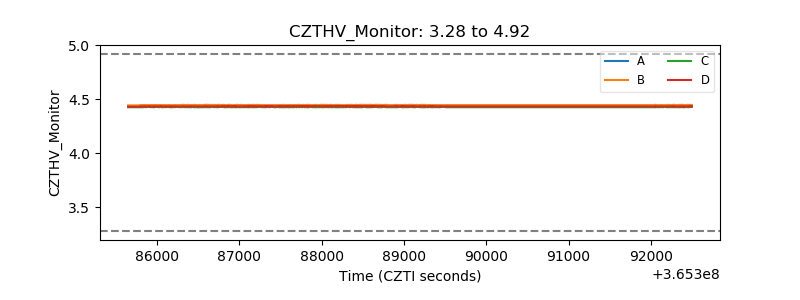 |
| D_VDD | 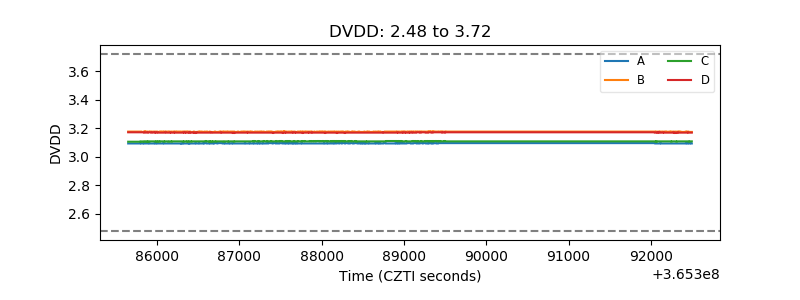 |
| Temperature 1 | 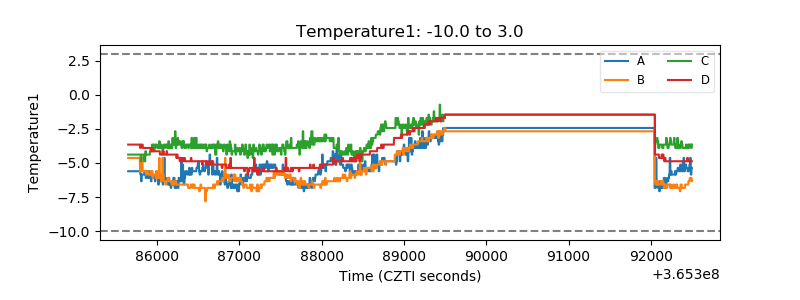 |
| Veto HV Monitor |  |
| Veto LLD |  |
| Alpha Counter | 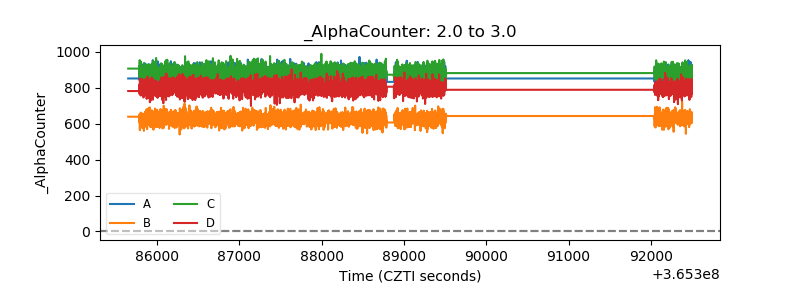 |
| _CPM_Rate | 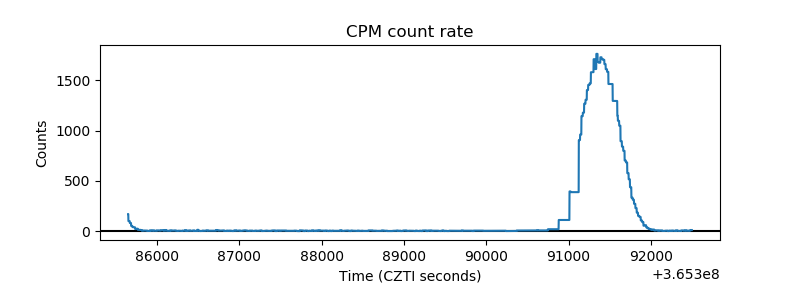 |
| CZT Counter | 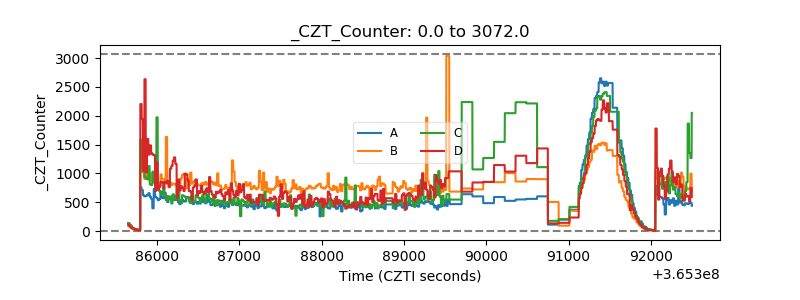 |
| +2.5 Volts monitor |  |
| +5 Volts monitor |  |
| _ROLL_ROT |  |
| _Roll_DEC | 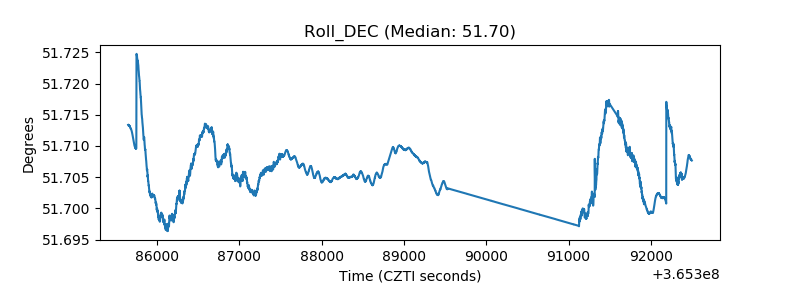 |
| _Roll_RA | 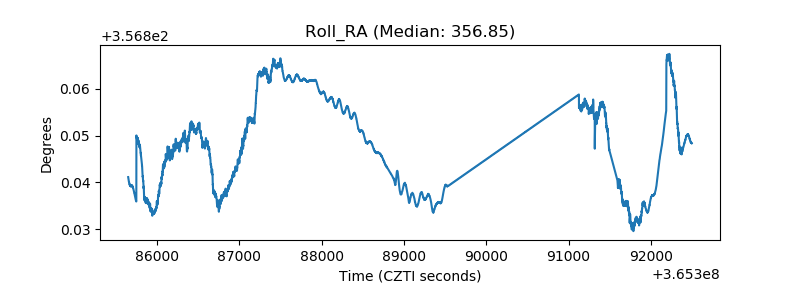 |
| Veto Counter |  |