| Param | Original file | Final file |
|---|---|---|
| Filename | modeM0/AS1A10_056T01_9000004598_31750cztM0_level2.evt | modeM0/AS1A10_056T01_9000004598_31750cztM0_level2_quad_clean.evt |
| Size (bytes) | 338,137,920 | 37,281,600 |
| Size | 322.5 MB | 35.6 MB |
| Events in quadrant A | 2,790,165 | 201,328 |
| Events in quadrant B | 2,778,146 | 232,731 |
| Events in quadrant C | 2,347,166 | 231,078 |
| Events in quadrant D | 2,098,327 | 227,205 |
| Mode M0 | |||
|---|---|---|---|
| Quadrant | BADHDUFLAG | Total packets | Discarded packets |
| A | 0 | 15100 | 4610 |
| B | 0 | 13703 | 3095 |
| C | 0 | 12065 | 2851 |
| D | 0 | 10813 | 2397 |
| Mode M9 | |||
|---|---|---|---|
| Quadrant | BADHDUFLAG | Total packets | Discarded packets |
| A | 0 | 7 | 4 |
| B | 0 | 6 | 2 |
| C | 0 | 5 | 1 |
| D | 0 | 4 | 0 |
| Mode SS | |||
|---|---|---|---|
| Quadrant | BADHDUFLAG | Total packets | Discarded packets |
| A | 0 | 87 | 11 |
| B | 0 | 89 | 22 |
| C | 0 | 92 | 16 |
| D | 0 | 88 | 21 |
| Quadrant | Total seconds | Saturated seconds | Saturation percentage |
|---|---|---|---|
| A | 3294 | 512 | 15.543412% |
| B | 3284 | 139 | 4.232643% |
| C | 3319 | 202 | 6.086171% |
| D | 3359 | 30 | 0.893123% |
Noise dominated data is calculated using 1-second bins in cleaned event files. If a bin has >2000 counts, and if more than 50% of those come from <1% of pixels, then it is considered to be noise-dominated and hence unusable.
| Quadrant | # 1 sec bins | Bins with >0 counts | Bins with >2000 counts | High rate bins dominated by noise | Noise dominated (total time) | Noise dominated (detector-on time) | Marked lightcurve |
|---|---|---|---|---|---|---|---|
| A | 4188 | 3454 | 208 | 208 | 4.97% | 6.02% | 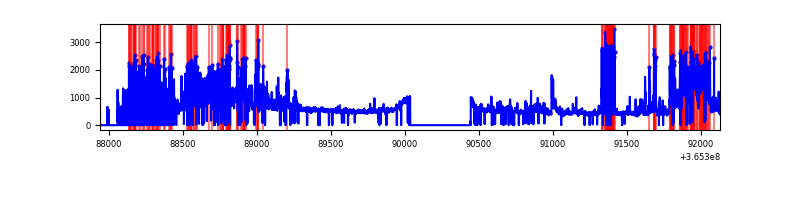 |
| B | 4172 | 3521 | 46 | 46 | 1.10% | 1.31% | 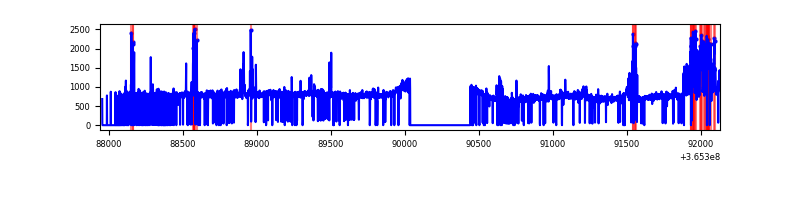 |
| C | 4181 | 3523 | 25 | 25 | 0.60% | 0.71% | 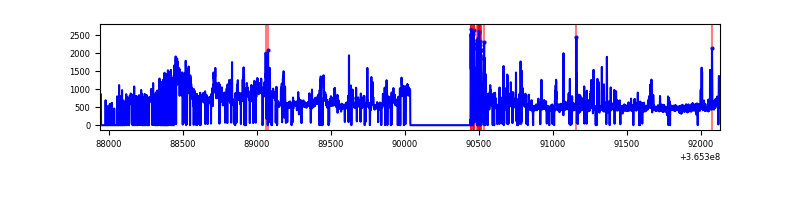 |
| D | 4168 | 3548 | 3 | 3 | 0.07% | 0.08% | 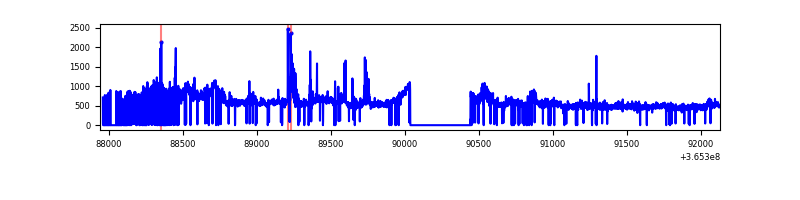 |
Top three noisy pixels from each quadrant. If the there are fewer than three noisy pixels in the level2.evt file, extra rows are filled as -1
| Pixel properties | Quadrant properties | ||||||
|---|---|---|---|---|---|---|---|
| Quadrant | DetID | PixID | Counts | Sigma | Mean | Median | Sigma |
| A | 0 | 13 | 1313881 | 16589.81 | 382 | 374 | 79.2 |
| A | 13 | 254 | 5658 | 66.74 | 382 | 374 | 79.2 |
| A | 3 | 137 | 4041 | 46.31 | 382 | 374 | 79.2 |
| B | 6 | 159 | 877264 | 10998.04 | 406 | 395 | 79.7 |
| B | 4 | 80 | 197404 | 2470.97 | 406 | 395 | 79.7 |
| B | 5 | 255 | 49081 | 610.64 | 406 | 395 | 79.7 |
| C | 3 | 233 | 391322 | 4109.28 | 396 | 398 | 95.1 |
| C | 0 | 10 | 321233 | 3372.52 | 396 | 398 | 95.1 |
| C | 14 | 238 | 67358 | 703.86 | 396 | 398 | 95.1 |
| D | 8 | 195 | 410772 | 4111.22 | 408 | 396 | 99.8 |
| D | 2 | 250 | 67940 | 676.67 | 408 | 396 | 99.8 |
| D | 12 | 233 | 61894 | 616.1 | 408 | 396 | 99.8 |
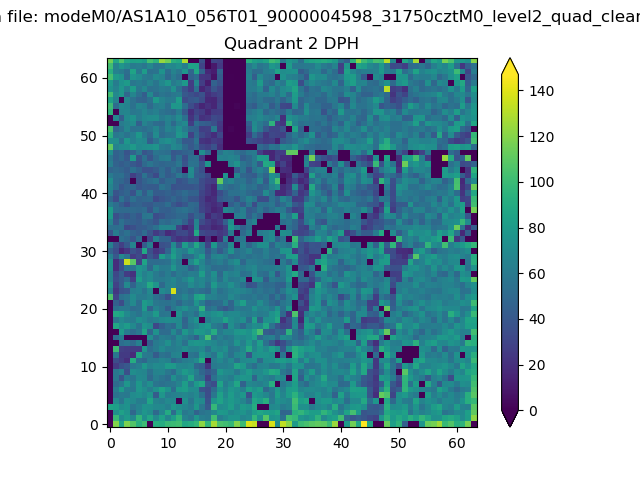
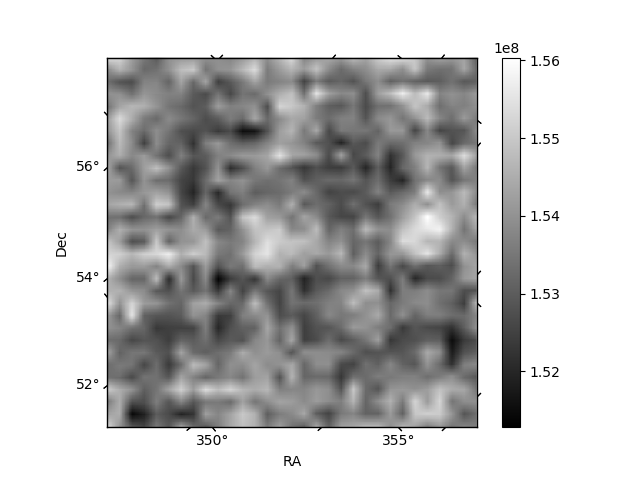
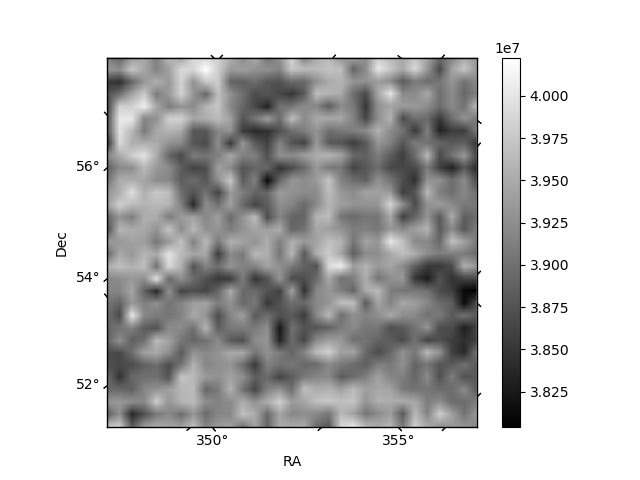
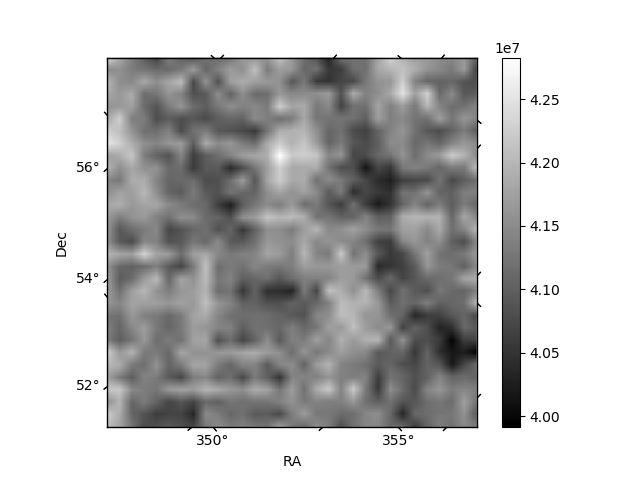
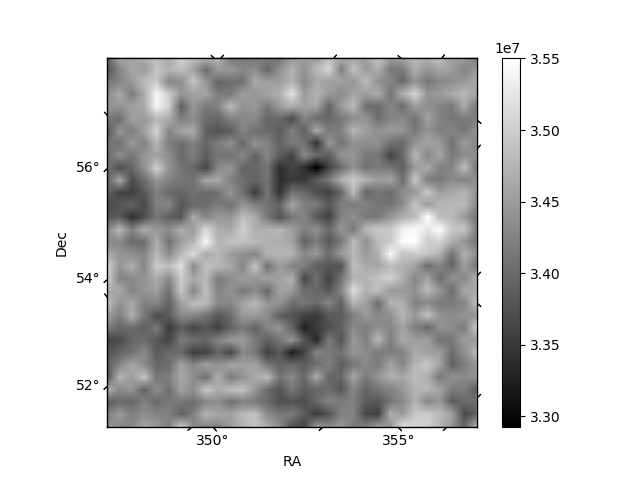
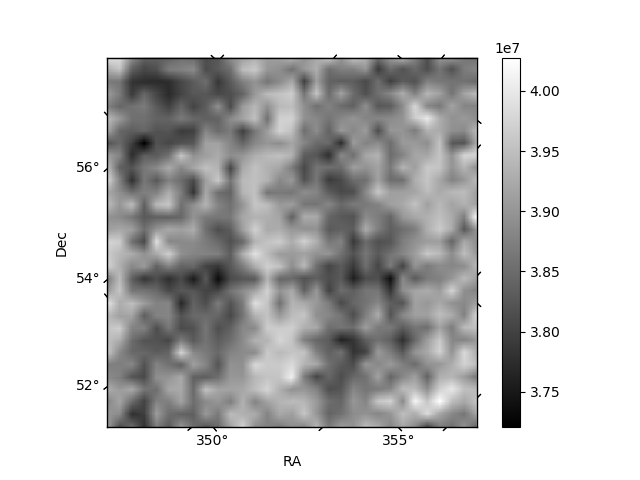
Histogram calculated using DETX and DETY for each event in the final _common_clean file
| Quadrant A | 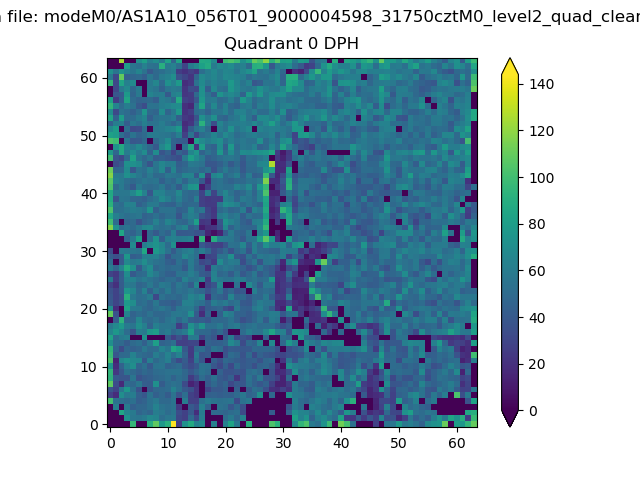 |
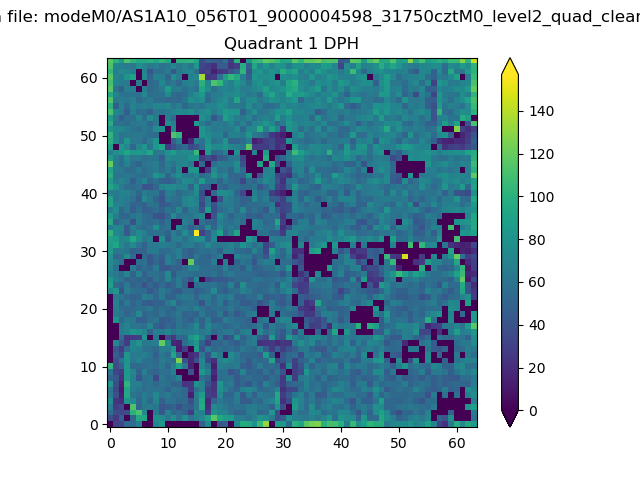 |
Quadrant B |
|---|---|---|---|
| Quadrant D | 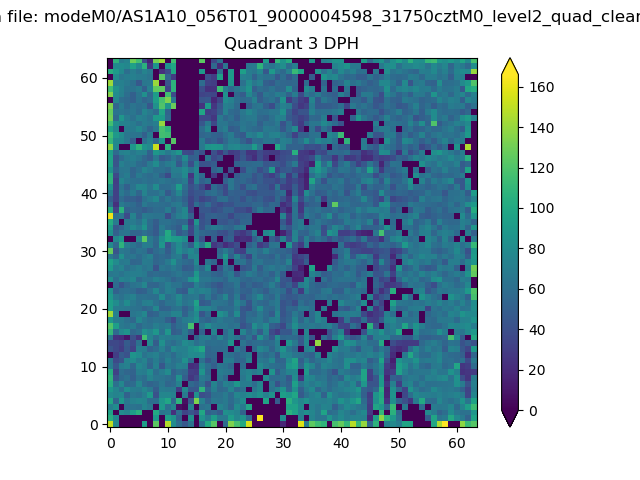 |
 |
Quadrant C |
| Plot type | Count rate plots | Images |
|---|---|---|
| Comparison with Poisson distribution Blue bars denote a histogram of data divided into 1 sec bins. Red curve is a Poisson curve with rate = median count rate of data. |
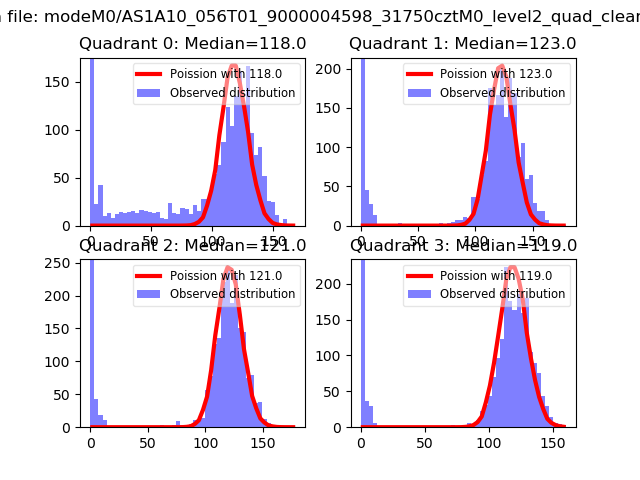 |
 |
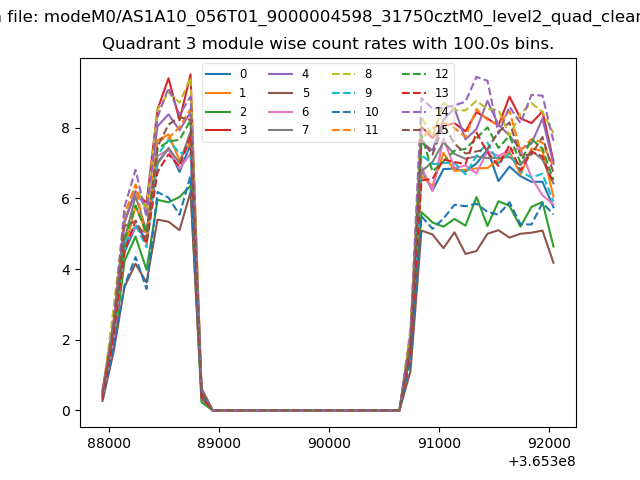
| Quadrant-wise count rates Data is divided into 100 sec bins |
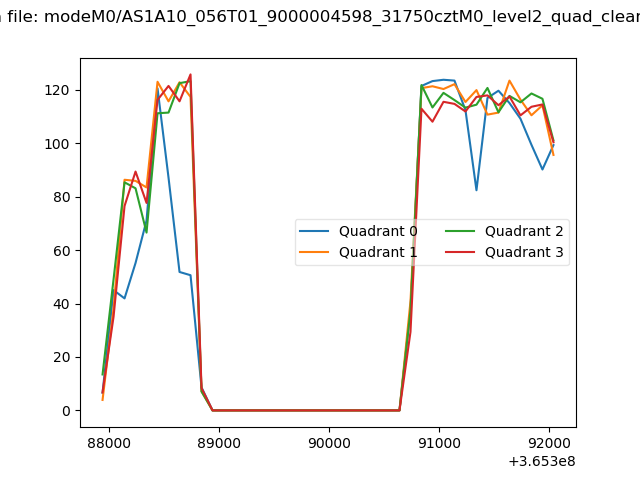 |
|
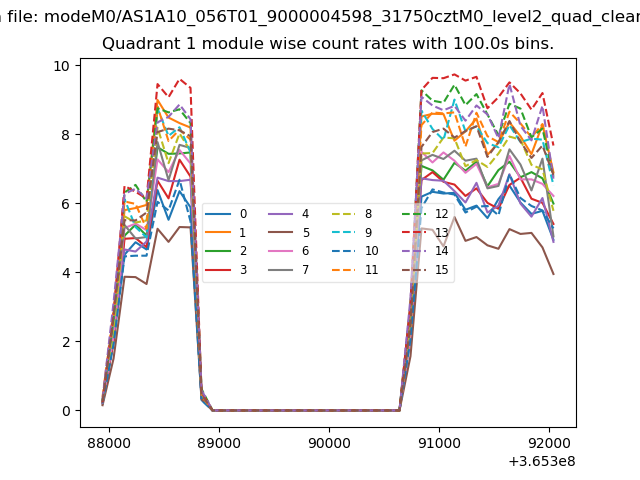
| Module-wise count rates for Quadrant A Data is divided into 100 sec bins |
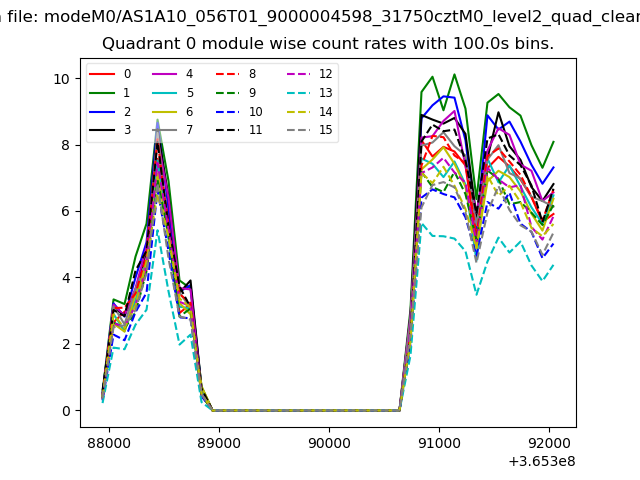 |
 |
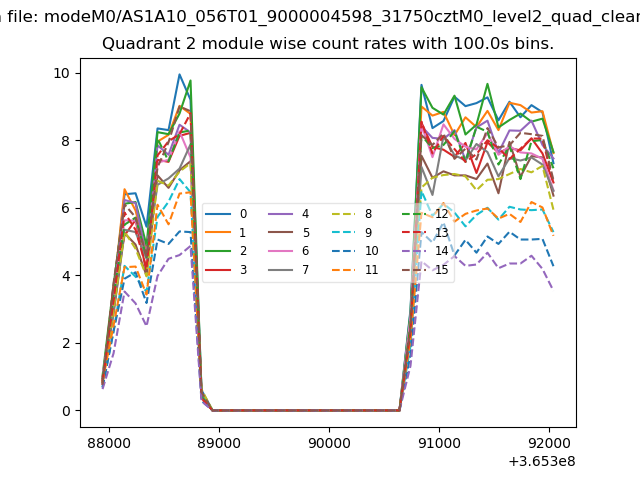
| Module-wise count rates for Quadrant B Data is divided into 100 sec bins |
 |
 |
| Module-wise count rates for Quadrant C Data is divided into 100 sec bins |
 |
 |
| Module-wise count rates for Quadrant D Data is divided into 100 sec bins |
 |
 |
| Parameter | Plot |
|---|---|
| CZT HV Monitor | 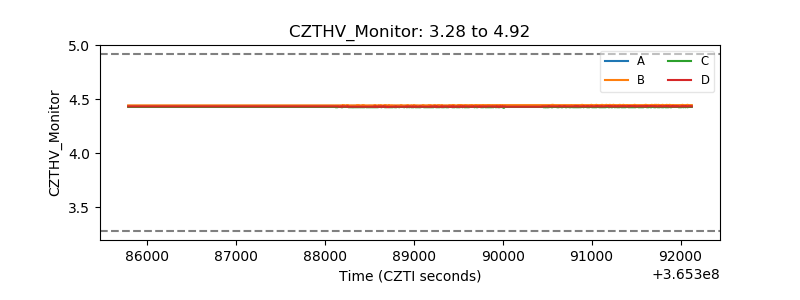 |
| D_VDD | 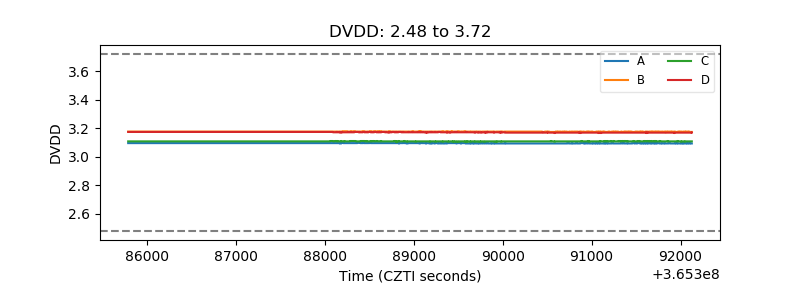 |
| Temperature 1 | 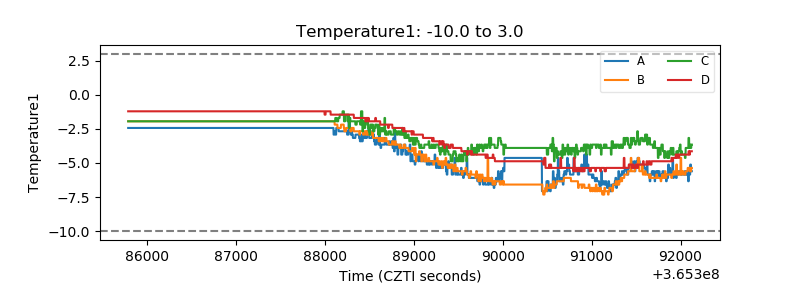 |
| Veto HV Monitor | 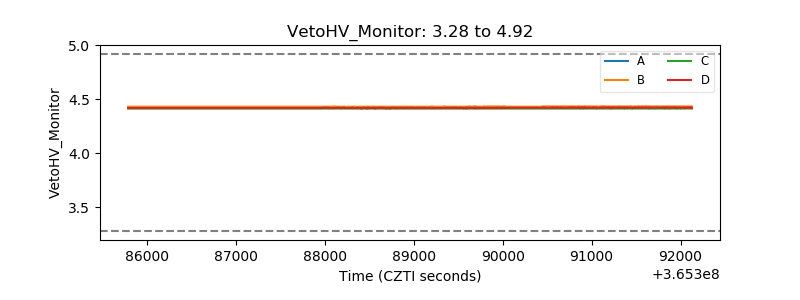 |
| Veto LLD | 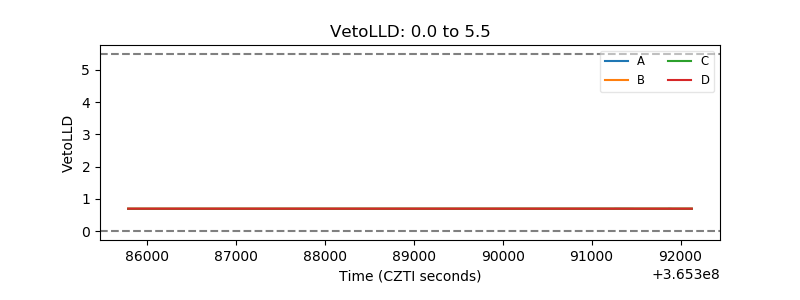 |
| Alpha Counter | 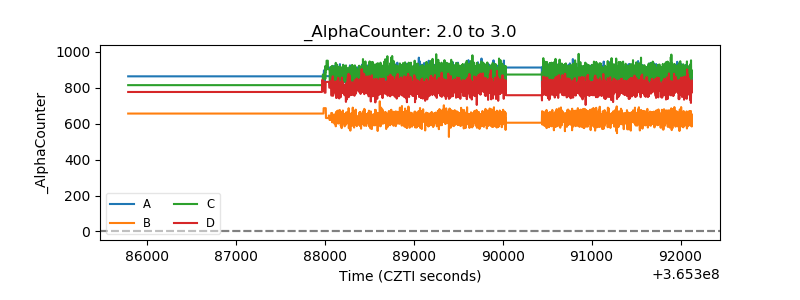 |
| _CPM_Rate | 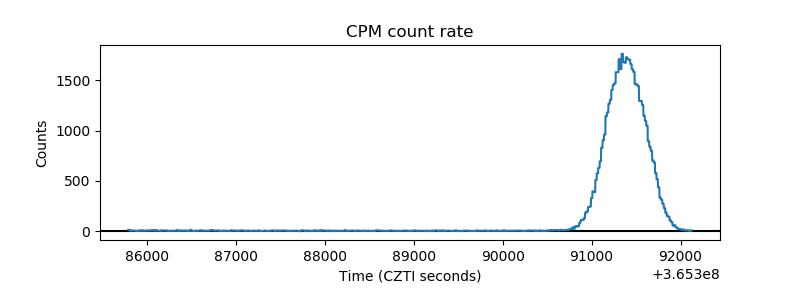 |
| CZT Counter | 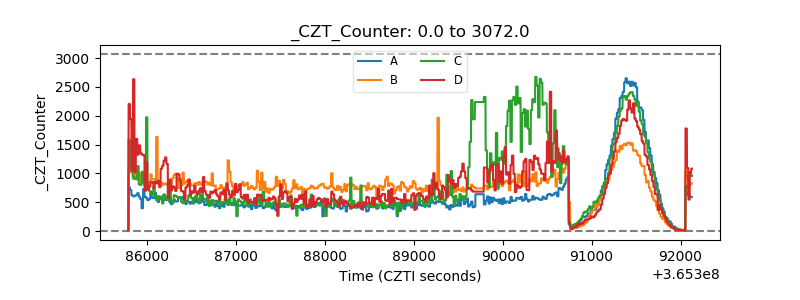 |
| +2.5 Volts monitor | 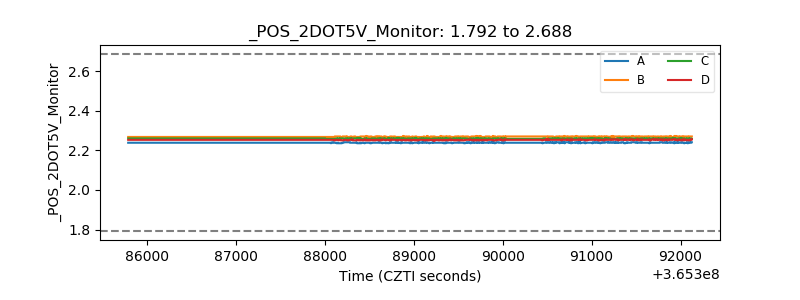 |
| +5 Volts monitor | 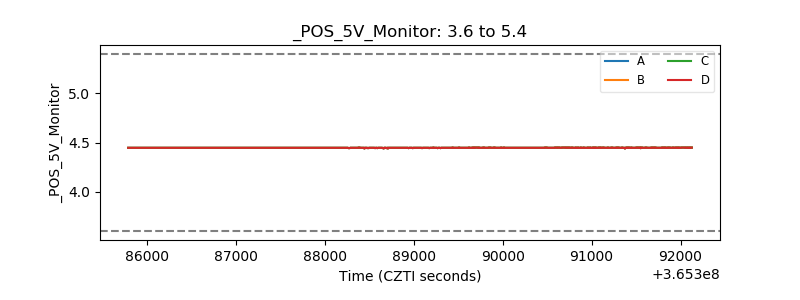 |
| _ROLL_ROT | 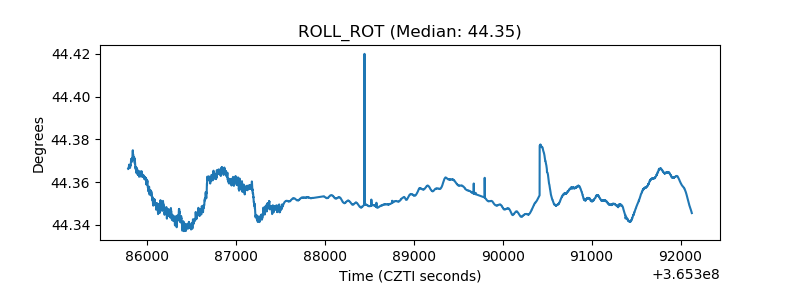 |
| _Roll_DEC | 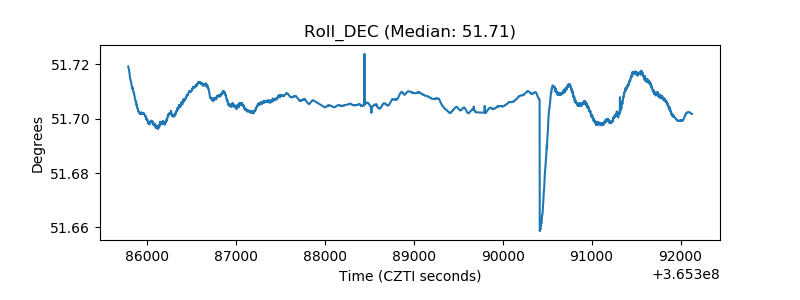 |
| _Roll_RA | 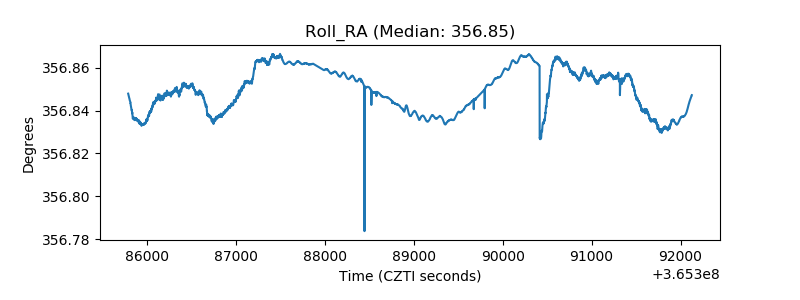 |
| Veto Counter | 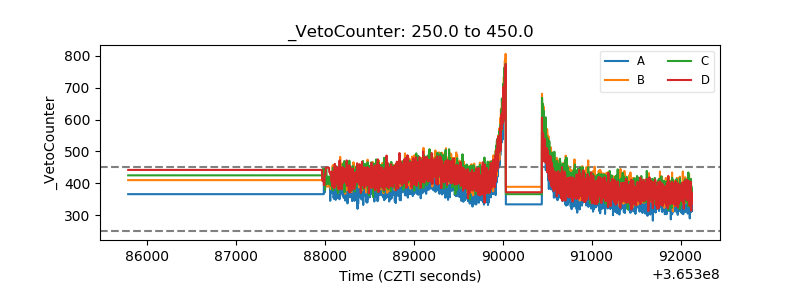 |