| Param | Original file | Final file |
|---|---|---|
| Filename | modeM0/AS1A10_082T10_9000004602cztM0_level2.fits | modeM0/AS1A10_082T10_9000004602cztM0_level2_quad_clean.evt |
| Size (bytes) | 285,117,120 | 284,221,440 |
| Size | 271.9 MB | 271.1 MB |
| Events in quadrant A | 1,758,608 | 1,758,661 |
| Events in quadrant B | 1,638,094 | 1,692,011 |
| Events in quadrant C | 1,633,694 | 1,518,784 |
| Events in quadrant D | 1,486,678 | 1,522,153 |
| Mode M9 | |||
|---|---|---|---|
| Quadrant | BADHDUFLAG | Total packets | Discarded packets |
| A | 0 | 30 | 0 |
| B | 0 | 30 | 0 |
| C | 0 | 30 | 0 |
| D | 0 | 30 | 0 |
| Mode M0 | |||
|---|---|---|---|
| Quadrant | BADHDUFLAG | Total packets | Discarded packets |
| A | 0 | 62972 | 0 |
| B | 0 | 99457 | 0 |
| C | 0 | 94268 | 0 |
| D | 0 | 80405 | 0 |
| Mode SS | |||
|---|---|---|---|
| Quadrant | BADHDUFLAG | Total packets | Discarded packets |
| A | 0 | 630 | 0 |
| B | 0 | 630 | 0 |
| C | 0 | 630 | 0 |
| D | 0 | 630 | 0 |
| Quadrant | Total seconds | Saturated seconds | Saturation percentage |
|---|---|---|---|
| A | 30780 | 609 | 1.978558% |
| B | 30780 | 1463 | 4.753086% |
| C | 30780 | 3043 | 9.886290% |
| D | 30780 | 1244 | 4.041585% |
Noise dominated data is calculated using 1-second bins in cleaned event files. If a bin has >2000 counts, and if more than 50% of those come from <1% of pixels, then it is considered to be noise-dominated and hence unusable.
| Quadrant | # 1 sec bins | Bins with >0 counts | Bins with >2000 counts | High rate bins dominated by noise | Noise dominated (total time) | Noise dominated (detector-on time) | Marked lightcurve |
|---|---|---|---|---|---|---|---|
| A | 33815 | 30772 | 0 | 0 | 0.00% | 0.00% |  |
| B | 33814 | 30769 | 0 | 0 | 0.00% | 0.00% | 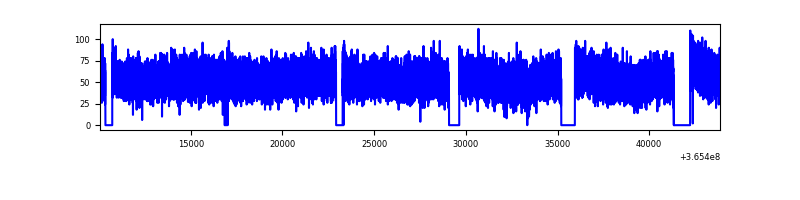 |
| C | 33814 | 30759 | 0 | 0 | 0.00% | 0.00% | 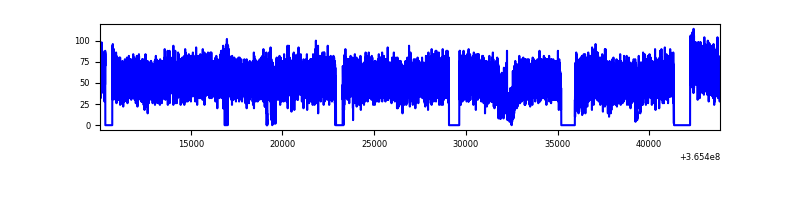 |
| D | 33815 | 30774 | 0 | 0 | 0.00% | 0.00% | 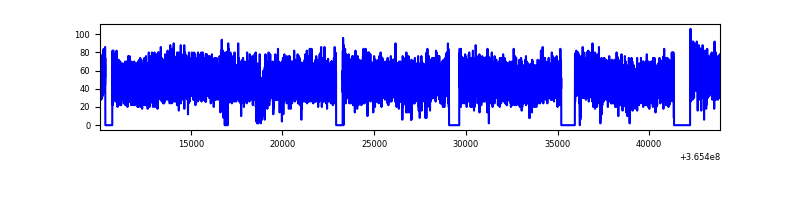 |
Top three noisy pixels from each quadrant. If the there are fewer than three noisy pixels in the level2.evt file, extra rows are filled as -1
| Pixel properties | Quadrant properties | ||||||
|---|---|---|---|---|---|---|---|
| Quadrant | DetID | PixID | Counts | Sigma | Mean | Median | Sigma |
| A | 0 | 29 | 1667 | 10.66 | 457 | 429 | 116.2 |
| A | 7 | 110 | 1387 | 8.25 | 457 | 429 | 116.2 |
| A | 15 | 236 | 1305 | 7.54 | 457 | 429 | 116.2 |
| B | 2 | 9 | 1292 | 9.97 | 433 | 413 | 88.2 |
| B | 14 | 254 | 1118 | 8.0 | 433 | 413 | 88.2 |
| B | 3 | 80 | 1105 | 7.85 | 433 | 413 | 88.2 |
| C | 12 | 241 | 1156 | 6.79 | 433 | 404 | 110.7 |
| C | 3 | 187 | 1116 | 6.43 | 433 | 404 | 110.7 |
| C | 2 | 191 | 1076 | 6.07 | 433 | 404 | 110.7 |
| D | 3 | 14 | 1115 | 6.42 | 424 | 387 | 113.4 |
| D | 3 | 31 | 1055 | 5.89 | 424 | 387 | 113.4 |
| D | 10 | 189 | 1045 | 5.8 | 424 | 387 | 113.4 |
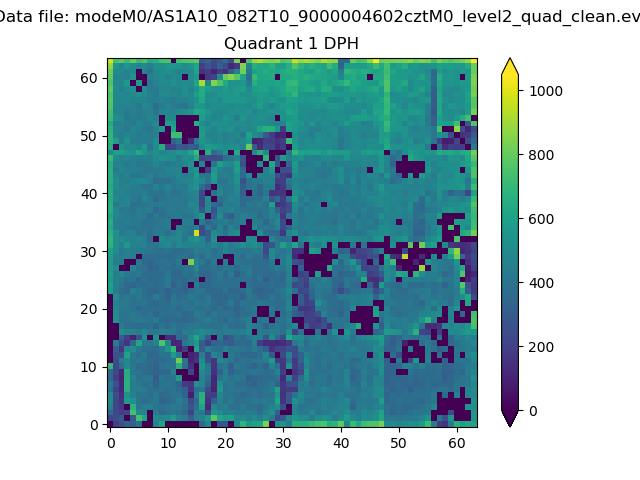
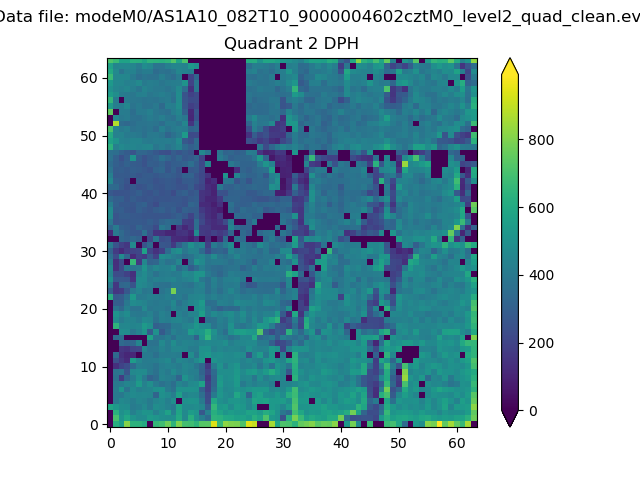
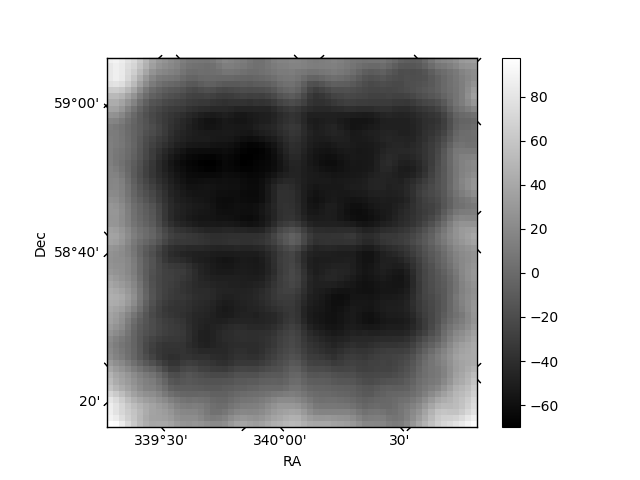
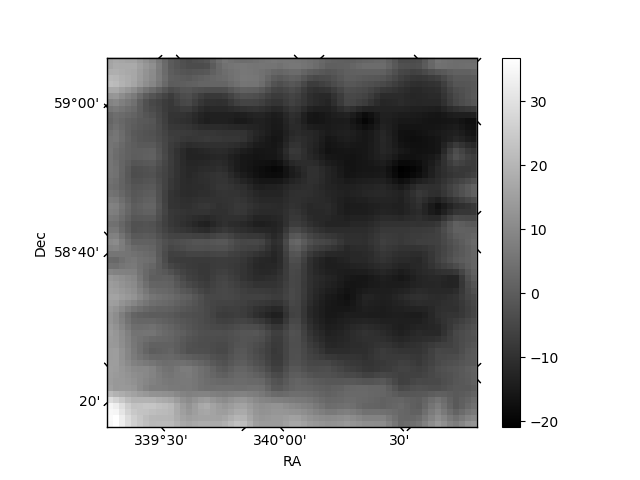
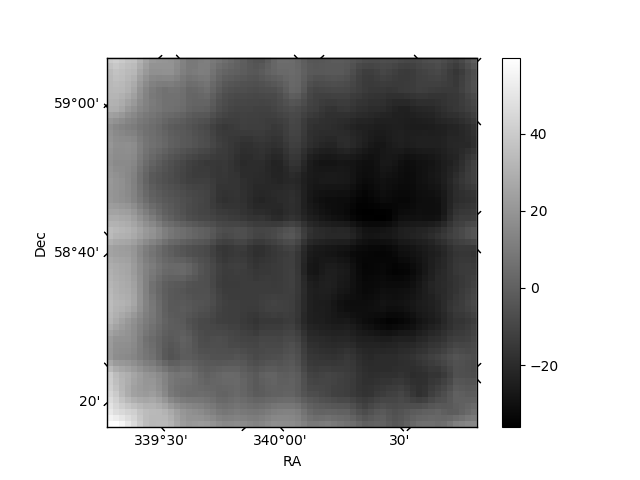
Histogram calculated using DETX and DETY for each event in the final _common_clean file
| Quadrant A | 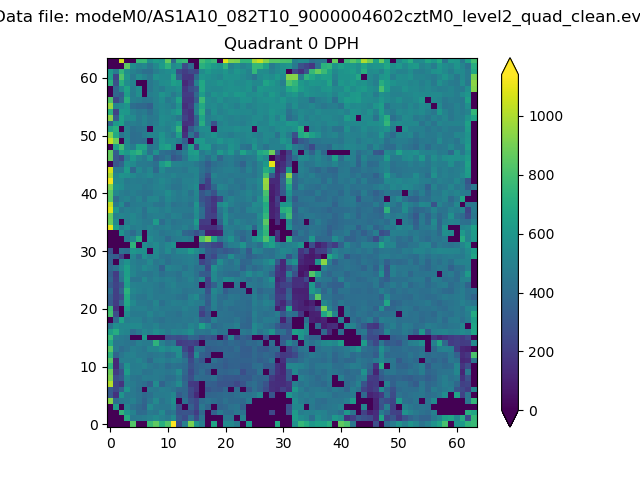 |
 |
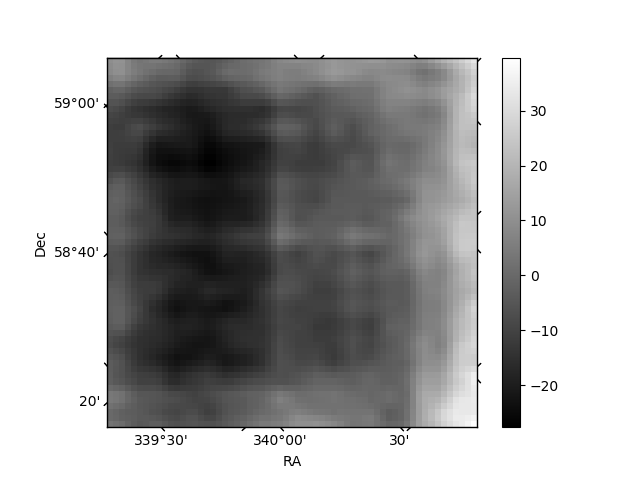
Quadrant B |
|---|---|---|---|
| Quadrant D | 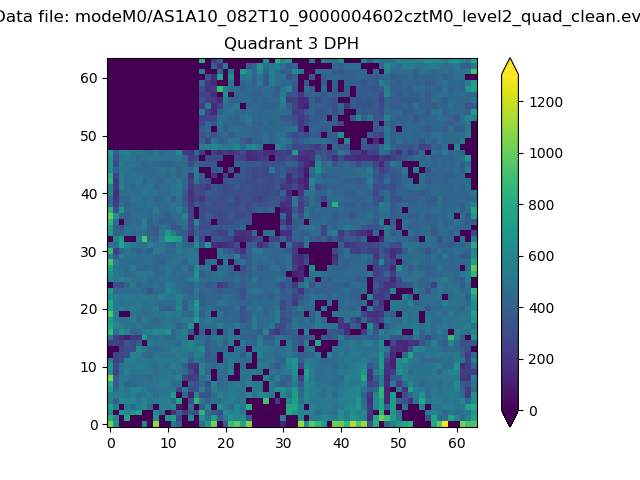 |
 |
Quadrant C |
| Plot type | Count rate plots | Images |
|---|---|---|
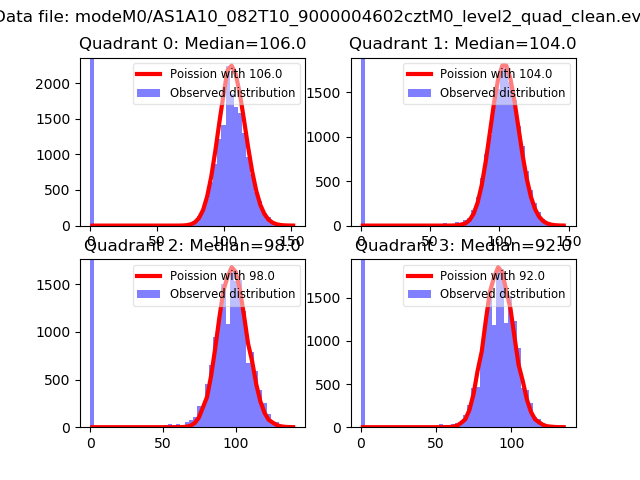
| Comparison with Poisson distribution Blue bars denote a histogram of data divided into 1 sec bins. Red curve is a Poisson curve with rate = median count rate of data. |
 |
 |
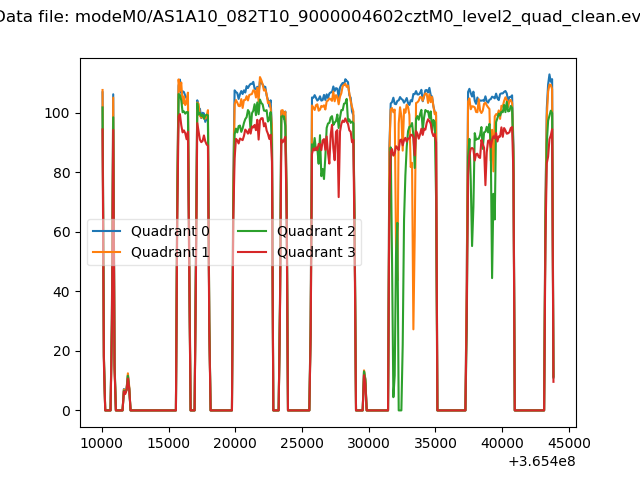
| Quadrant-wise count rates Data is divided into 100 sec bins |
 |
|
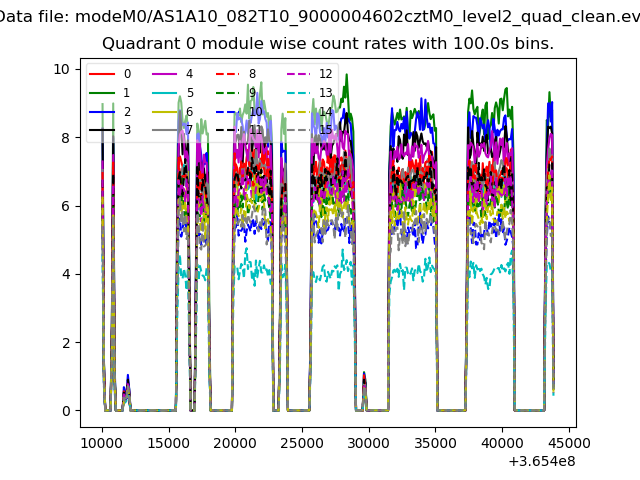
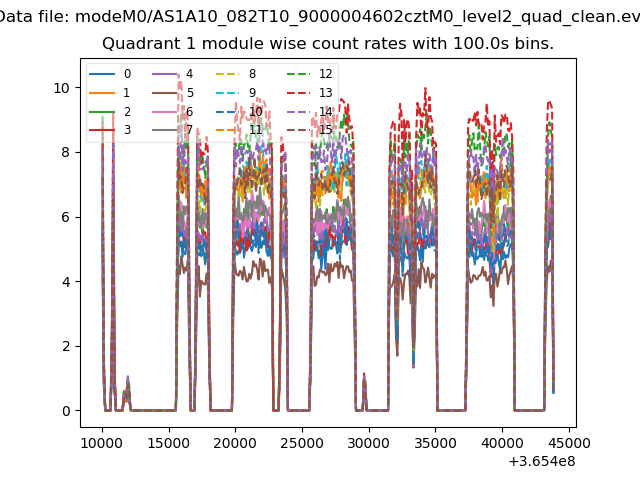
| Module-wise count rates for Quadrant A Data is divided into 100 sec bins |
 |
 |
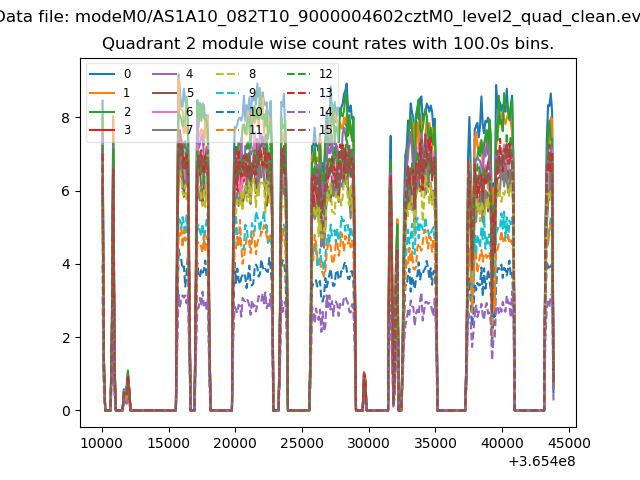
| Module-wise count rates for Quadrant B Data is divided into 100 sec bins |
 |
 |
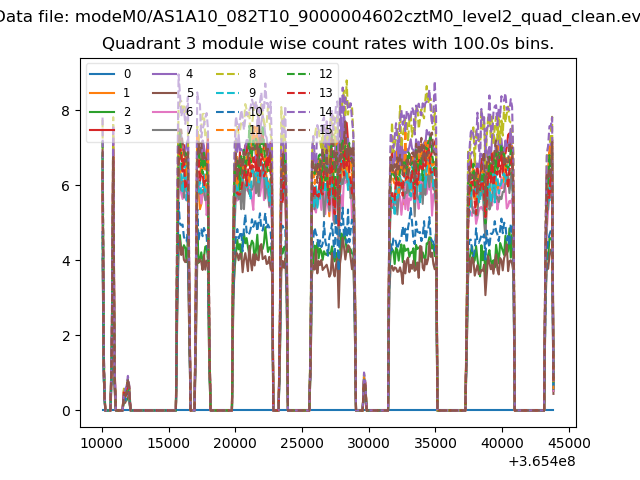
| Module-wise count rates for Quadrant C Data is divided into 100 sec bins |
 |
 |
| Module-wise count rates for Quadrant D Data is divided into 100 sec bins |
 |
 |
| Parameter | Plot |
|---|---|
| CZT HV Monitor | 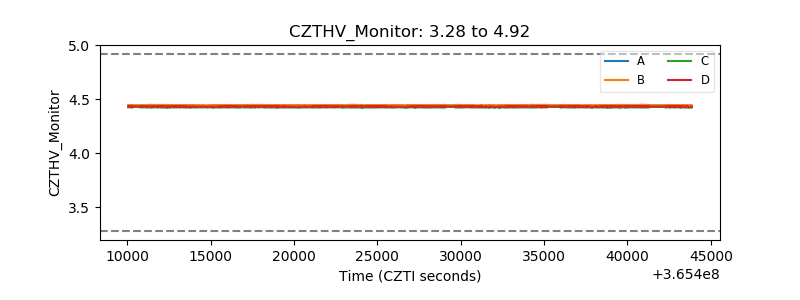 |
| D_VDD | 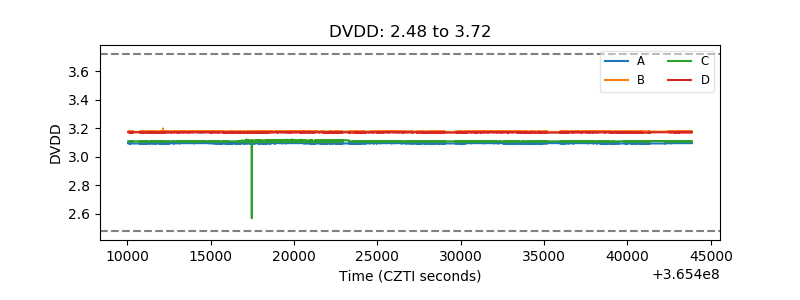 |
| Temperature 1 | 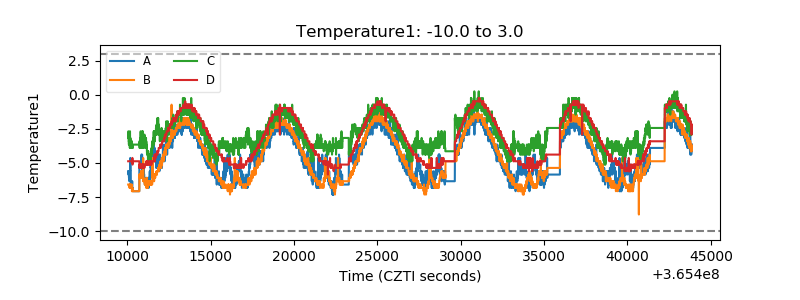 |
| Veto HV Monitor |  |
| Veto LLD | 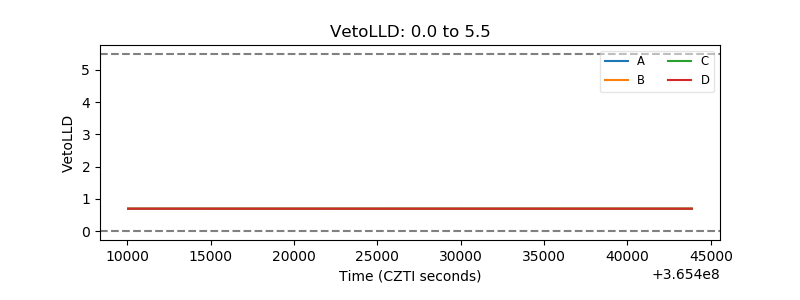 |
| Alpha Counter | 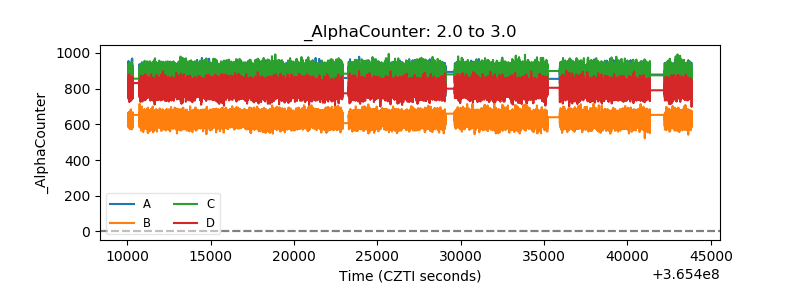 |
| _CPM_Rate | 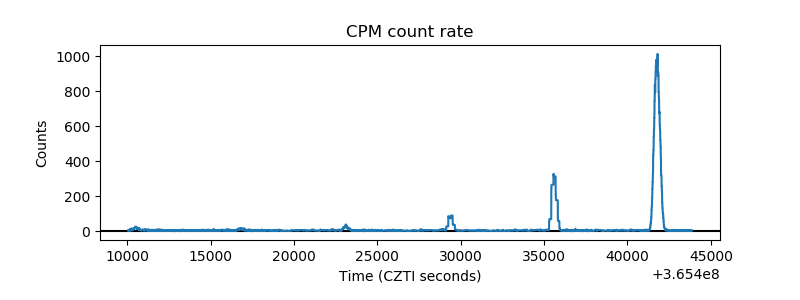 |
| CZT Counter | 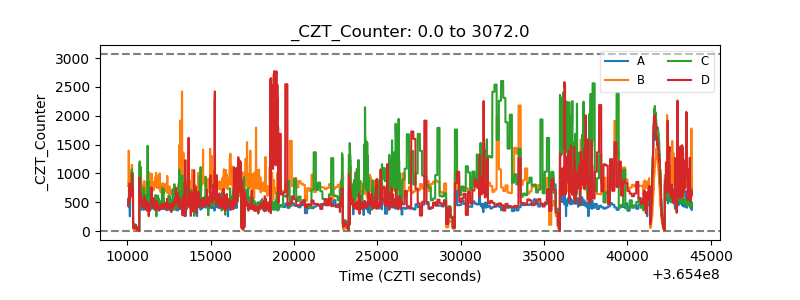 |
| +2.5 Volts monitor | 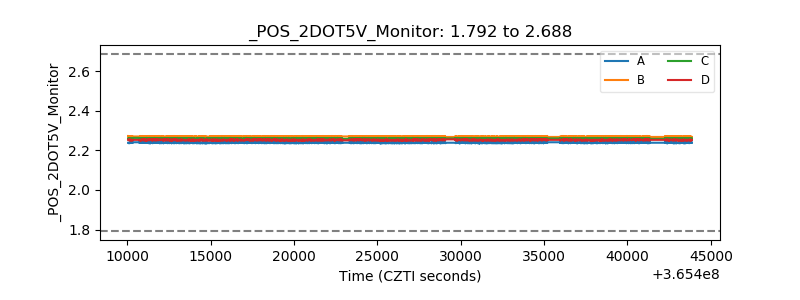 |
| +5 Volts monitor | 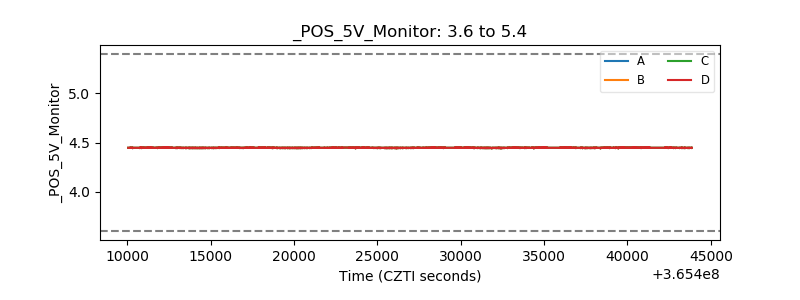 |
| _ROLL_ROT | 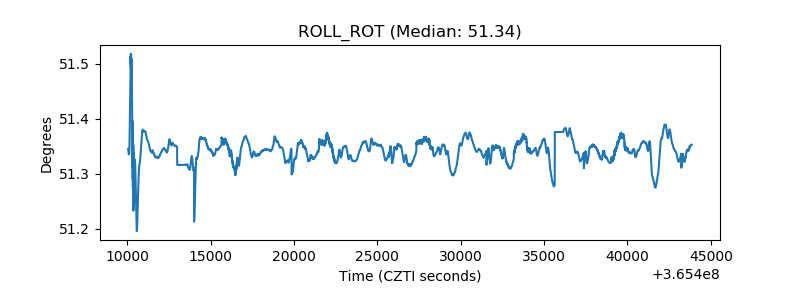 |
| _Roll_DEC | 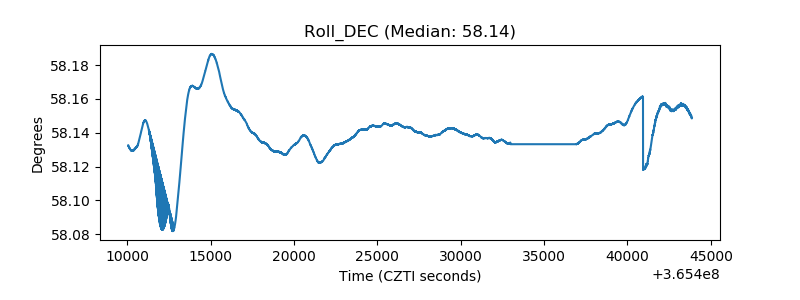 |
| _Roll_RA | 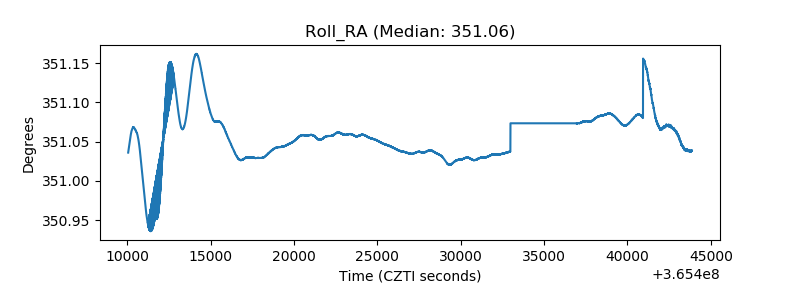 |
| Veto Counter | 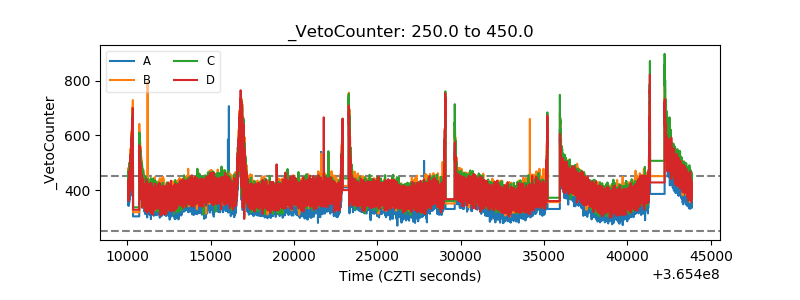 |