| Param | Original file | Final file |
|---|---|---|
| Filename | modeM0/AS1A10_082T10_9000004602_31575cztM0_level2.evt | modeM0/AS1A10_082T10_9000004602_31575cztM0_level2_quad_clean.evt |
| Size (bytes) | 633,360,960 | 111,384,000 |
| Size | 604.0 MB | 106.2 MB |
| Events in quadrant A | 3,676,559 | 716,615 |
| Events in quadrant B | 6,499,138 | 717,072 |
| Events in quadrant C | 4,250,761 | 697,834 |
| Events in quadrant D | 4,216,293 | 688,638 |
| Mode M9 | |||
|---|---|---|---|
| Quadrant | BADHDUFLAG | Total packets | Discarded packets |
| A | 0 | 5 | 0 |
| B | 0 | 5 | 0 |
| C | 0 | 5 | 0 |
| D | 0 | 5 | 0 |
| Mode M0 | |||
|---|---|---|---|
| Quadrant | BADHDUFLAG | Total packets | Discarded packets |
| A | 0 | 16354 | 2 |
| B | 0 | 25158 | 2 |
| C | 0 | 17640 | 2 |
| D | 0 | 17783 | 2 |
| Mode SS | |||
|---|---|---|---|
| Quadrant | BADHDUFLAG | Total packets | Discarded packets |
| A | 0 | 160 | 0 |
| B | 0 | 160 | 0 |
| C | 0 | 160 | 0 |
| D | 0 | 160 | 0 |
| Quadrant | Total seconds | Saturated seconds | Saturation percentage |
|---|---|---|---|
| A | 7960 | 270 | 3.391960% |
| B | 7960 | 434 | 5.452261% |
| C | 7960 | 325 | 4.082915% |
| D | 7959 | 311 | 3.907526% |
Noise dominated data is calculated using 1-second bins in cleaned event files. If a bin has >2000 counts, and if more than 50% of those come from <1% of pixels, then it is considered to be noise-dominated and hence unusable.
| Quadrant | # 1 sec bins | Bins with >0 counts | Bins with >2000 counts | High rate bins dominated by noise | Noise dominated (total time) | Noise dominated (detector-on time) | Marked lightcurve |
|---|---|---|---|---|---|---|---|
| A | 8568 | 7962 | 0 | 0 | 0.00% | 0.00% | 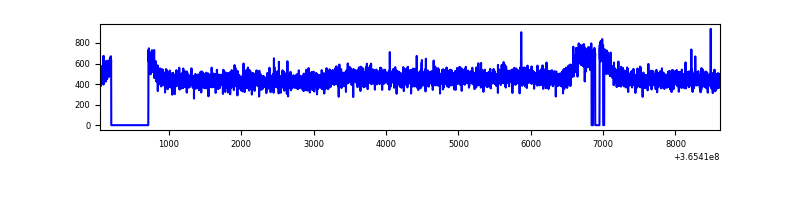 |
| B | 8568 | 7962 | 30 | 30 | 0.35% | 0.38% | 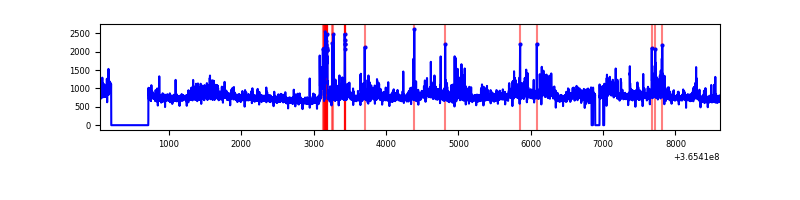 |
| C | 8568 | 7961 | 0 | 0 | 0.00% | 0.00% | 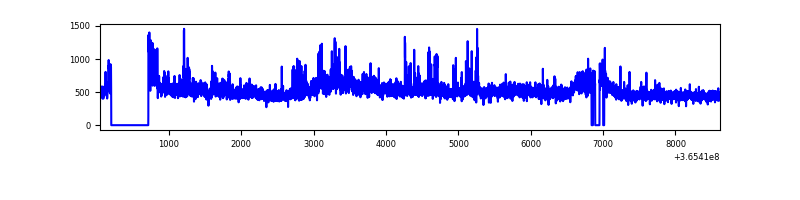 |
| D | 8566 | 7960 | 78 | 78 | 0.91% | 0.98% | 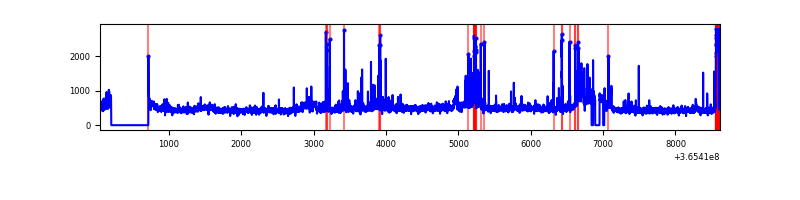 |
Top three noisy pixels from each quadrant. If the there are fewer than three noisy pixels in the level2.evt file, extra rows are filled as -1
| Pixel properties | Quadrant properties | ||||||
|---|---|---|---|---|---|---|---|
| Quadrant | DetID | PixID | Counts | Sigma | Mean | Median | Sigma |
| A | 13 | 254 | 14487 | 70.44 | 951 | 928 | 192.5 |
| A | 3 | 137 | 10070 | 47.49 | 951 | 928 | 192.5 |
| A | 0 | 226 | 7994 | 36.71 | 951 | 928 | 192.5 |
| B | 6 | 159 | 2165886 | 11924.95 | 938 | 911 | 181.5 |
| B | 4 | 80 | 484545 | 2663.91 | 938 | 911 | 181.5 |
| B | 0 | 190 | 82057 | 446.96 | 938 | 911 | 181.5 |
| C | 3 | 233 | 493854 | 2327.93 | 908 | 911 | 211.8 |
| C | 14 | 238 | 147509 | 692.31 | 908 | 911 | 211.8 |
| C | 2 | 114 | 18544 | 83.27 | 908 | 911 | 211.8 |
| D | 8 | 195 | 275839 | 1273.99 | 912 | 886 | 215.8 |
| D | 12 | 233 | 228638 | 1055.29 | 912 | 886 | 215.8 |
| D | 12 | 218 | 92860 | 426.16 | 912 | 886 | 215.8 |
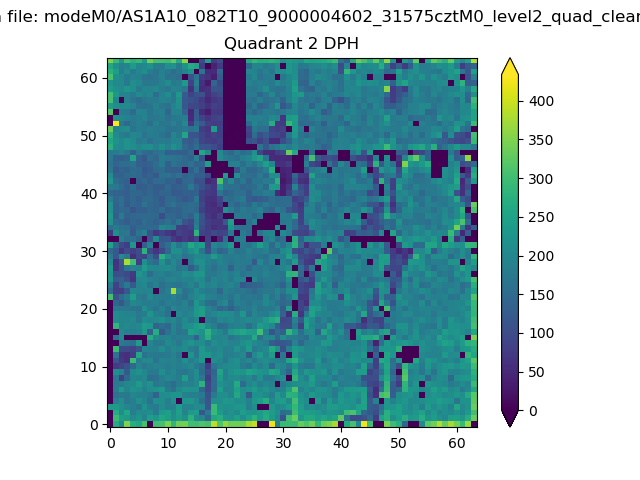
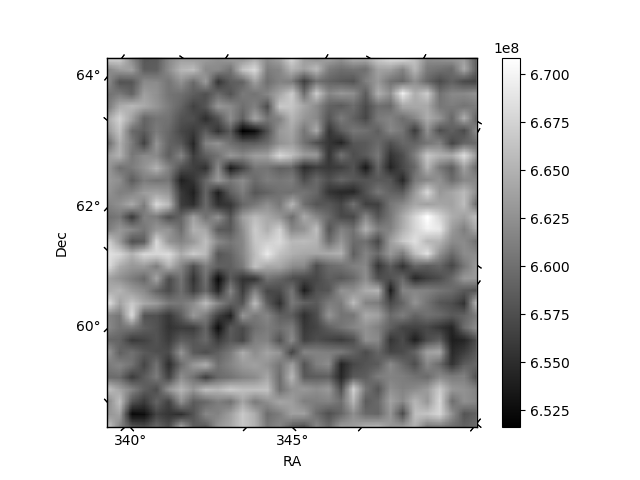
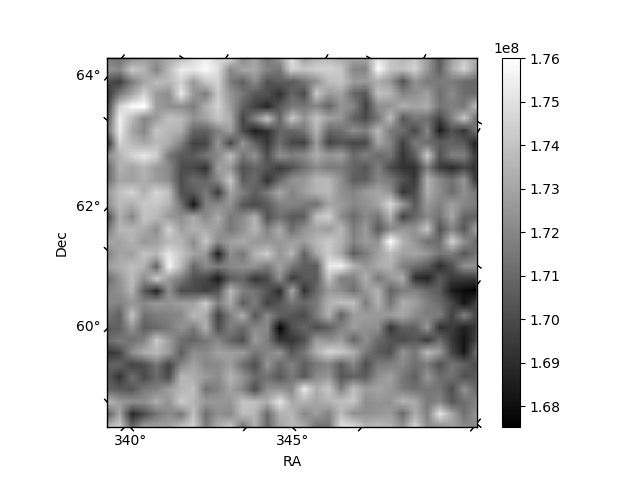
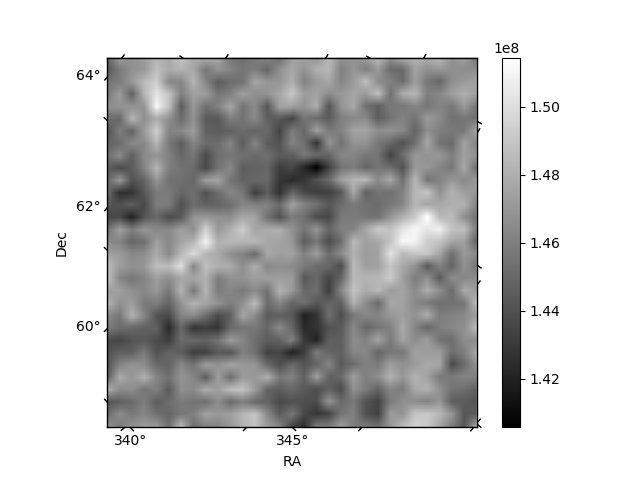
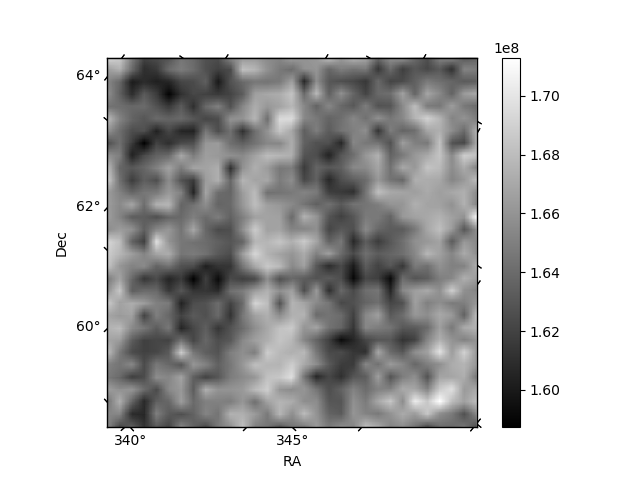
Histogram calculated using DETX and DETY for each event in the final _common_clean file
| Quadrant A | 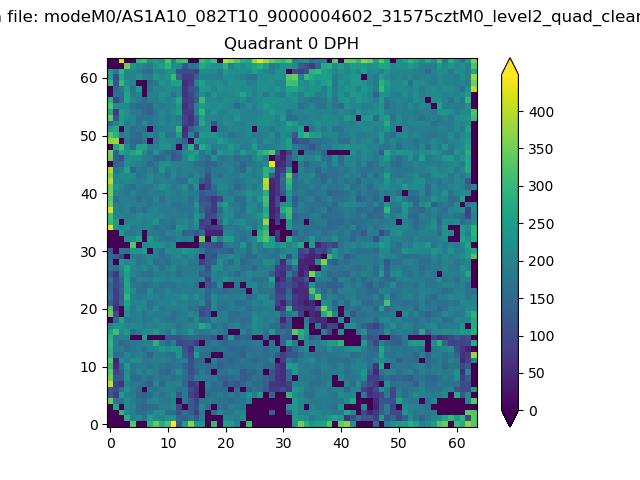 |
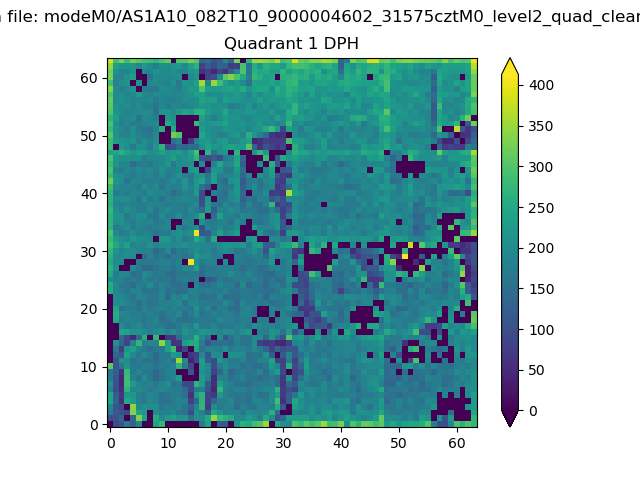 |
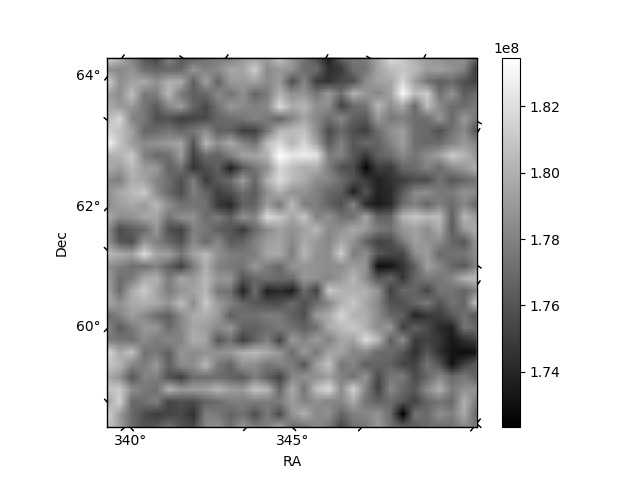
Quadrant B |
|---|---|---|---|
| Quadrant D | 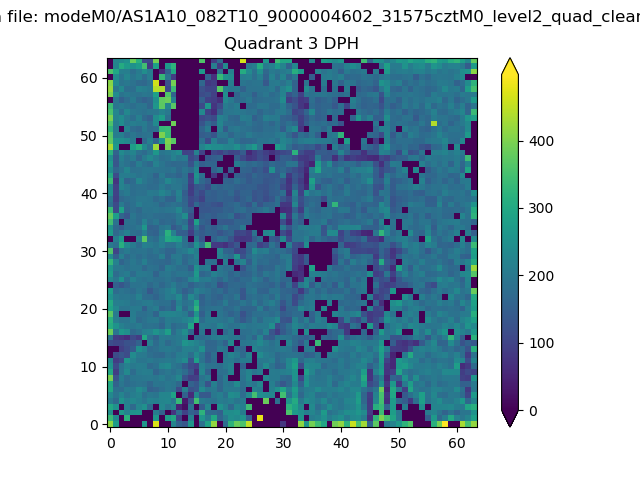 |
 |
Quadrant C |
| Plot type | Count rate plots | Images |
|---|---|---|
| Comparison with Poisson distribution Blue bars denote a histogram of data divided into 1 sec bins. Red curve is a Poisson curve with rate = median count rate of data. |
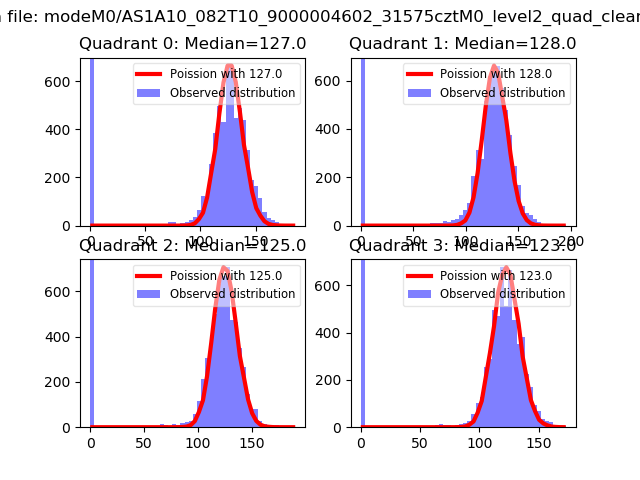 |
 |
| Quadrant-wise count rates Data is divided into 100 sec bins |
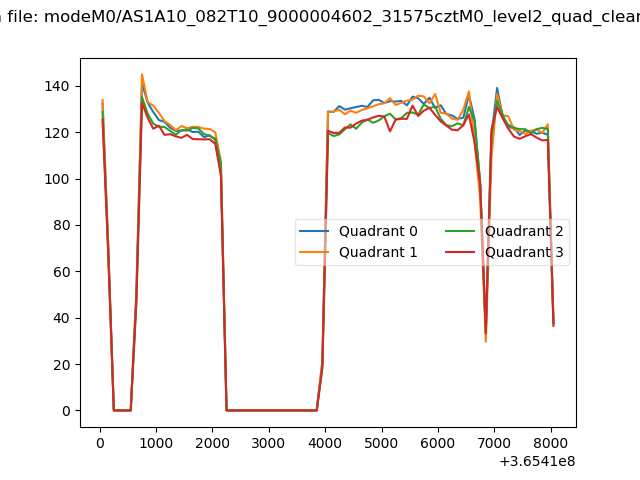 |
|
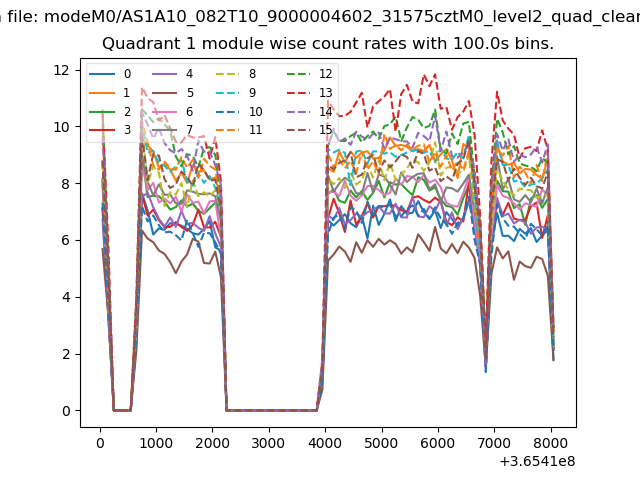
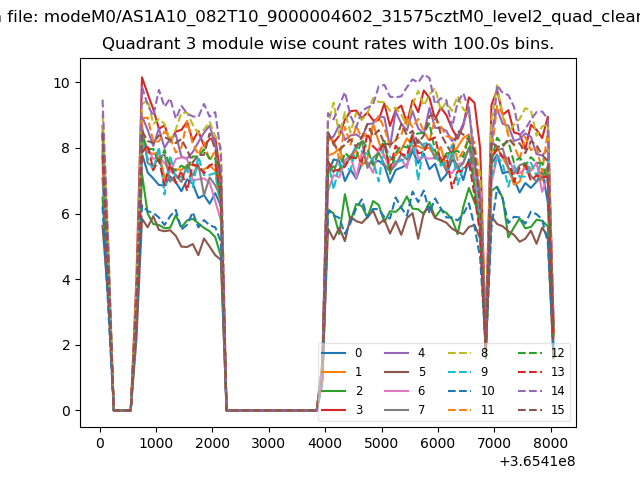
| Module-wise count rates for Quadrant A Data is divided into 100 sec bins |
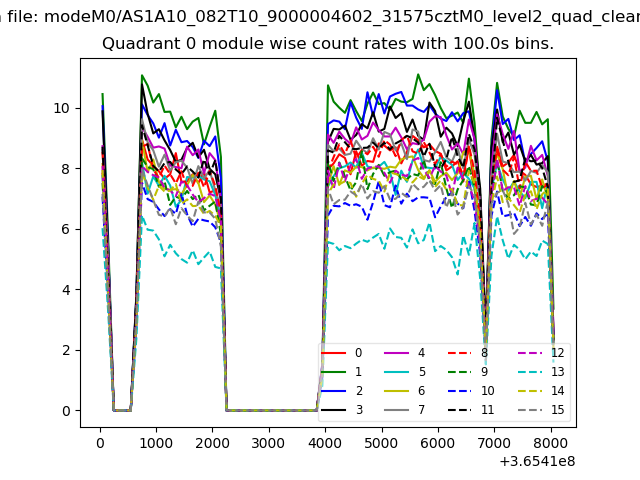 |
 |
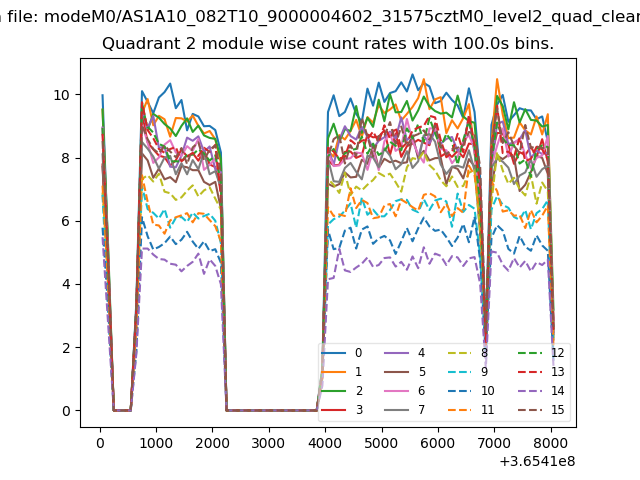
| Module-wise count rates for Quadrant B Data is divided into 100 sec bins |
 |
 |
| Module-wise count rates for Quadrant C Data is divided into 100 sec bins |
 |
 |
| Module-wise count rates for Quadrant D Data is divided into 100 sec bins |
 |
 |
| Parameter | Plot |
|---|---|
| CZT HV Monitor | 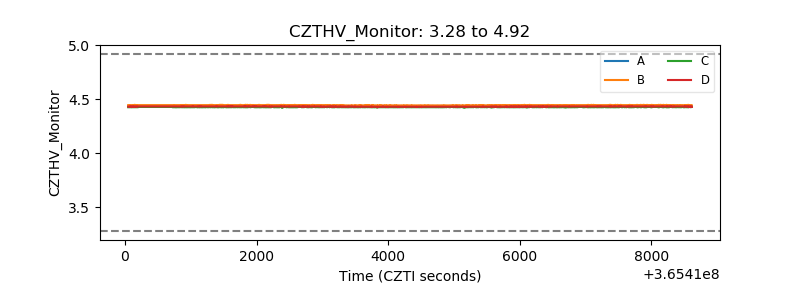 |
| D_VDD | 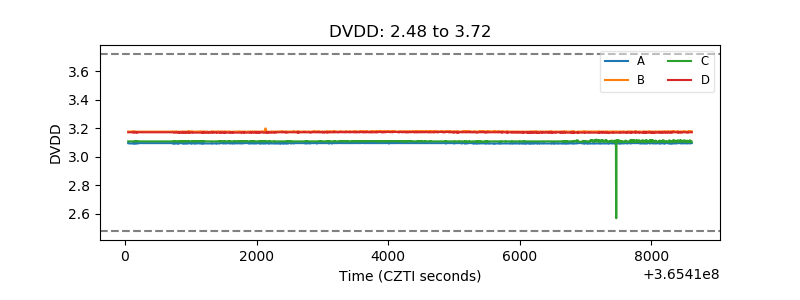 |
| Temperature 1 | 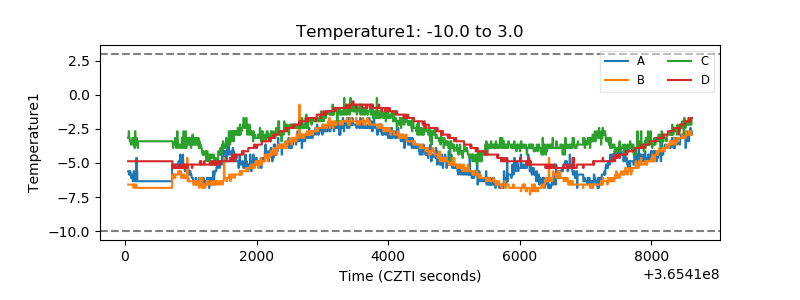 |
| Veto HV Monitor | 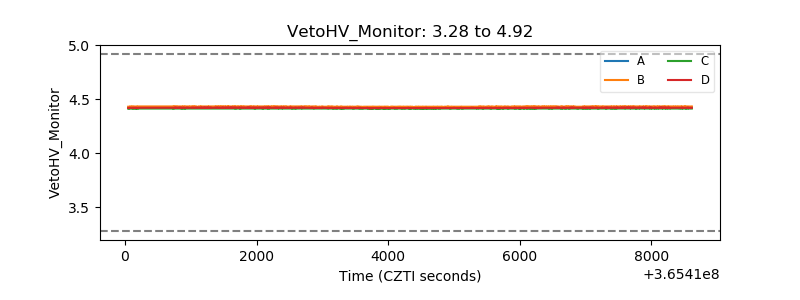 |
| Veto LLD | 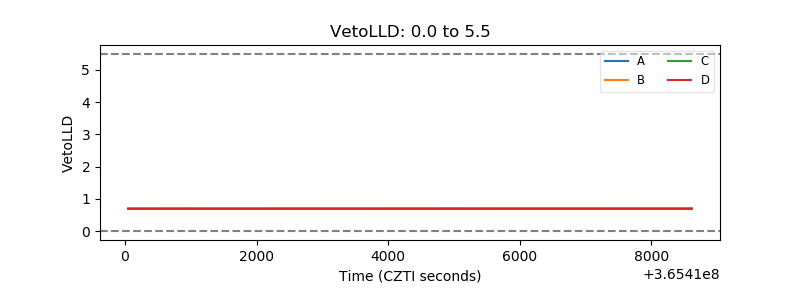 |
| Alpha Counter | 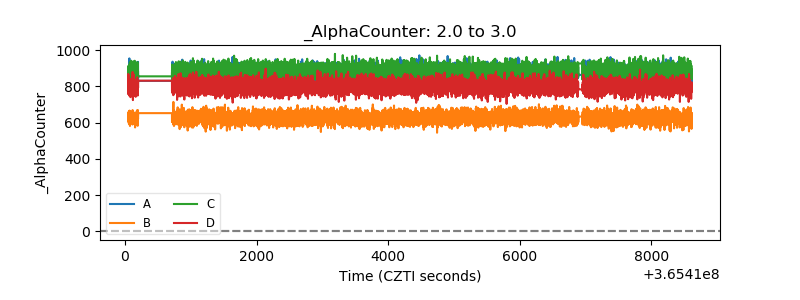 |
| _CPM_Rate | 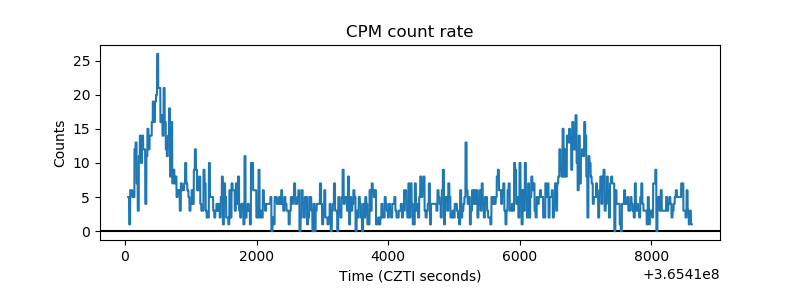 |
| CZT Counter | 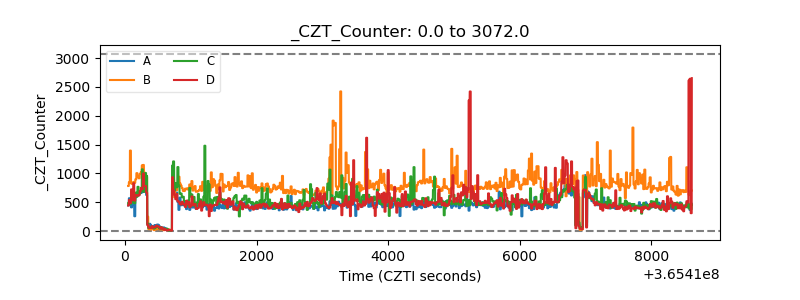 |
| +2.5 Volts monitor |  |
| +5 Volts monitor | 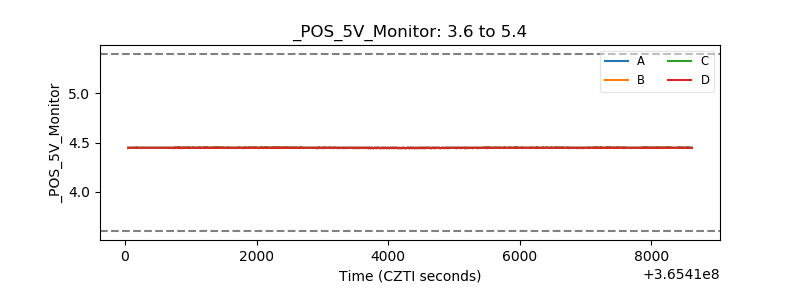 |
| _ROLL_ROT | 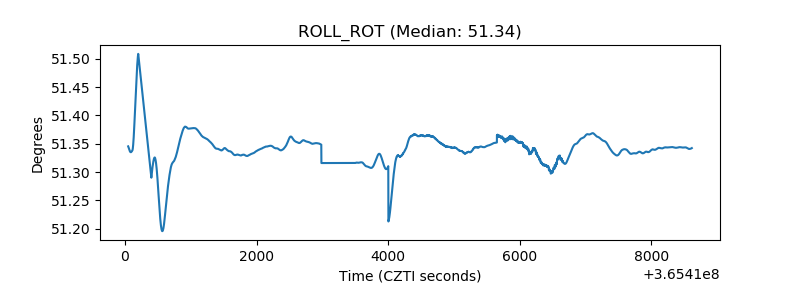 |
| _Roll_DEC | 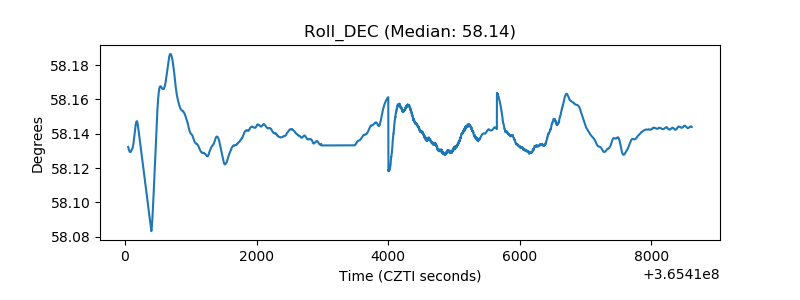 |
| _Roll_RA | 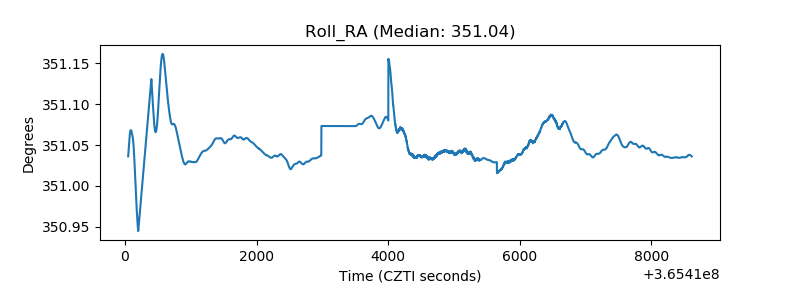 |
| Veto Counter | 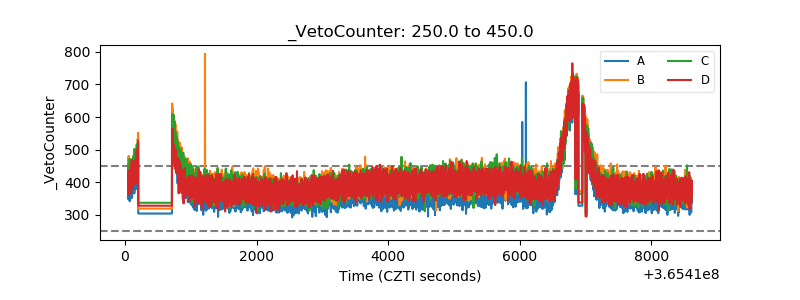 |