| Param | Original file | Final file |
|---|---|---|
| Filename | modeM0/AS1A10_082T10_9000004602_31576cztM0_level2.evt | modeM0/AS1A10_082T10_9000004602_31576cztM0_level2_quad_clean.evt |
| Size (bytes) | 585,578,880 | 83,920,320 |
| Size | 558.5 MB | 80.0 MB |
| Events in quadrant A | 3,121,567 | 529,796 |
| Events in quadrant B | 5,389,078 | 527,384 |
| Events in quadrant C | 4,237,762 | 502,379 |
| Events in quadrant D | 4,523,659 | 506,069 |
| Mode M9 | |||
|---|---|---|---|
| Quadrant | BADHDUFLAG | Total packets | Discarded packets |
| A | 0 | 4 | 0 |
| B | 0 | 4 | 0 |
| C | 0 | 4 | 0 |
| D | 0 | 4 | 0 |
| Mode M0 | |||
|---|---|---|---|
| Quadrant | BADHDUFLAG | Total packets | Discarded packets |
| A | 0 | 13843 | 1 |
| B | 0 | 21191 | 1 |
| C | 0 | 17091 | 1 |
| D | 0 | 17919 | 1 |
| Mode SS | |||
|---|---|---|---|
| Quadrant | BADHDUFLAG | Total packets | Discarded packets |
| A | 0 | 138 | 0 |
| B | 0 | 138 | 0 |
| C | 0 | 138 | 0 |
| D | 0 | 138 | 0 |
| Quadrant | Total seconds | Saturated seconds | Saturation percentage |
|---|---|---|---|
| A | 6824 | 103 | 1.509379% |
| B | 6825 | 202 | 2.959707% |
| C | 6825 | 458 | 6.710623% |
| D | 6825 | 496 | 7.267399% |
Noise dominated data is calculated using 1-second bins in cleaned event files. If a bin has >2000 counts, and if more than 50% of those come from <1% of pixels, then it is considered to be noise-dominated and hence unusable.
| Quadrant | # 1 sec bins | Bins with >0 counts | Bins with >2000 counts | High rate bins dominated by noise | Noise dominated (total time) | Noise dominated (detector-on time) | Marked lightcurve |
|---|---|---|---|---|---|---|---|
| A | 7199 | 6824 | 0 | 0 | 0.00% | 0.00% | 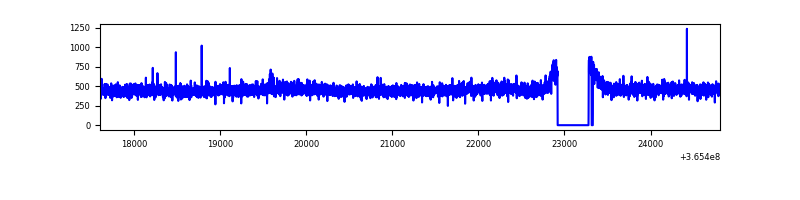 |
| B | 7200 | 6825 | 17 | 17 | 0.24% | 0.25% | 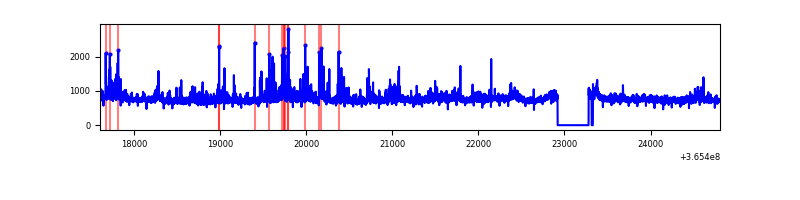 |
| C | 7200 | 6825 | 9 | 9 | 0.12% | 0.13% | 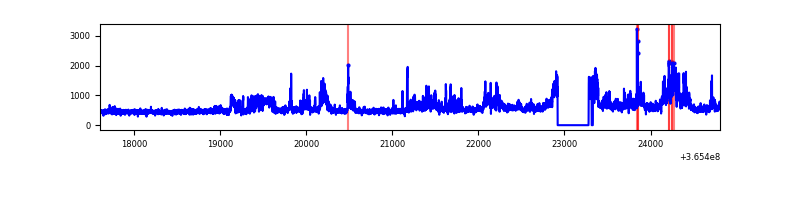 |
| D | 7200 | 6826 | 431 | 431 | 5.99% | 6.31% | 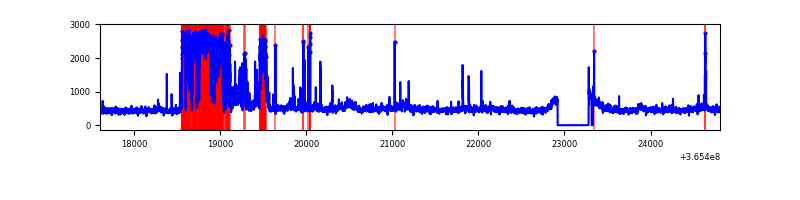 |
Top three noisy pixels from each quadrant. If the there are fewer than three noisy pixels in the level2.evt file, extra rows are filled as -1
| Pixel properties | Quadrant properties | ||||||
|---|---|---|---|---|---|---|---|
| Quadrant | DetID | PixID | Counts | Sigma | Mean | Median | Sigma |
| A | 13 | 254 | 12168 | 69.77 | 808 | 789 | 163.1 |
| A | 3 | 137 | 8585 | 47.8 | 808 | 789 | 163.1 |
| A | 0 | 226 | 6846 | 37.14 | 808 | 789 | 163.1 |
| B | 6 | 159 | 1808106 | 11668.83 | 798 | 776 | 154.9 |
| B | 4 | 80 | 345692 | 2226.91 | 798 | 776 | 154.9 |
| B | 0 | 190 | 32025 | 201.76 | 798 | 776 | 154.9 |
| C | 3 | 233 | 929016 | 5315.56 | 747 | 752 | 174.6 |
| C | 14 | 238 | 190879 | 1088.73 | 747 | 752 | 174.6 |
| C | 14 | 254 | 115513 | 657.16 | 747 | 752 | 174.6 |
| D | 12 | 233 | 1280124 | 7056.37 | 759 | 736 | 181.3 |
| D | 8 | 195 | 249209 | 1370.43 | 759 | 736 | 181.3 |
| D | 13 | 249 | 46626 | 253.1 | 759 | 736 | 181.3 |
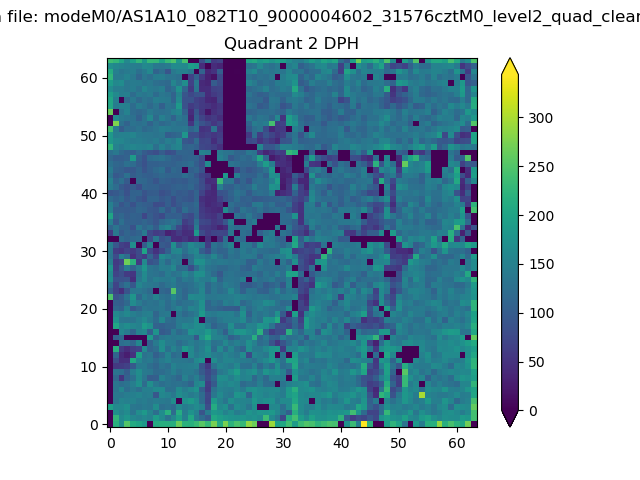
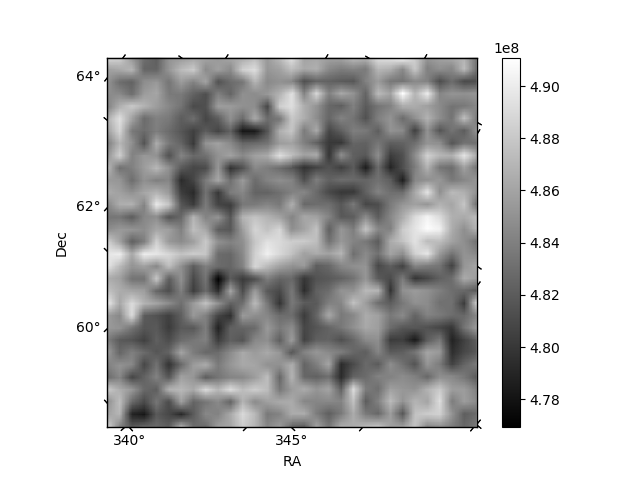
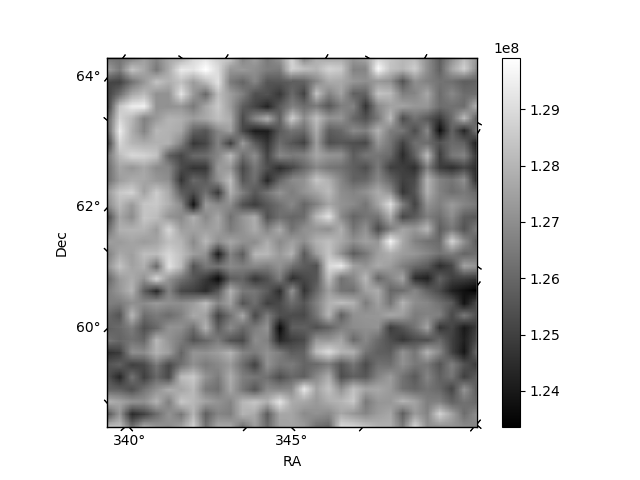
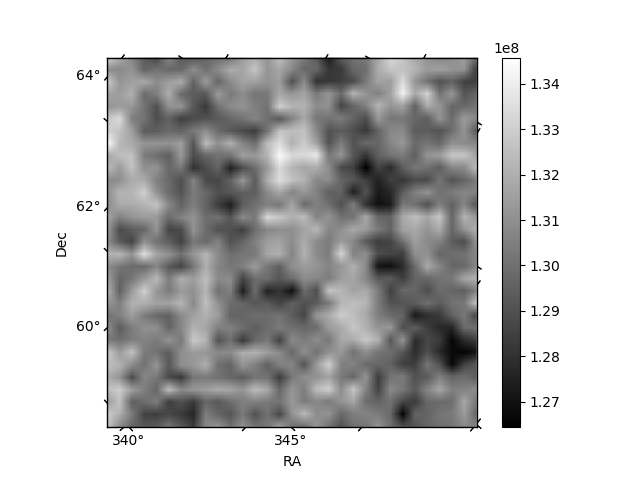
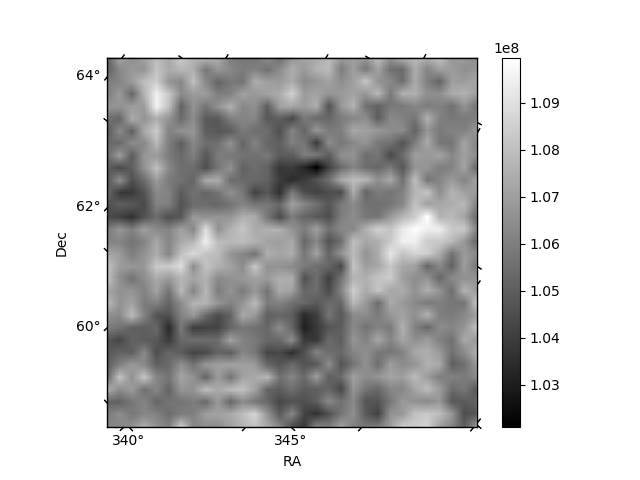
Histogram calculated using DETX and DETY for each event in the final _common_clean file
| Quadrant A | 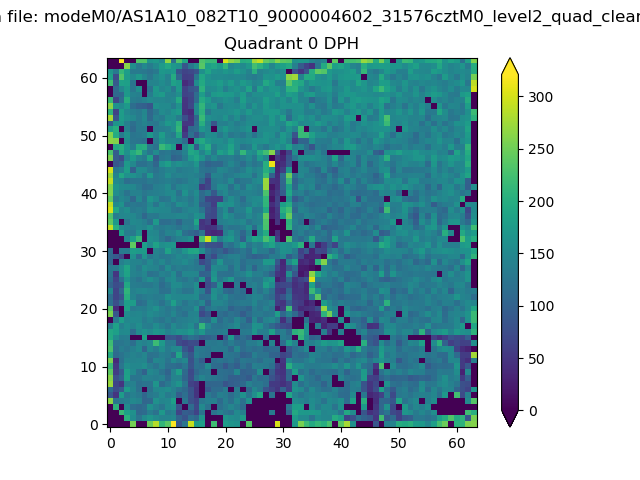 |
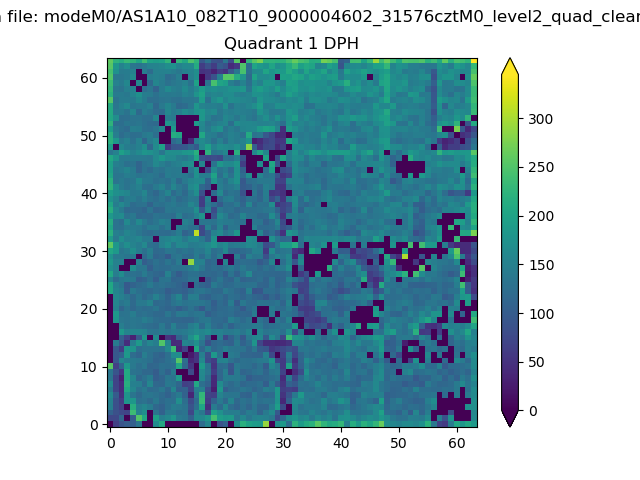 |
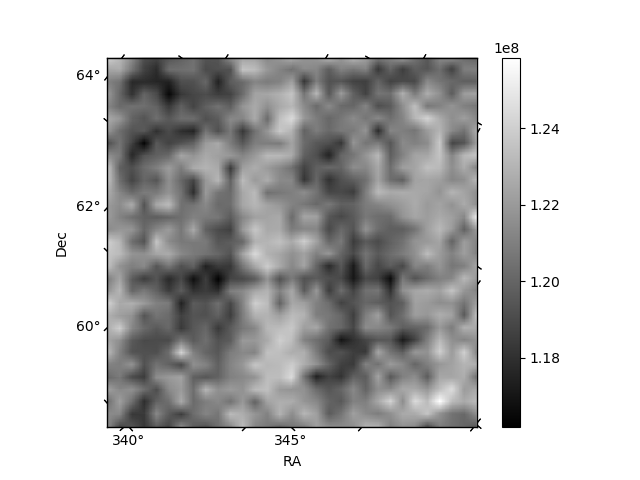
Quadrant B |
|---|---|---|---|
| Quadrant D | 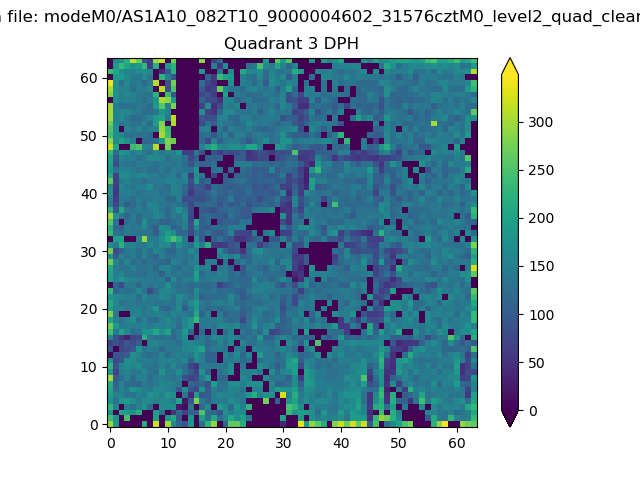 |
 |
Quadrant C |
| Plot type | Count rate plots | Images |
|---|---|---|
| Comparison with Poisson distribution Blue bars denote a histogram of data divided into 1 sec bins. Red curve is a Poisson curve with rate = median count rate of data. |
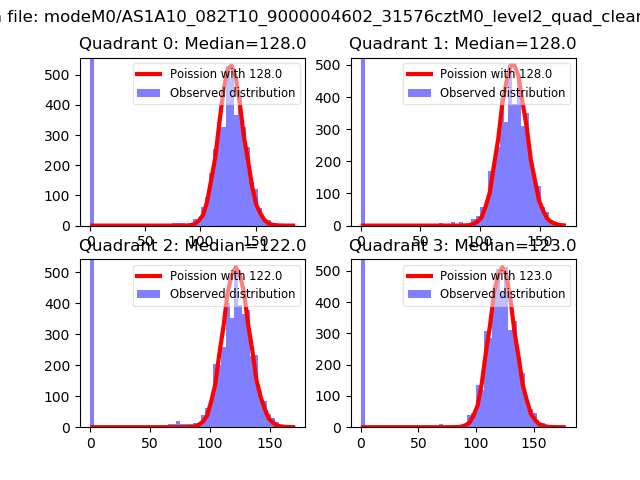 |
 |
| Quadrant-wise count rates Data is divided into 100 sec bins |
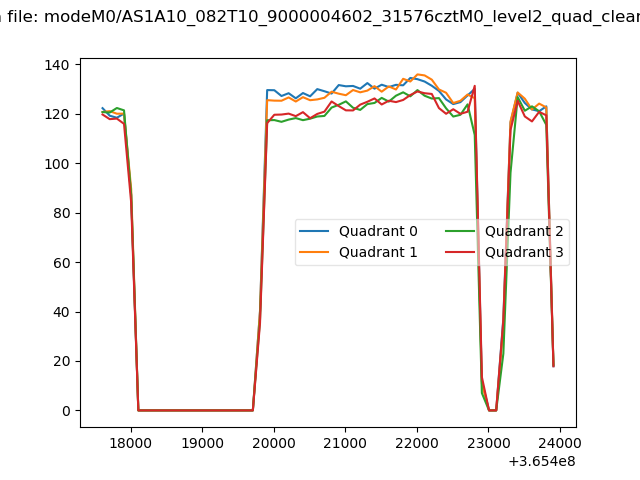 |
|
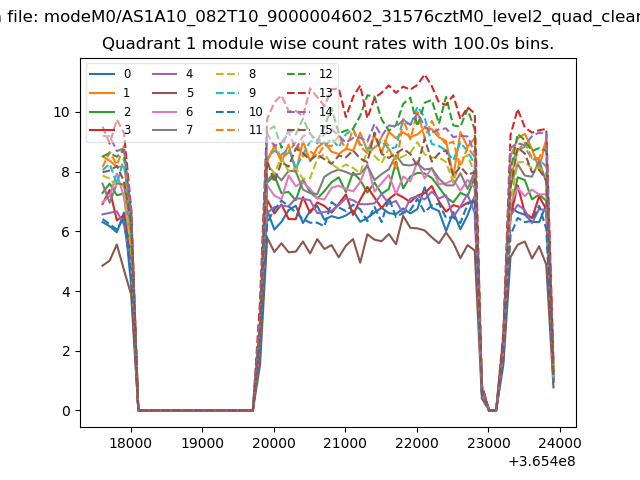
| Module-wise count rates for Quadrant A Data is divided into 100 sec bins |
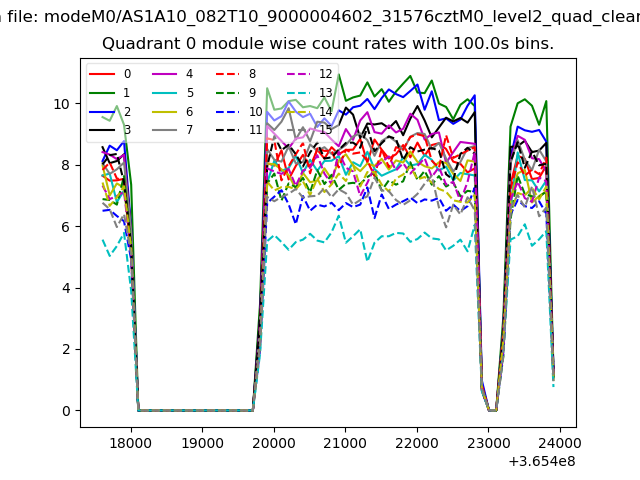 |
 |
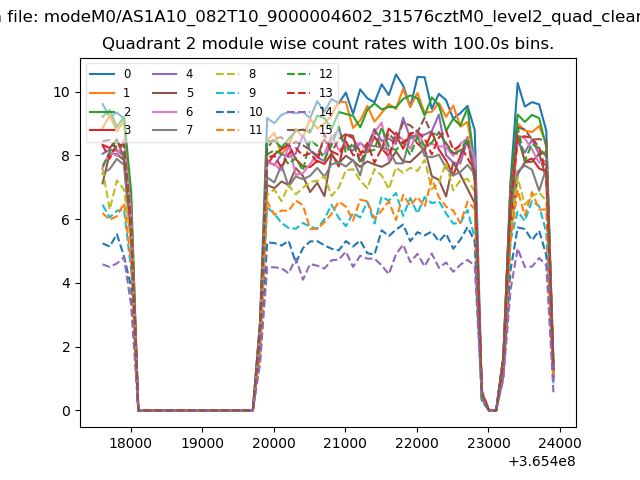
| Module-wise count rates for Quadrant B Data is divided into 100 sec bins |
 |
 |
| Module-wise count rates for Quadrant C Data is divided into 100 sec bins |
 |
 |
| Module-wise count rates for Quadrant D Data is divided into 100 sec bins |
 |
 |
| Parameter | Plot |
|---|---|
| CZT HV Monitor | 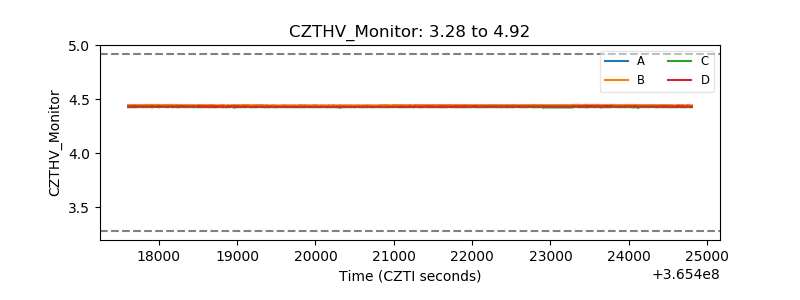 |
| D_VDD | 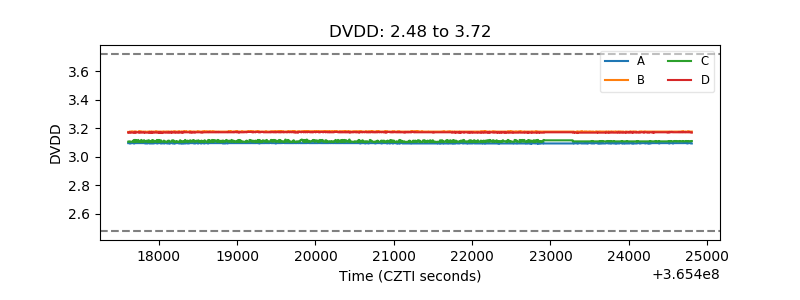 |
| Temperature 1 |  |
| Veto HV Monitor | 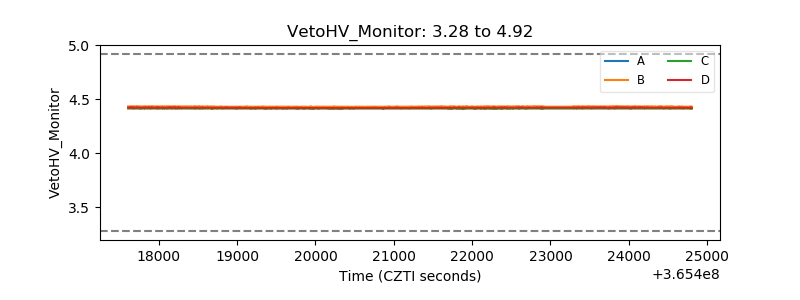 |
| Veto LLD |  |
| Alpha Counter | 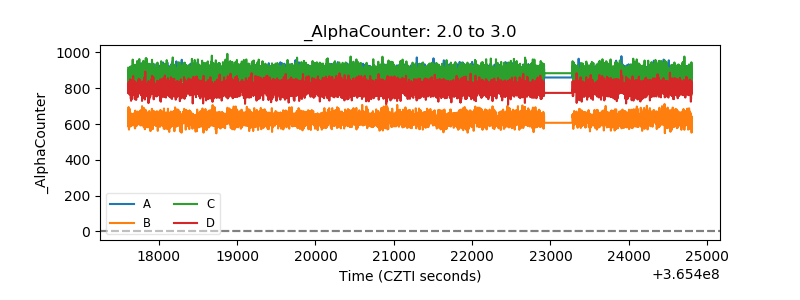 |
| _CPM_Rate | 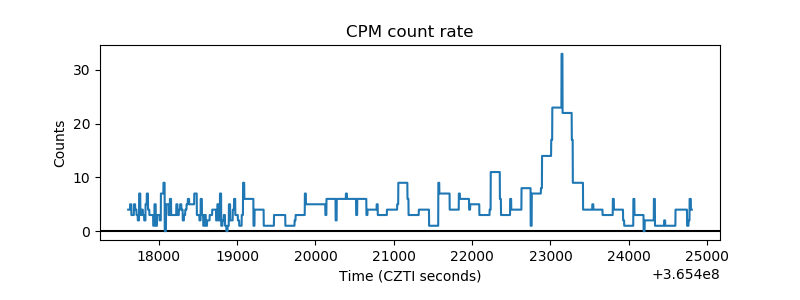 |
| CZT Counter | 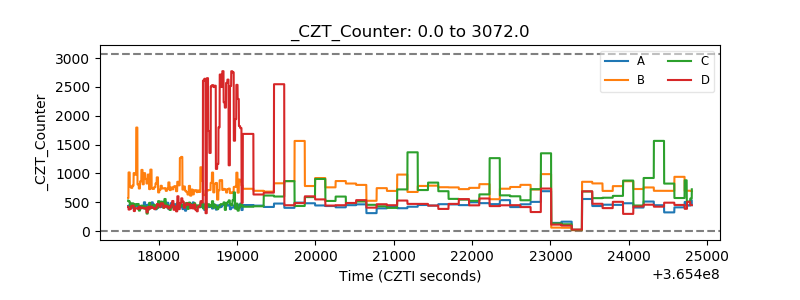 |
| +2.5 Volts monitor |  |
| +5 Volts monitor |  |
| _ROLL_ROT | 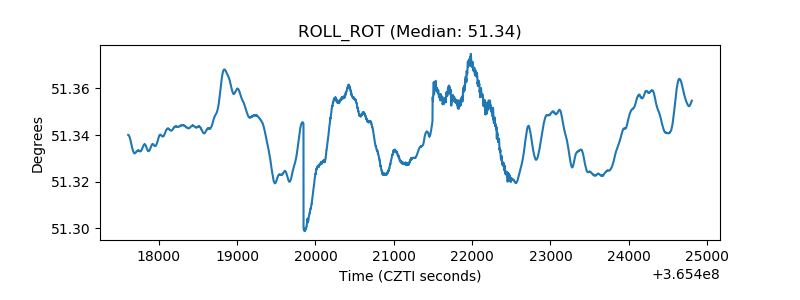 |
| _Roll_DEC | 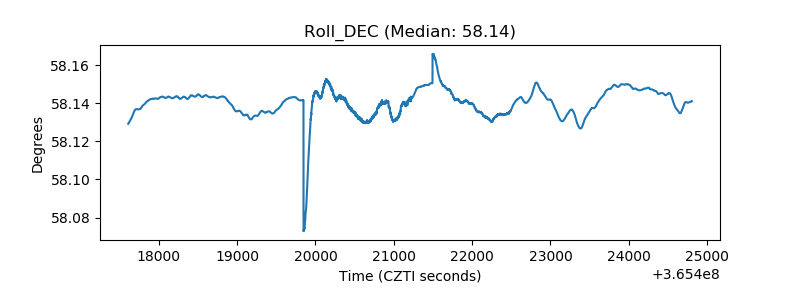 |
| _Roll_RA | 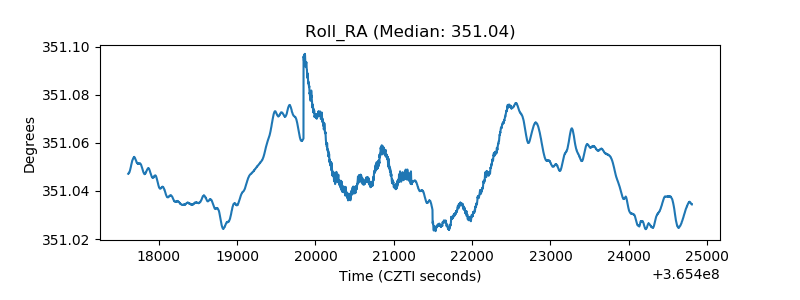 |
| Veto Counter |  |