| Param | Original file | Final file |
|---|---|---|
| Filename | modeM0/AS1A10_082T10_9000004602_31578cztM0_level2.evt | modeM0/AS1A10_082T10_9000004602_31578cztM0_level2_quad_clean.evt |
| Size (bytes) | 1,311,226,560 | 154,212,480 |
| Size | 1.2 GB | 147.1 MB |
| Events in quadrant A | 5,973,061 | 993,898 |
| Events in quadrant B | 10,955,629 | 972,721 |
| Events in quadrant C | 13,798,008 | 875,518 |
| Events in quadrant D | 8,115,711 | 935,613 |
| Mode M9 | |||
|---|---|---|---|
| Quadrant | BADHDUFLAG | Total packets | Discarded packets |
| A | 0 | 12 | 0 |
| B | 0 | 12 | 0 |
| C | 0 | 12 | 0 |
| D | 0 | 12 | 0 |
| Mode M0 | |||
|---|---|---|---|
| Quadrant | BADHDUFLAG | Total packets | Discarded packets |
| A | 0 | 26179 | 3 |
| B | 0 | 42073 | 3 |
| C | 0 | 50096 | 3 |
| D | 0 | 32533 | 5 |
| Mode SS | |||
|---|---|---|---|
| Quadrant | BADHDUFLAG | Total packets | Discarded packets |
| A | 0 | 264 | 0 |
| B | 0 | 264 | 0 |
| C | 0 | 264 | 0 |
| D | 0 | 264 | 0 |
| Quadrant | Total seconds | Saturated seconds | Saturation percentage |
|---|---|---|---|
| A | 12899 | 116 | 0.899295% |
| B | 12899 | 559 | 4.333669% |
| C | 12899 | 1884 | 14.605783% |
| D | 12899 | 299 | 2.318009% |
Noise dominated data is calculated using 1-second bins in cleaned event files. If a bin has >2000 counts, and if more than 50% of those come from <1% of pixels, then it is considered to be noise-dominated and hence unusable.
| Quadrant | # 1 sec bins | Bins with >0 counts | Bins with >2000 counts | High rate bins dominated by noise | Noise dominated (total time) | Noise dominated (detector-on time) | Marked lightcurve |
|---|---|---|---|---|---|---|---|
| A | 14204 | 12899 | 0 | 0 | 0.00% | 0.00% | 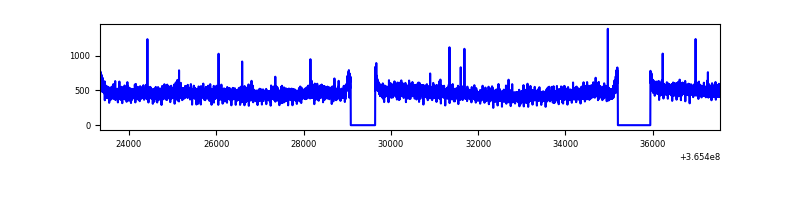 |
| B | 14204 | 12899 | 280 | 280 | 1.97% | 2.17% | 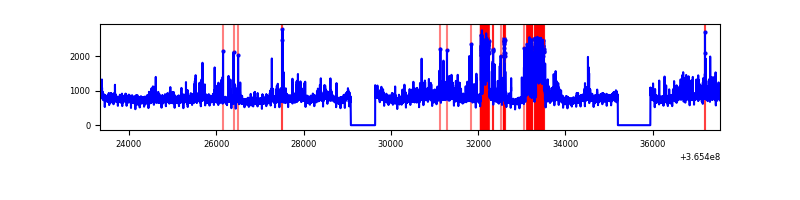 |
| C | 14204 | 12899 | 1028 | 1028 | 7.24% | 7.97% | 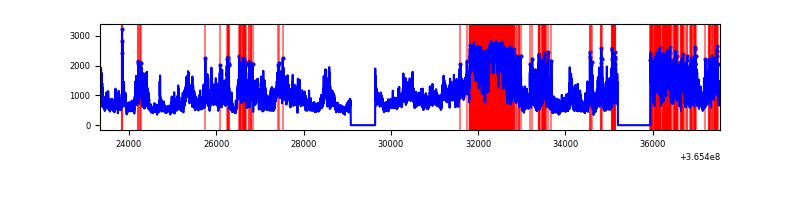 |
| D | 14204 | 12899 | 228 | 228 | 1.61% | 1.77% | 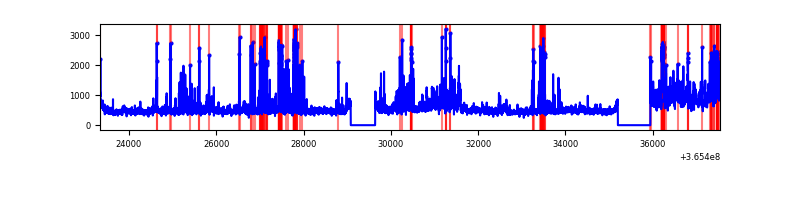 |
Top three noisy pixels from each quadrant. If the there are fewer than three noisy pixels in the level2.evt file, extra rows are filled as -1
| Pixel properties | Quadrant properties | ||||||
|---|---|---|---|---|---|---|---|
| Quadrant | DetID | PixID | Counts | Sigma | Mean | Median | Sigma |
| A | 13 | 254 | 24020 | 72.94 | 1547 | 1513 | 308.6 |
| A | 3 | 137 | 16170 | 47.5 | 1547 | 1513 | 308.6 |
| A | 0 | 226 | 12777 | 36.5 | 1547 | 1513 | 308.6 |
| B | 6 | 159 | 3464206 | 12001.21 | 1516 | 1480 | 288.5 |
| B | 4 | 80 | 1262420 | 4370.2 | 1516 | 1480 | 288.5 |
| B | 12 | 1 | 88043 | 300.01 | 1516 | 1480 | 288.5 |
| C | 3 | 233 | 7901889 | 24112.33 | 1403 | 1406 | 327.7 |
| C | 14 | 238 | 224643 | 681.32 | 1403 | 1406 | 327.7 |
| C | 4 | 175 | 74253 | 222.33 | 1403 | 1406 | 327.7 |
| D | 8 | 195 | 1380626 | 3930.13 | 1482 | 1442 | 350.9 |
| D | 12 | 233 | 705550 | 2006.43 | 1482 | 1442 | 350.9 |
| D | 13 | 249 | 126898 | 357.5 | 1482 | 1442 | 350.9 |
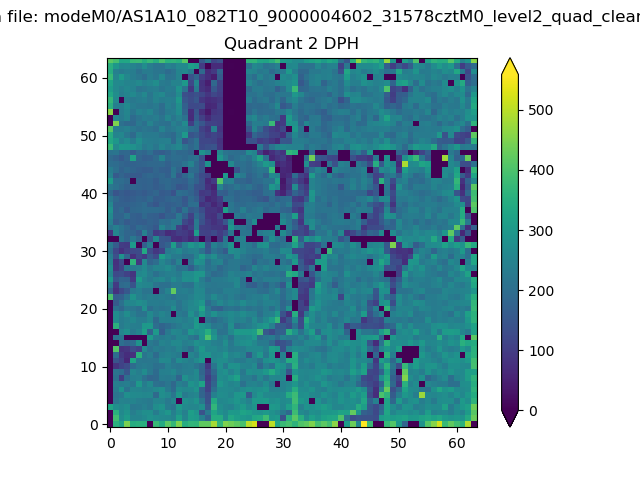
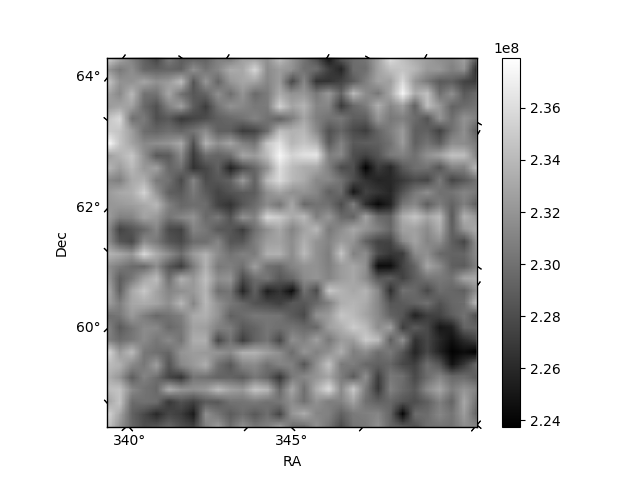
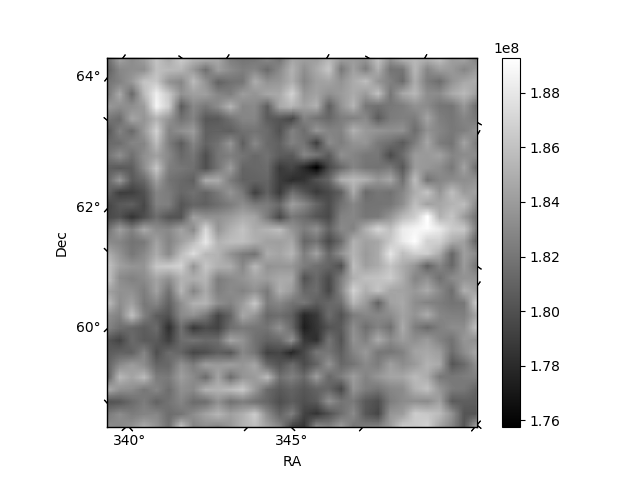
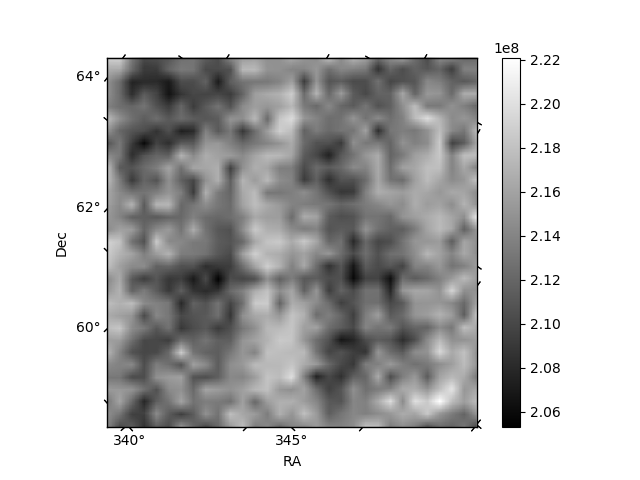
Histogram calculated using DETX and DETY for each event in the final _common_clean file
| Quadrant A | 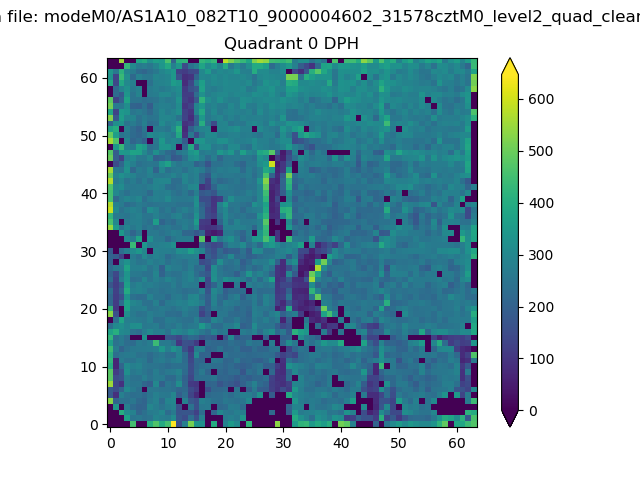 |
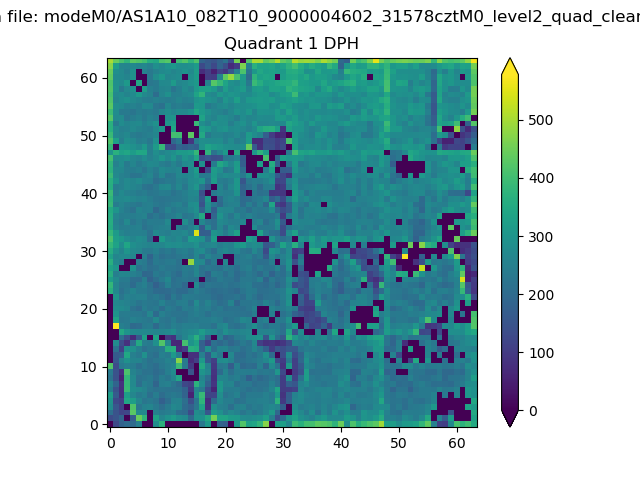 |
Quadrant B |
|---|---|---|---|
| Quadrant D | 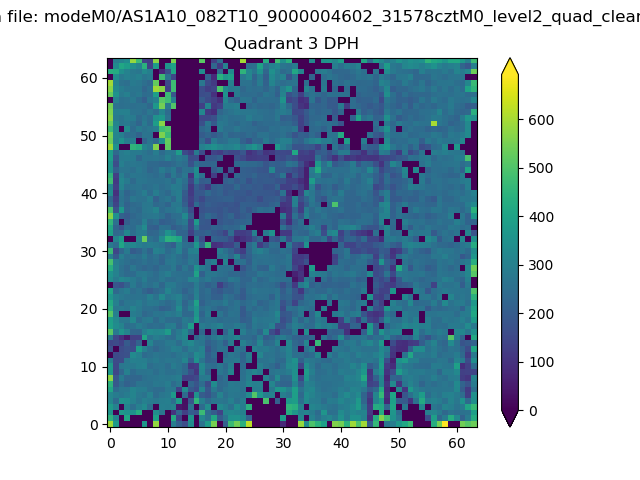 |
 |
Quadrant C |
| Plot type | Count rate plots | Images |
|---|---|---|
| Comparison with Poisson distribution Blue bars denote a histogram of data divided into 1 sec bins. Red curve is a Poisson curve with rate = median count rate of data. |
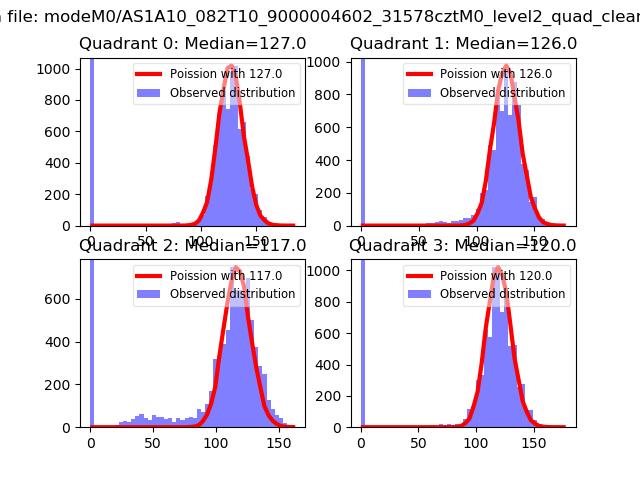 |
 |
| Quadrant-wise count rates Data is divided into 100 sec bins |
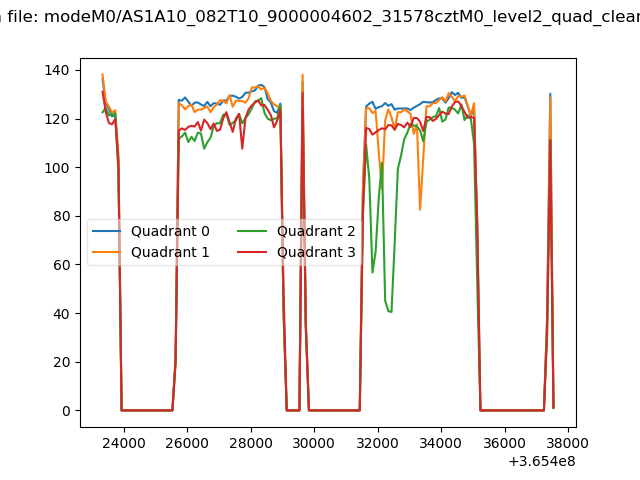 |
|
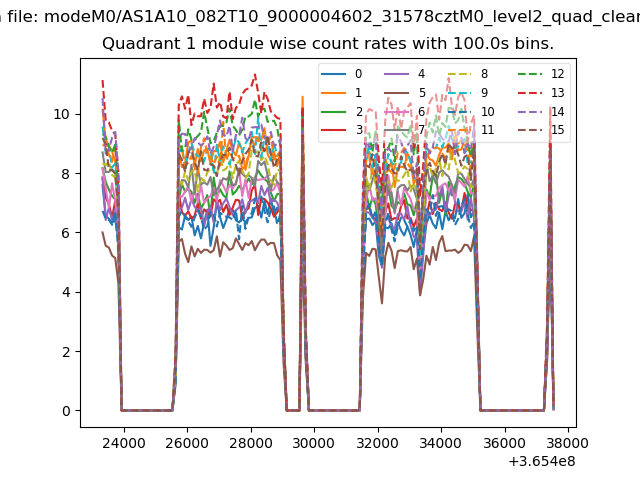
| Module-wise count rates for Quadrant A Data is divided into 100 sec bins |
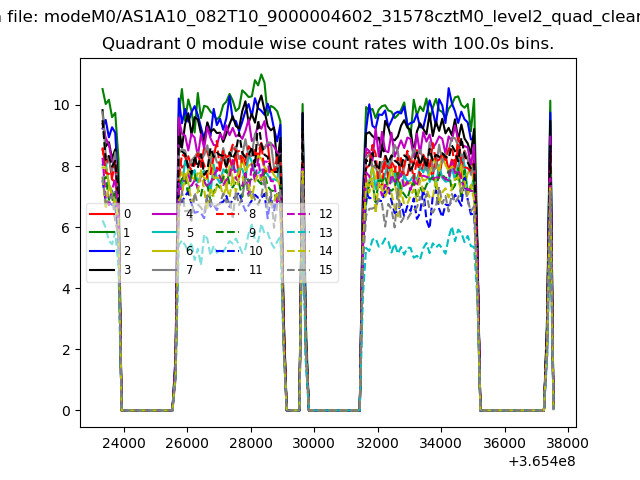 |
 |
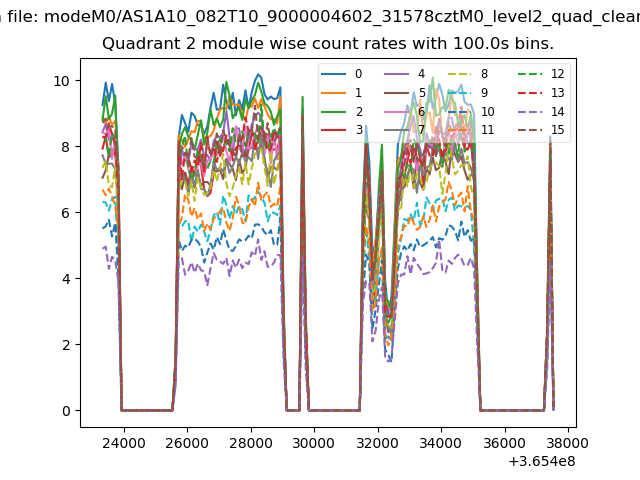
| Module-wise count rates for Quadrant B Data is divided into 100 sec bins |
 |
 |
| Module-wise count rates for Quadrant C Data is divided into 100 sec bins |
 |
 |
| Module-wise count rates for Quadrant D Data is divided into 100 sec bins |
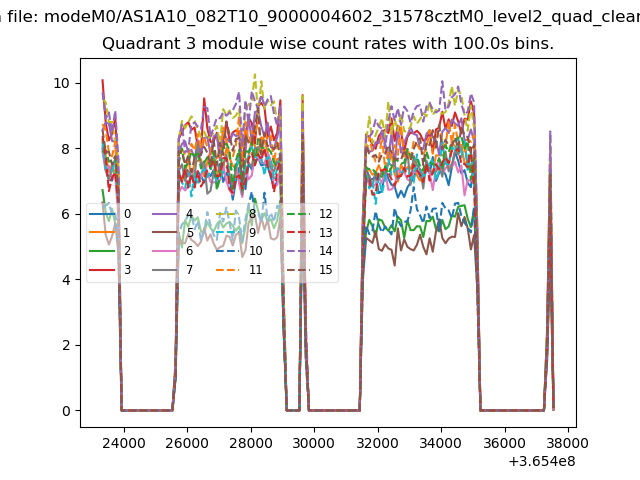 |
 |
| Parameter | Plot |
|---|---|
| CZT HV Monitor | 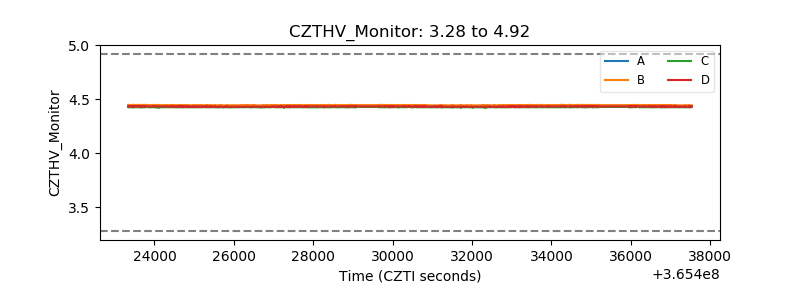 |
| D_VDD | 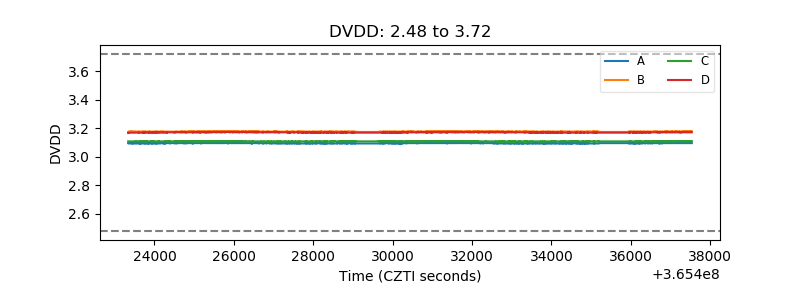 |
| Temperature 1 |  |
| Veto HV Monitor | 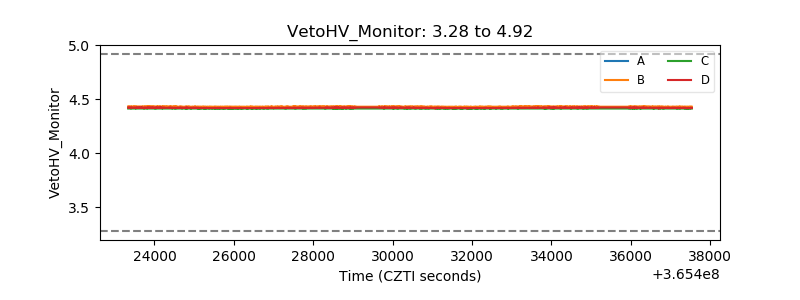 |
| Veto LLD | 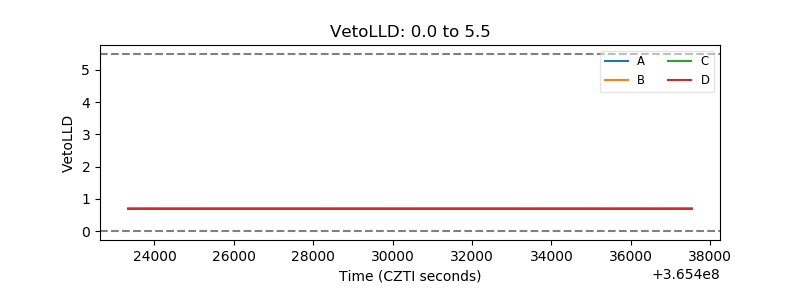 |
| Alpha Counter | 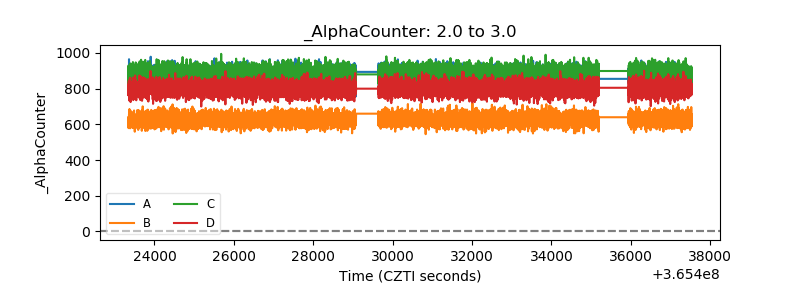 |
| _CPM_Rate | 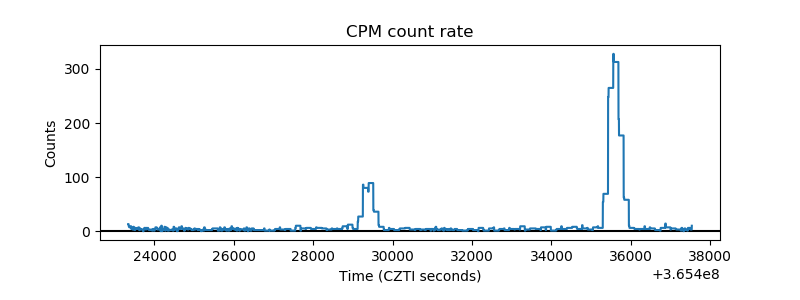 |
| CZT Counter |  |
| +2.5 Volts monitor |  |
| +5 Volts monitor |  |
| _ROLL_ROT | 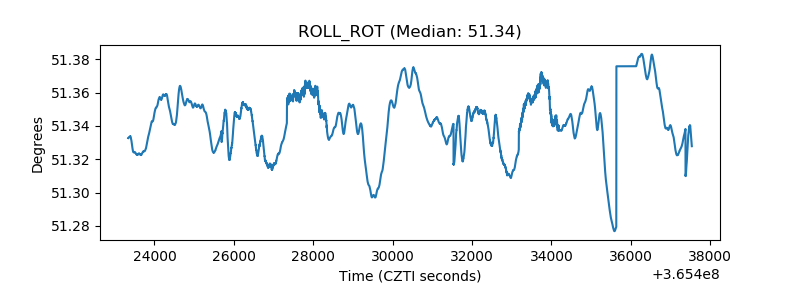 |
| _Roll_DEC | 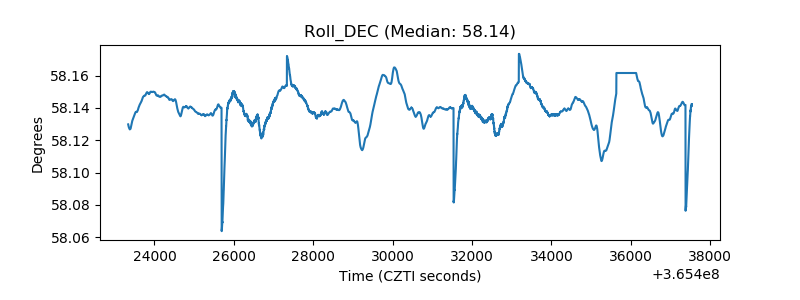 |
| _Roll_RA |  |
| Veto Counter | 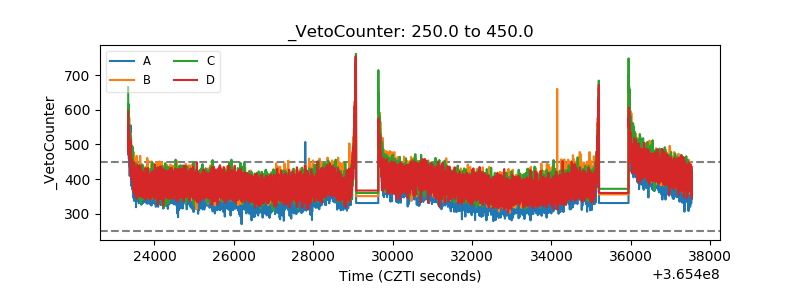 |