| Param | Original file | Final file |
|---|---|---|
| Filename | modeM0/AS1A10_082T10_9000004602_31580cztM0_level2.evt | modeM0/AS1A10_082T10_9000004602_31580cztM0_level2_quad_clean.evt |
| Size (bytes) | 158,299,200 | 14,532,480 |
| Size | 151.0 MB | 13.9 MB |
| Events in quadrant A | 873,653 | 83,023 |
| Events in quadrant B | 1,432,495 | 82,442 |
| Events in quadrant C | 940,731 | 77,409 |
| Events in quadrant D | 1,433,859 | 75,962 |
| Mode M9 | |||
|---|---|---|---|
| Quadrant | BADHDUFLAG | Total packets | Discarded packets |
| A | 0 | 6 | 0 |
| B | 0 | 7 | 0 |
| C | 0 | 7 | 0 |
| D | 0 | 7 | 0 |
| Mode M0 | |||
|---|---|---|---|
| Quadrant | BADHDUFLAG | Total packets | Discarded packets |
| A | 0 | 3540 | 1 |
| B | 0 | 5270 | 1 |
| C | 0 | 3771 | 1 |
| D | 0 | 5477 | 1 |
| Mode SS | |||
|---|---|---|---|
| Quadrant | BADHDUFLAG | Total packets | Discarded packets |
| A | 0 | 34 | 0 |
| B | 0 | 34 | 0 |
| C | 0 | 34 | 0 |
| D | 0 | 34 | 0 |
| Quadrant | Total seconds | Saturated seconds | Saturation percentage |
|---|---|---|---|
| A | 1632 | 13 | 0.796569% |
| B | 1632 | 45 | 2.757353% |
| C | 1632 | 43 | 2.634804% |
| D | 1632 | 67 | 4.105392% |
Noise dominated data is calculated using 1-second bins in cleaned event files. If a bin has >2000 counts, and if more than 50% of those come from <1% of pixels, then it is considered to be noise-dominated and hence unusable.
| Quadrant | # 1 sec bins | Bins with >0 counts | Bins with >2000 counts | High rate bins dominated by noise | Noise dominated (total time) | Noise dominated (detector-on time) | Marked lightcurve |
|---|---|---|---|---|---|---|---|
| A | 1632 | 1632 | 0 | 0 | 0.00% | 0.00% | 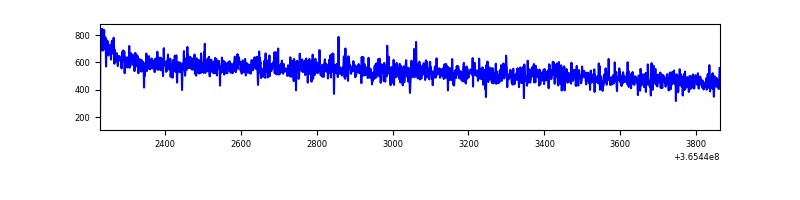 |
| B | 1632 | 1632 | 9 | 9 | 0.55% | 0.55% | 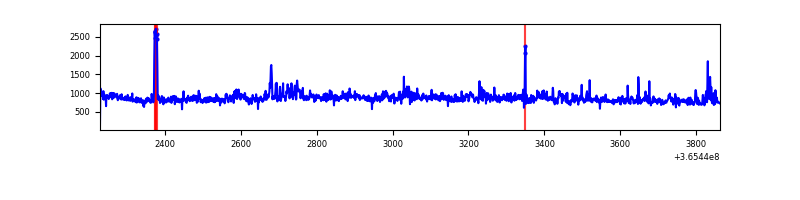 |
| C | 1632 | 1632 | 0 | 0 | 0.00% | 0.00% |  |
| D | 1632 | 1632 | 29 | 29 | 1.78% | 1.78% | 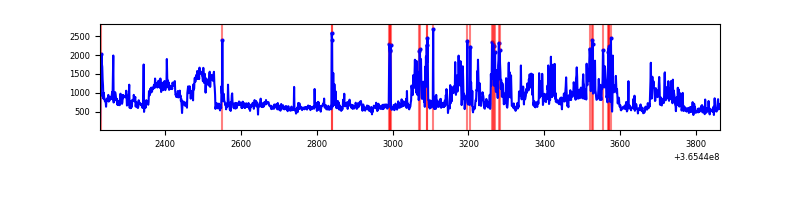 |
Top three noisy pixels from each quadrant. If the there are fewer than three noisy pixels in the level2.evt file, extra rows are filled as -1
| Pixel properties | Quadrant properties | ||||||
|---|---|---|---|---|---|---|---|
| Quadrant | DetID | PixID | Counts | Sigma | Mean | Median | Sigma |
| A | 13 | 254 | 3279 | 64.12 | 226 | 220 | 47.7 |
| A | 3 | 137 | 2194 | 41.38 | 226 | 220 | 47.7 |
| A | 0 | 226 | 1879 | 34.78 | 226 | 220 | 47.7 |
| B | 6 | 159 | 445640 | 10206.42 | 221 | 216 | 43.6 |
| B | 4 | 80 | 79614 | 1819.32 | 221 | 216 | 43.6 |
| B | 0 | 137 | 18067 | 409.04 | 221 | 216 | 43.6 |
| C | 14 | 238 | 35334 | 662.88 | 216 | 217 | 53.0 |
| C | 4 | 175 | 23754 | 444.29 | 216 | 217 | 53.0 |
| C | 3 | 233 | 23432 | 438.22 | 216 | 217 | 53.0 |
| D | 8 | 195 | 287259 | 5381.95 | 217 | 210 | 53.3 |
| D | 2 | 250 | 254833 | 4773.99 | 217 | 210 | 53.3 |
| D | 13 | 249 | 16082 | 297.59 | 217 | 210 | 53.3 |
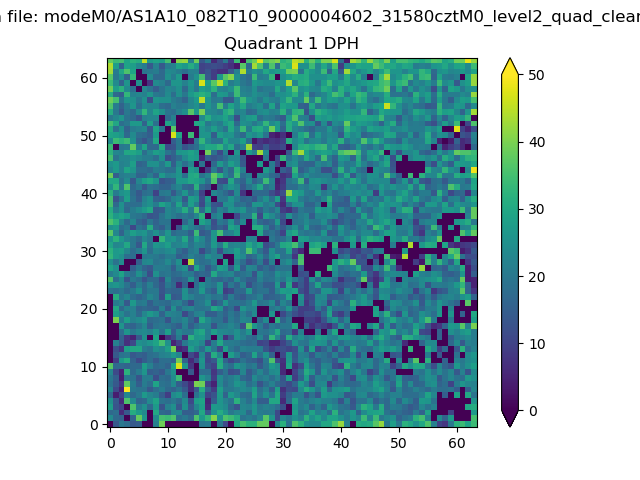
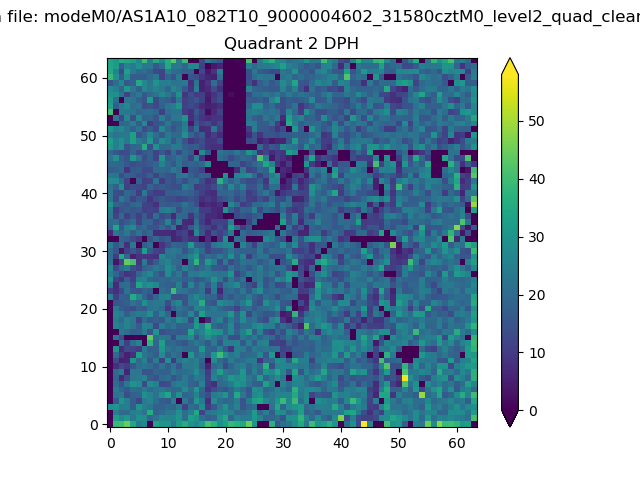
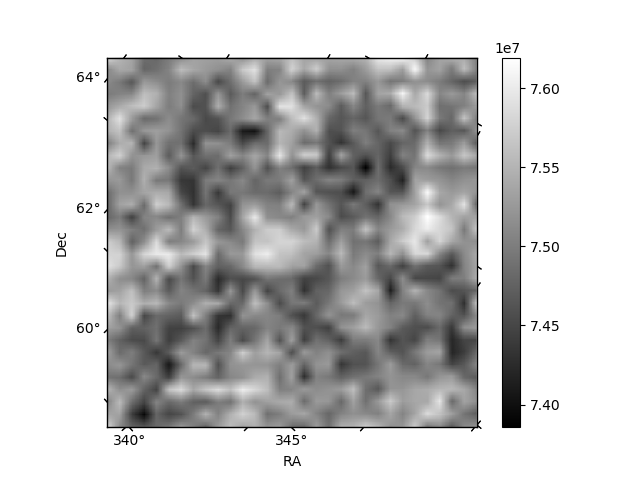
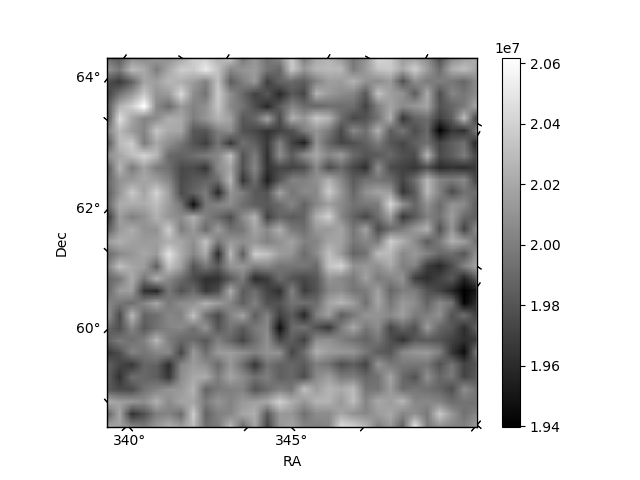
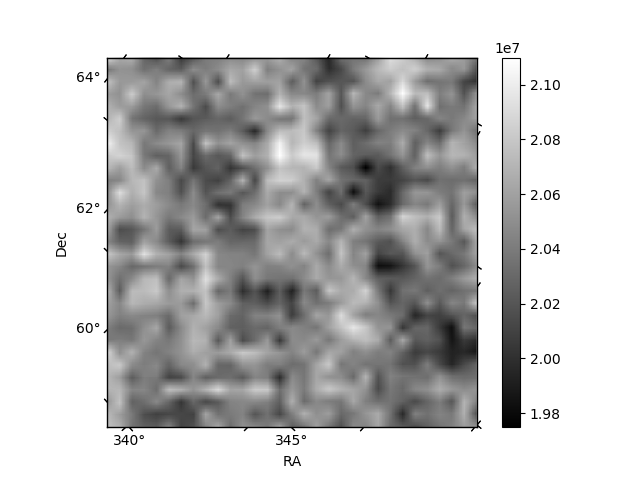
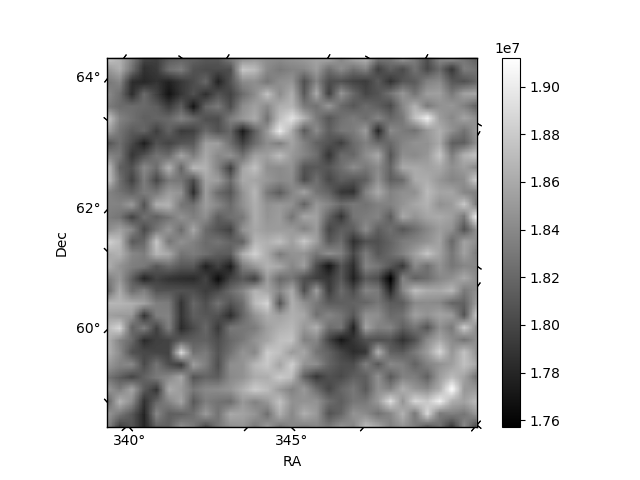
Histogram calculated using DETX and DETY for each event in the final _common_clean file
| Quadrant A | 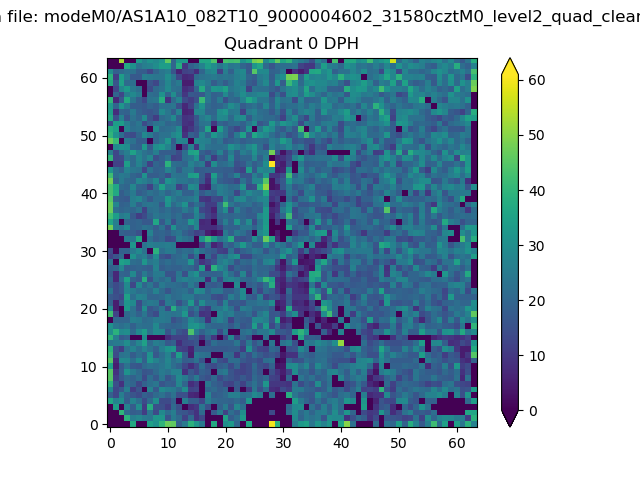 |
 |
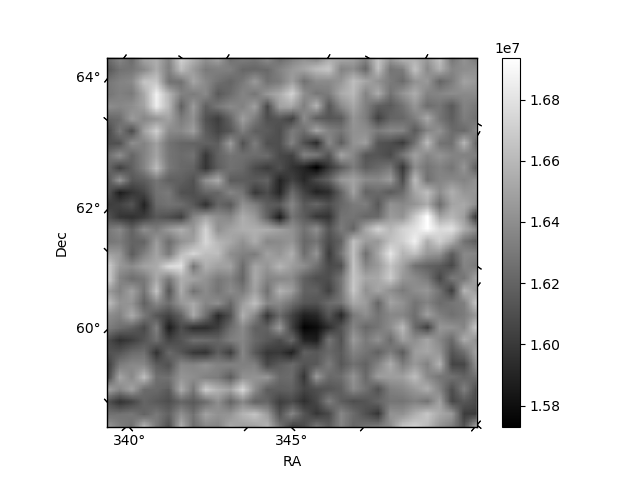
Quadrant B |
|---|---|---|---|
| Quadrant D | 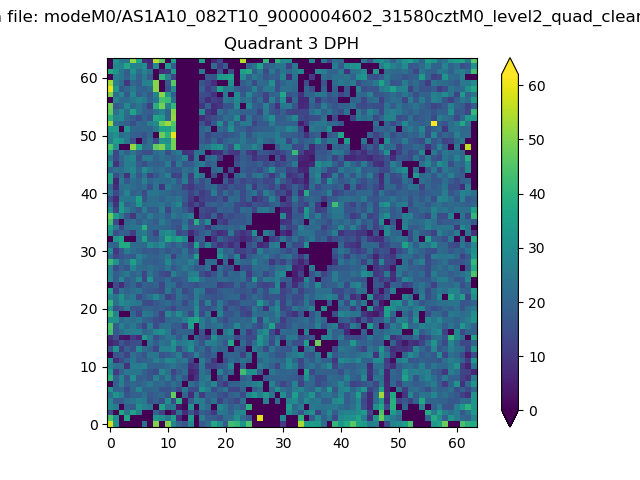 |
 |
Quadrant C |
| Plot type | Count rate plots | Images |
|---|---|---|
| Comparison with Poisson distribution Blue bars denote a histogram of data divided into 1 sec bins. Red curve is a Poisson curve with rate = median count rate of data. |
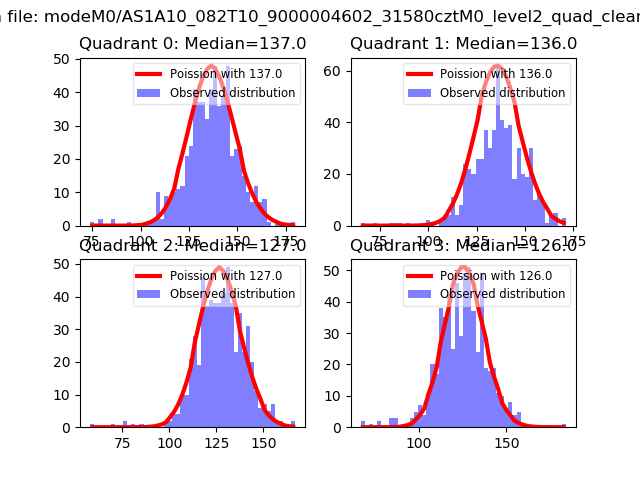 |
 |
| Quadrant-wise count rates Data is divided into 100 sec bins |
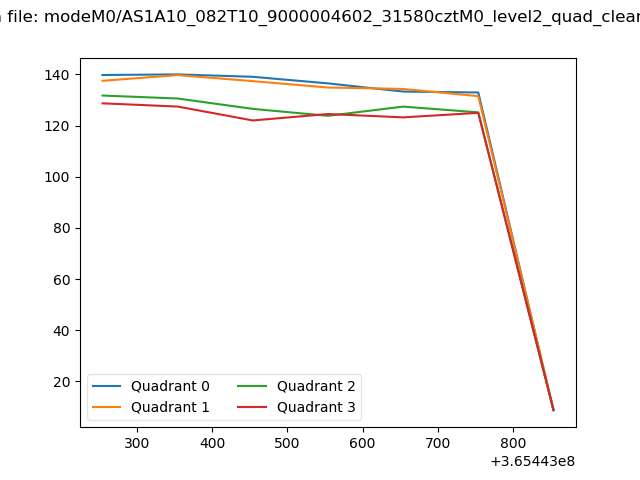 |
|
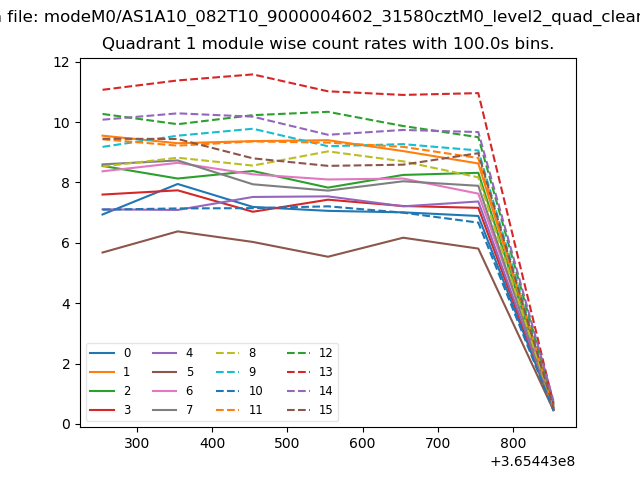
| Module-wise count rates for Quadrant A Data is divided into 100 sec bins |
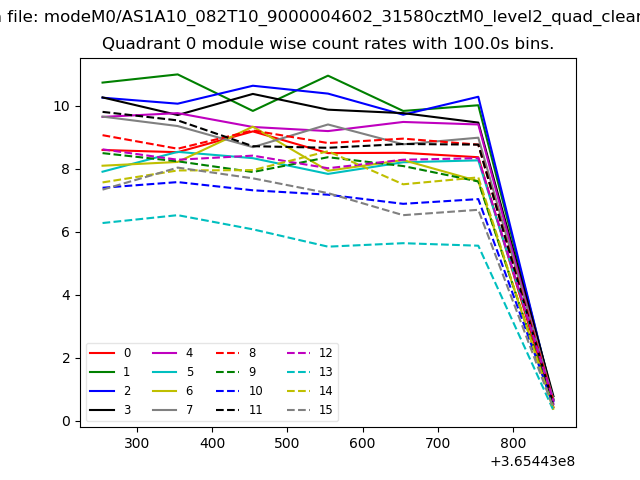 |
 |
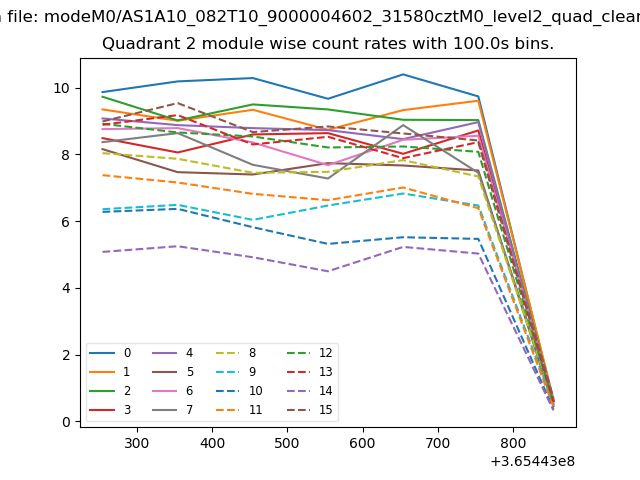
| Module-wise count rates for Quadrant B Data is divided into 100 sec bins |
 |
 |
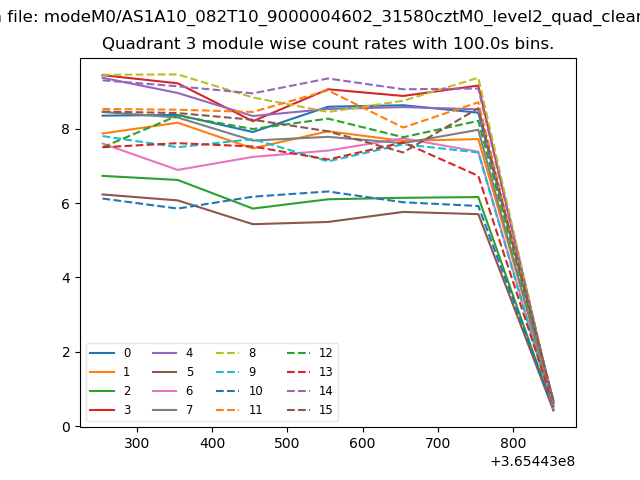
| Module-wise count rates for Quadrant C Data is divided into 100 sec bins |
 |
 |
| Module-wise count rates for Quadrant D Data is divided into 100 sec bins |
 |
 |
| Parameter | Plot |
|---|---|
| CZT HV Monitor | 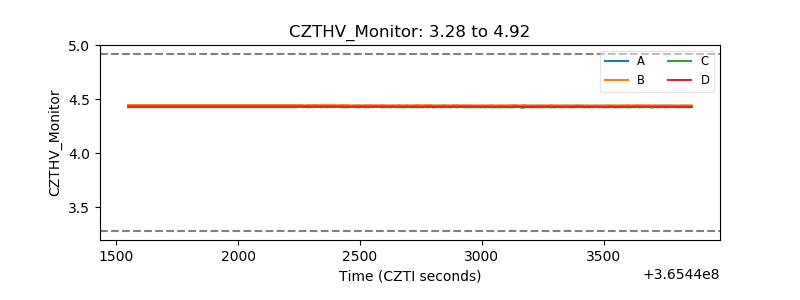 |
| D_VDD | 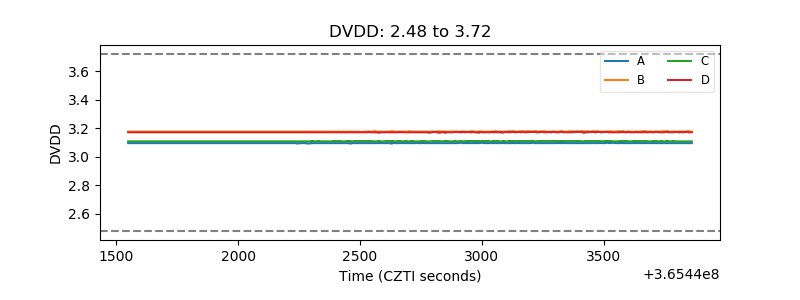 |
| Temperature 1 | 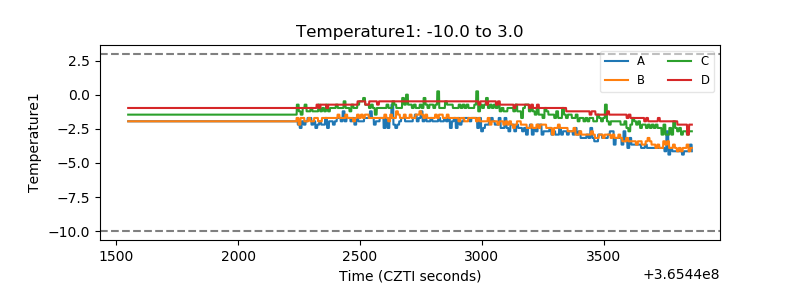 |
| Veto HV Monitor | 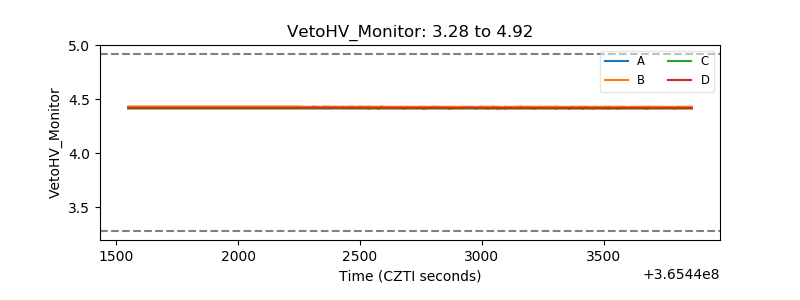 |
| Veto LLD | 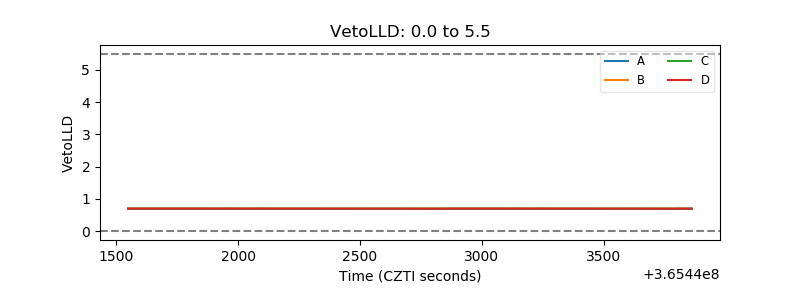 |
| Alpha Counter | 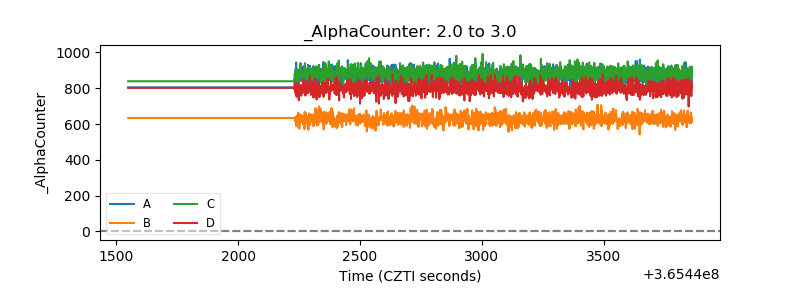 |
| _CPM_Rate | 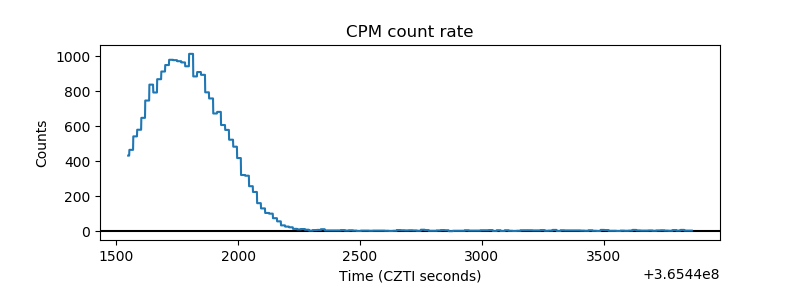 |
| CZT Counter | 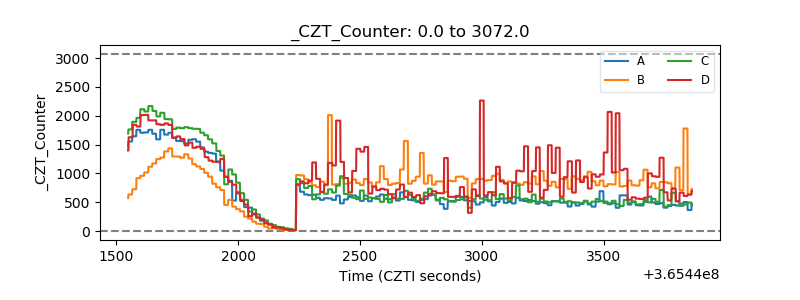 |
| +2.5 Volts monitor |  |
| +5 Volts monitor |  |
| _ROLL_ROT | 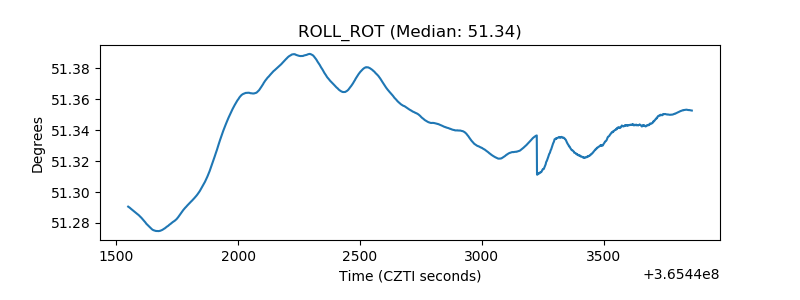 |
| _Roll_DEC | 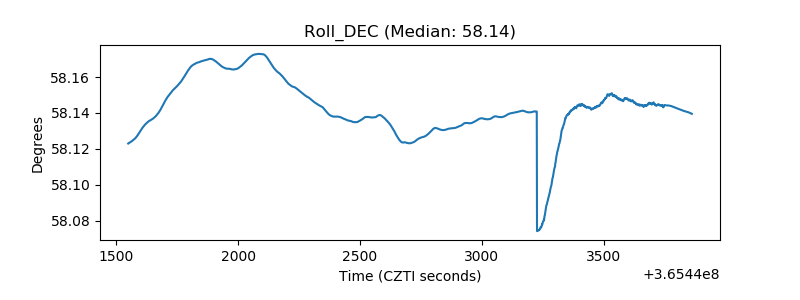 |
| _Roll_RA | 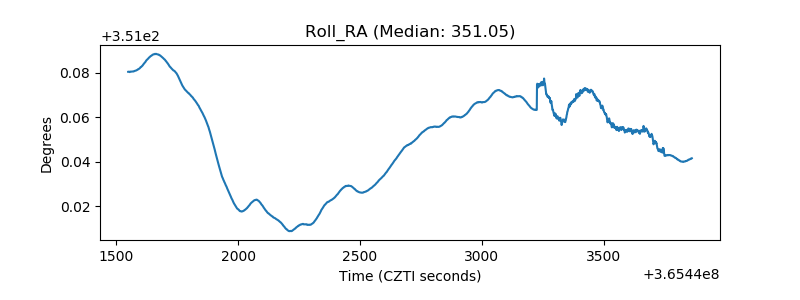 |
| Veto Counter | 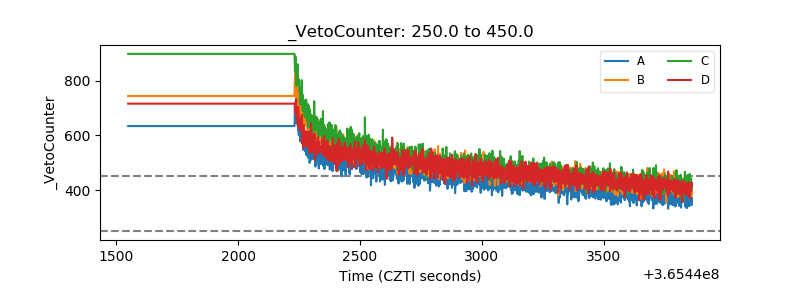 |