| Param | Original file | Final file |
|---|---|---|
| Filename | modeM0/AS1A10_094T72_9000004604cztM0_level2.fits | modeM0/AS1A10_094T72_9000004604cztM0_level2_quad_clean.evt |
| Size (bytes) | 94,559,040 | 90,164,160 |
| Size | 90.2 MB | 86.0 MB |
| Events in quadrant A | 605,236 | 551,293 |
| Events in quadrant B | 553,152 | 542,851 |
| Events in quadrant C | 578,926 | 516,497 |
| Events in quadrant D | 479,138 | 472,214 |
| Mode M9 | |||
|---|---|---|---|
| Quadrant | BADHDUFLAG | Total packets | Discarded packets |
| A | 0 | 22 | 0 |
| B | 0 | 22 | 0 |
| C | 0 | 22 | 0 |
| D | 0 | 22 | 0 |
| Mode M0 | |||
|---|---|---|---|
| Quadrant | BADHDUFLAG | Total packets | Discarded packets |
| A | 0 | 19557 | 0 |
| B | 0 | 30535 | 0 |
| C | 0 | 20292 | 0 |
| D | 0 | 29306 | 0 |
| Mode SS | |||
|---|---|---|---|
| Quadrant | BADHDUFLAG | Total packets | Discarded packets |
| A | 0 | 192 | 0 |
| B | 0 | 192 | 0 |
| C | 0 | 192 | 0 |
| D | 0 | 192 | 0 |
| Quadrant | Total seconds | Saturated seconds | Saturation percentage |
|---|---|---|---|
| A | 9325 | 44 | 0.471850% |
| B | 9325 | 387 | 4.150134% |
| C | 9325 | 147 | 1.576408% |
| D | 9325 | 871 | 9.340483% |
Noise dominated data is calculated using 1-second bins in cleaned event files. If a bin has >2000 counts, and if more than 50% of those come from <1% of pixels, then it is considered to be noise-dominated and hence unusable.
| Quadrant | # 1 sec bins | Bins with >0 counts | Bins with >2000 counts | High rate bins dominated by noise | Noise dominated (total time) | Noise dominated (detector-on time) | Marked lightcurve |
|---|---|---|---|---|---|---|---|
| A | 11565 | 9323 | 0 | 0 | 0.00% | 0.00% |  |
| B | 11565 | 9321 | 0 | 0 | 0.00% | 0.00% | 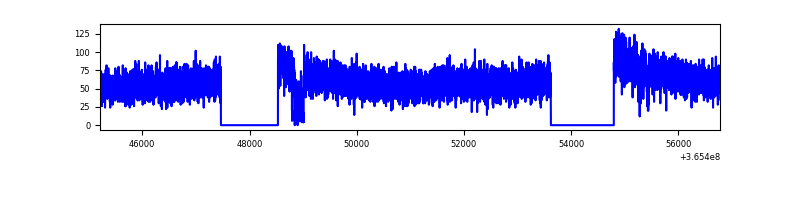 |
| C | 11565 | 9323 | 0 | 0 | 0.00% | 0.00% | 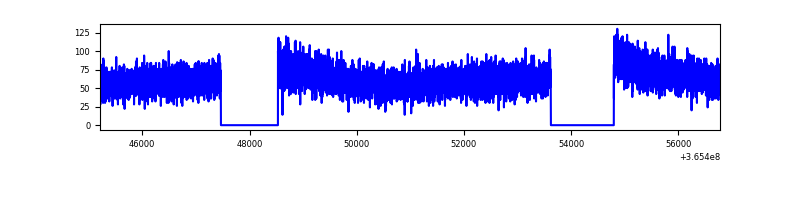 |
| D | 11565 | 9305 | 0 | 0 | 0.00% | 0.00% | 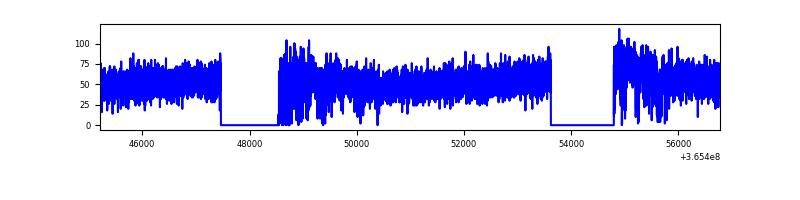 |
Top three noisy pixels from each quadrant. If the there are fewer than three noisy pixels in the level2.evt file, extra rows are filled as -1
| Pixel properties | Quadrant properties | ||||||
|---|---|---|---|---|---|---|---|
| Quadrant | DetID | PixID | Counts | Sigma | Mean | Median | Sigma |
| A | 0 | 29 | 597 | 11.12 | 157 | 149 | 40.3 |
| A | 9 | 19 | 475 | 8.09 | 157 | 149 | 40.3 |
| A | 0 | 30 | 469 | 7.94 | 157 | 149 | 40.3 |
| B | 2 | 9 | 430 | 9.41 | 146 | 140 | 30.8 |
| B | 14 | 254 | 380 | 7.79 | 146 | 140 | 30.8 |
| B | 3 | 80 | 379 | 7.76 | 146 | 140 | 30.8 |
| C | 1 | 81 | 494 | 8.76 | 152 | 144 | 39.9 |
| C | 1 | 80 | 464 | 8.01 | 152 | 144 | 39.9 |
| C | 3 | 202 | 457 | 7.84 | 152 | 144 | 39.9 |
| D | 10 | 189 | 359 | 6.14 | 136 | 124 | 38.3 |
| D | 4 | 246 | 344 | 5.75 | 136 | 124 | 38.3 |
| D | 6 | 62 | 334 | 5.49 | 136 | 124 | 38.3 |
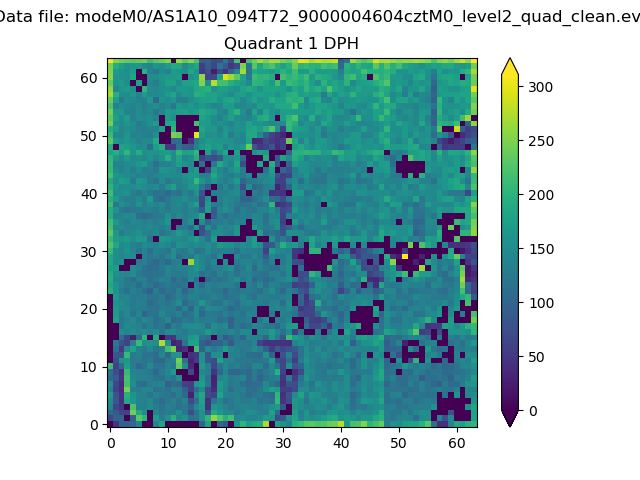
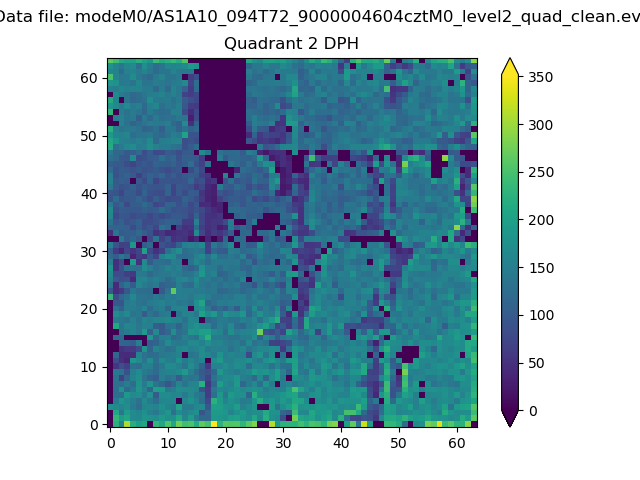
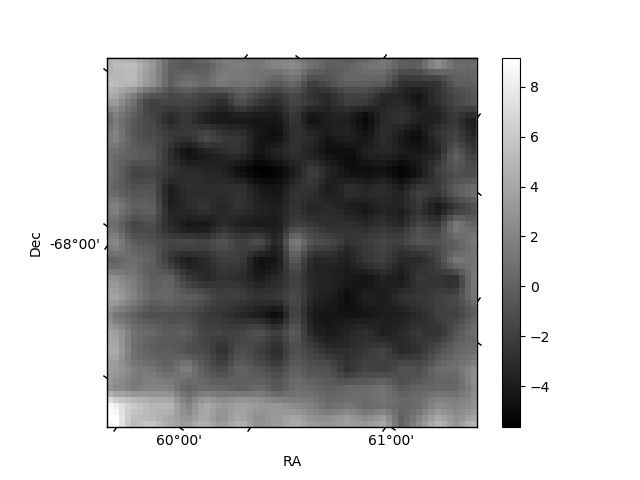
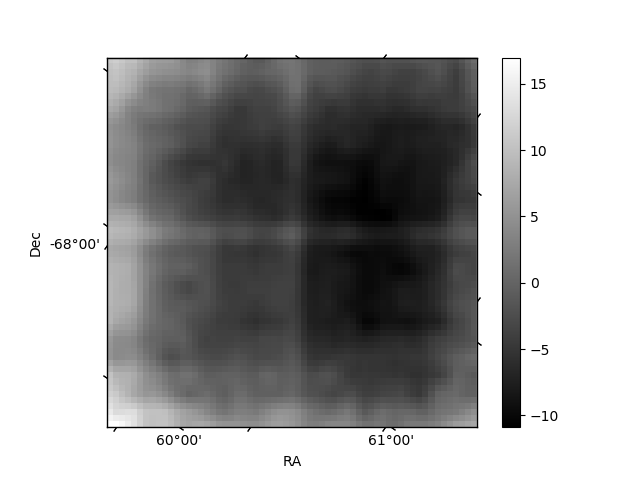
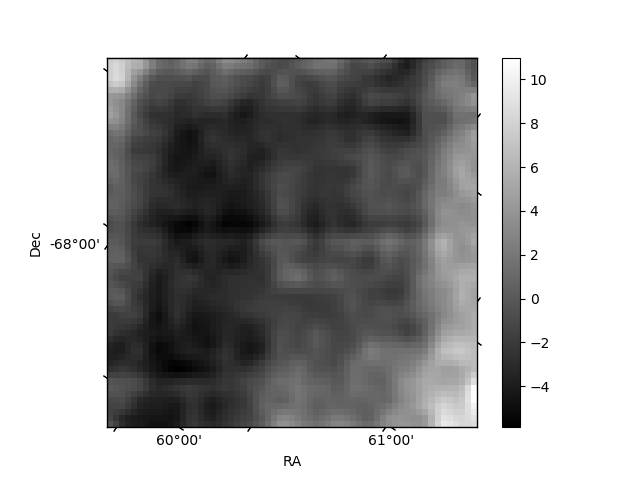
Histogram calculated using DETX and DETY for each event in the final _common_clean file
| Quadrant A |  |
 |
Quadrant B |
|---|---|---|---|
| Quadrant D | 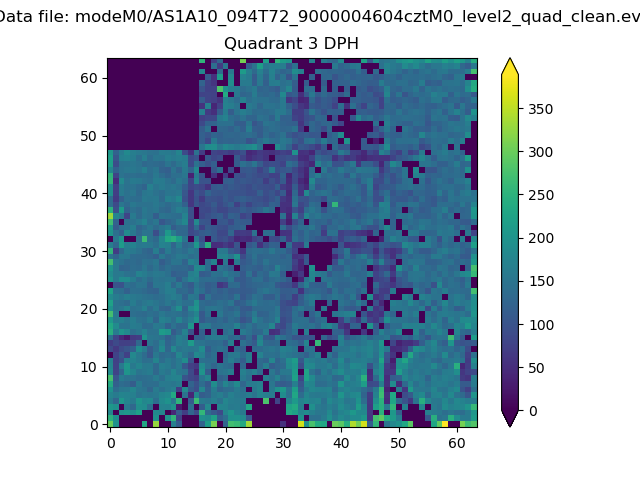 |
 |
Quadrant C |
| Plot type | Count rate plots | Images |
|---|---|---|
| Comparison with Poisson distribution Blue bars denote a histogram of data divided into 1 sec bins. Red curve is a Poisson curve with rate = median count rate of data. |
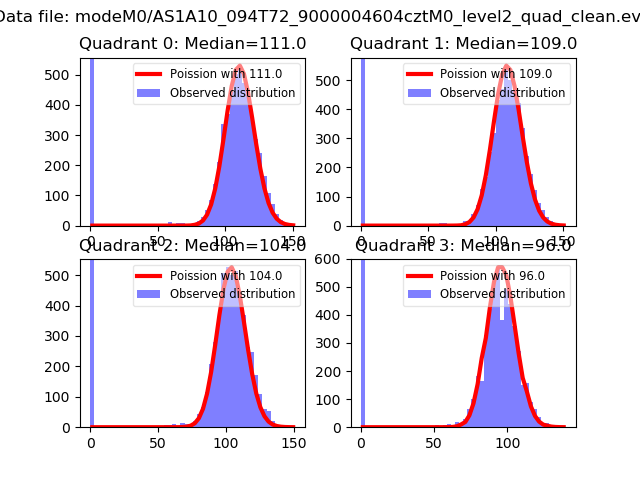 |
 |
| Quadrant-wise count rates Data is divided into 100 sec bins |
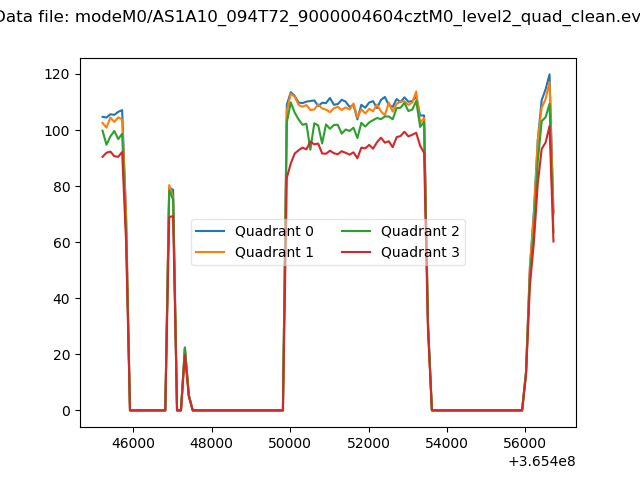 |
|
| Module-wise count rates for Quadrant A Data is divided into 100 sec bins |
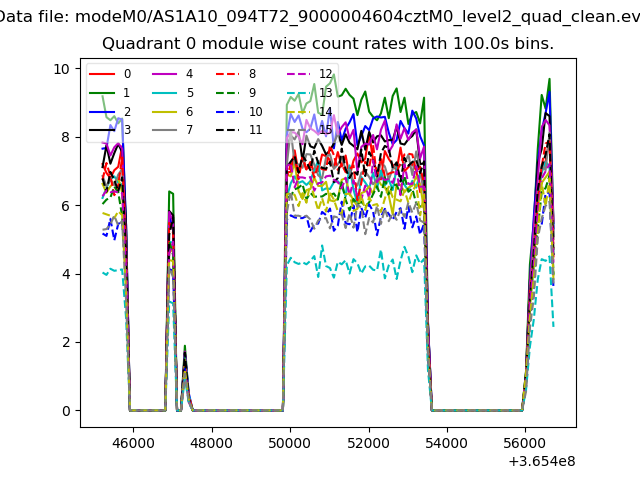 |
 |
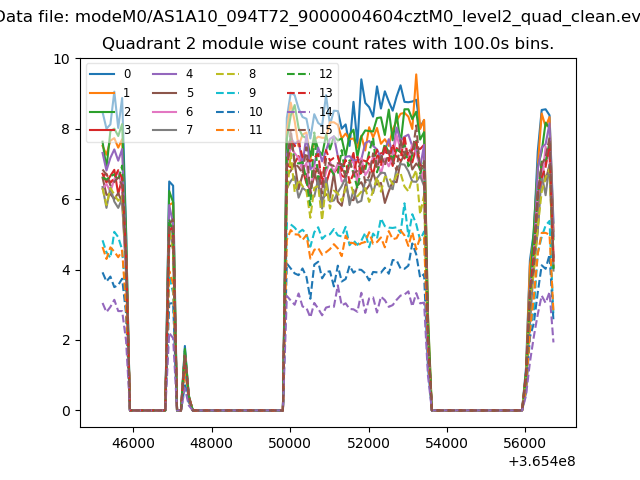
| Module-wise count rates for Quadrant B Data is divided into 100 sec bins |
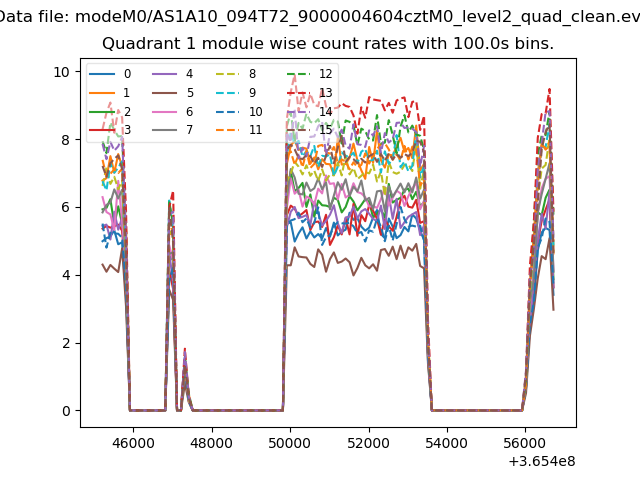 |
 |
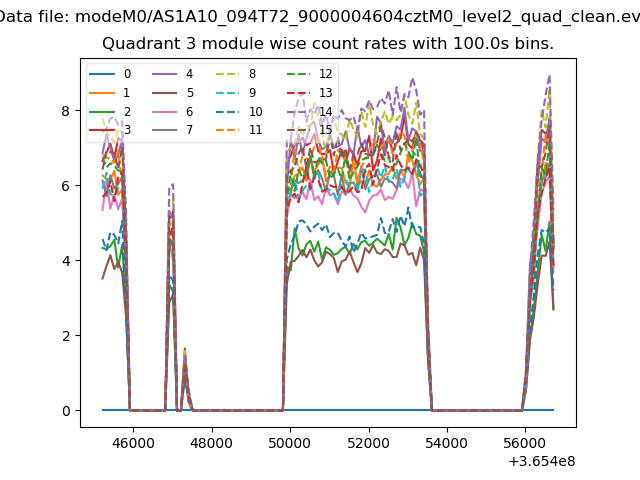
| Module-wise count rates for Quadrant C Data is divided into 100 sec bins |
 |
 |
| Module-wise count rates for Quadrant D Data is divided into 100 sec bins |
 |
 |
| Parameter | Plot |
|---|---|
| CZT HV Monitor | 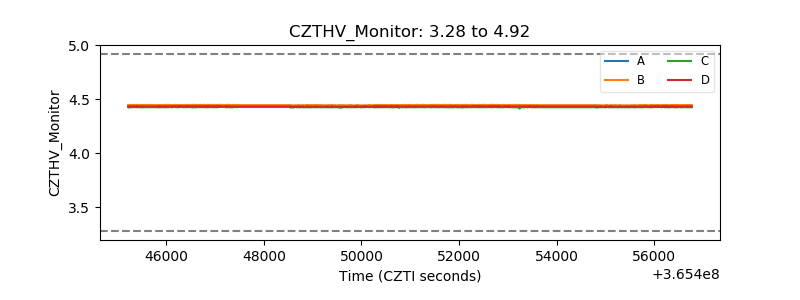 |
| D_VDD | 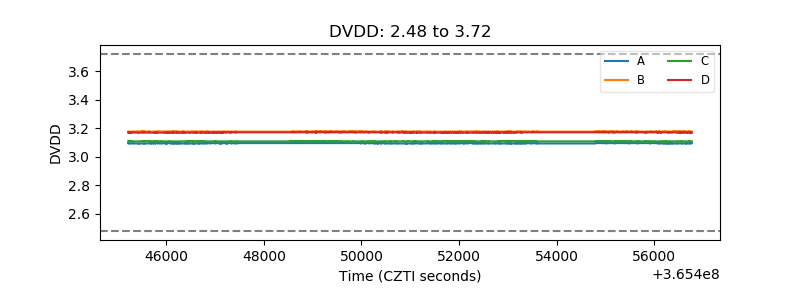 |
| Temperature 1 | 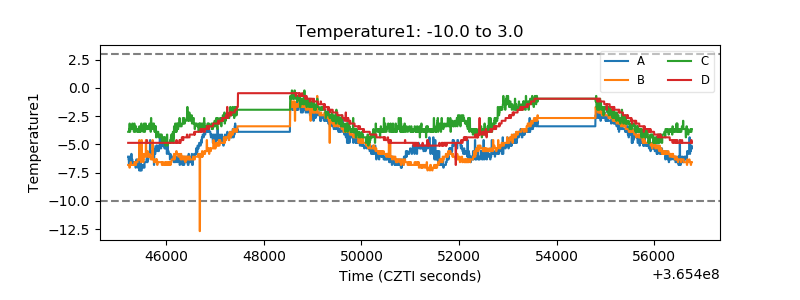 |
| Veto HV Monitor | 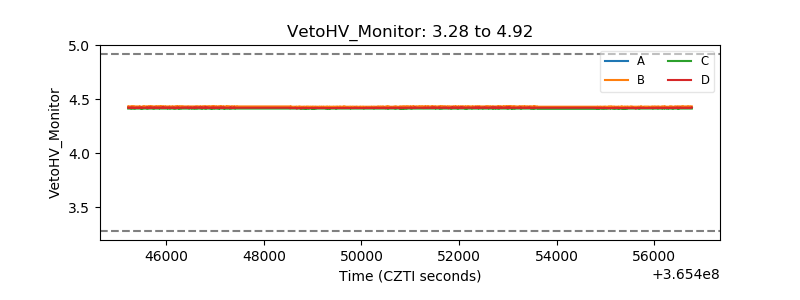 |
| Veto LLD | 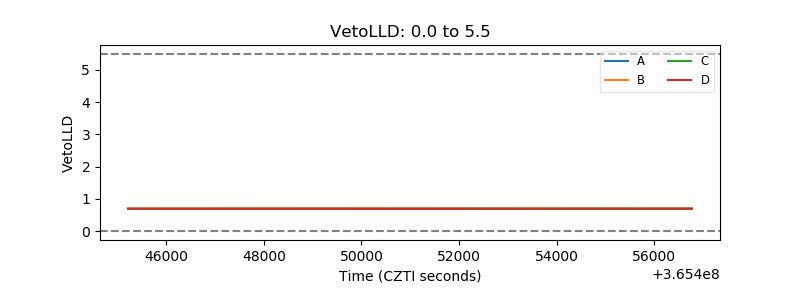 |
| Alpha Counter | 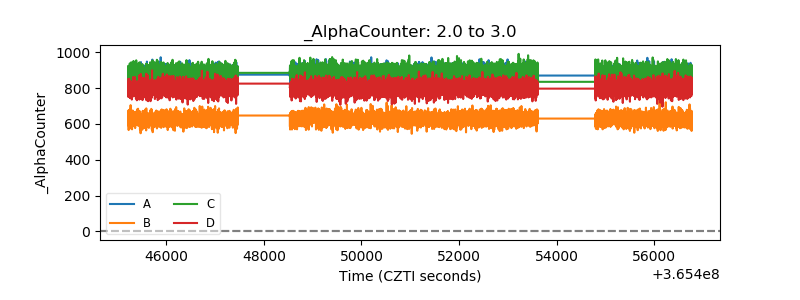 |
| _CPM_Rate | 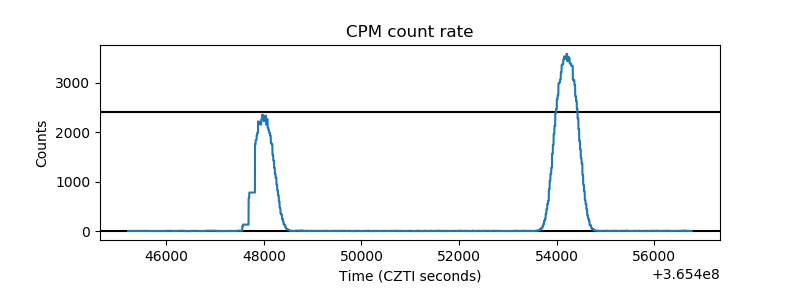 |
| CZT Counter | 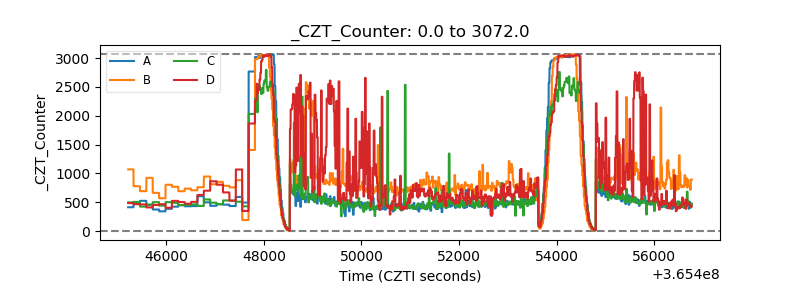 |
| +2.5 Volts monitor | 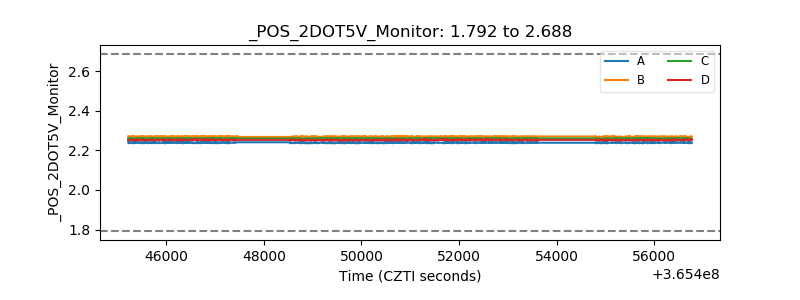 |
| +5 Volts monitor | 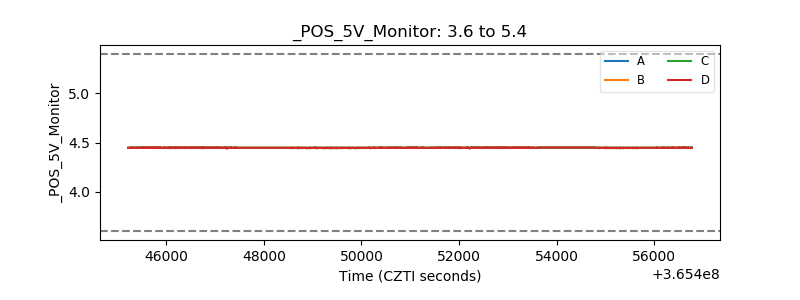 |
| _ROLL_ROT | 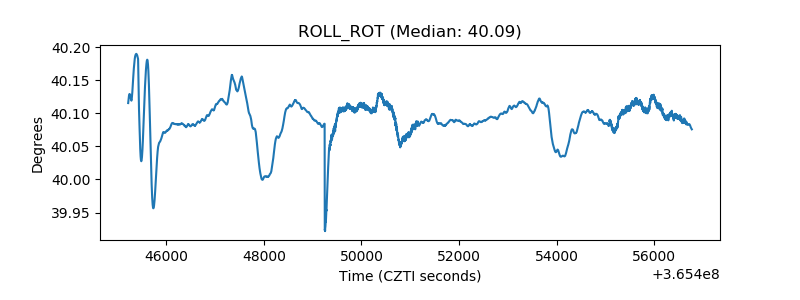 |
| _Roll_DEC | 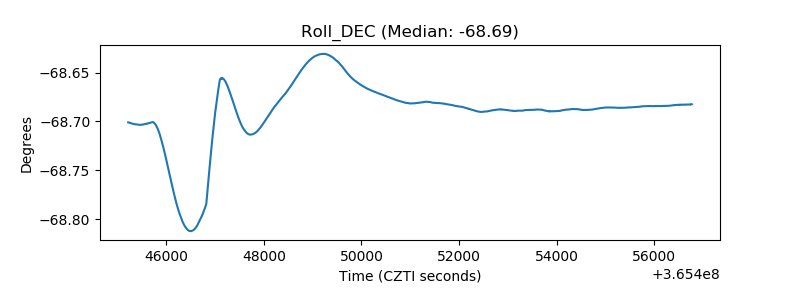 |
| _Roll_RA | 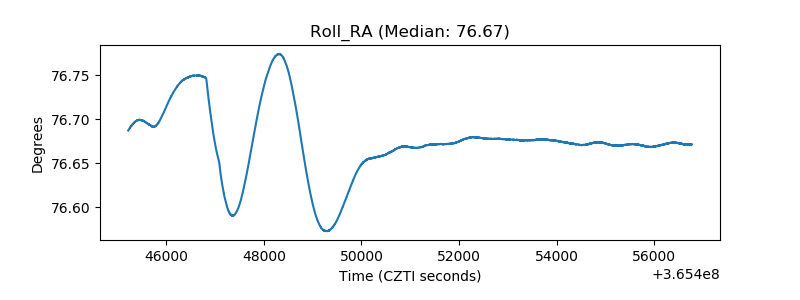 |
| Veto Counter | 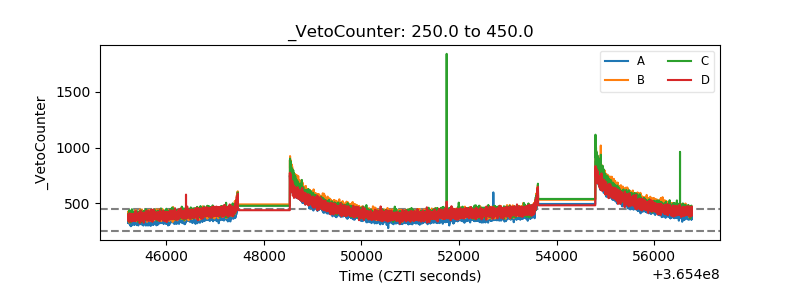 |