| Param | Original file | Final file |
|---|---|---|
| Filename | modeM0/AS1A10_094T72_9000004604_31580cztM0_level2.evt | modeM0/AS1A10_094T72_9000004604_31580cztM0_level2_quad_clean.evt |
| Size (bytes) | 356,777,280 | 74,162,880 |
| Size | 340.2 MB | 70.7 MB |
| Events in quadrant A | 1,839,961 | 523,818 |
| Events in quadrant B | 3,362,593 | 500,818 |
| Events in quadrant C | 1,987,520 | 508,271 |
| Events in quadrant D | 3,359,337 | 447,215 |
| Mode M9 | |||
|---|---|---|---|
| Quadrant | BADHDUFLAG | Total packets | Discarded packets |
| A | 0 | 10 | 0 |
| B | 0 | 10 | 0 |
| C | 0 | 10 | 0 |
| D | 0 | 10 | 0 |
| Mode M0 | |||
|---|---|---|---|
| Quadrant | BADHDUFLAG | Total packets | Discarded packets |
| A | 0 | 7884 | 1 |
| B | 0 | 12660 | 1 |
| C | 0 | 8233 | 1 |
| D | 0 | 12568 | 1 |
| Mode SS | |||
|---|---|---|---|
| Quadrant | BADHDUFLAG | Total packets | Discarded packets |
| A | 0 | 78 | 0 |
| B | 0 | 78 | 0 |
| C | 0 | 78 | 0 |
| D | 0 | 78 | 0 |
| Quadrant | Total seconds | Saturated seconds | Saturation percentage |
|---|---|---|---|
| A | 3752 | 19 | 0.506397% |
| B | 3752 | 254 | 6.769723% |
| C | 3752 | 59 | 1.572495% |
| D | 3752 | 511 | 13.619403% |
Noise dominated data is calculated using 1-second bins in cleaned event files. If a bin has >2000 counts, and if more than 50% of those come from <1% of pixels, then it is considered to be noise-dominated and hence unusable.
| Quadrant | # 1 sec bins | Bins with >0 counts | Bins with >2000 counts | High rate bins dominated by noise | Noise dominated (total time) | Noise dominated (detector-on time) | Marked lightcurve |
|---|---|---|---|---|---|---|---|
| A | 4817 | 3752 | 0 | 0 | 0.00% | 0.00% | 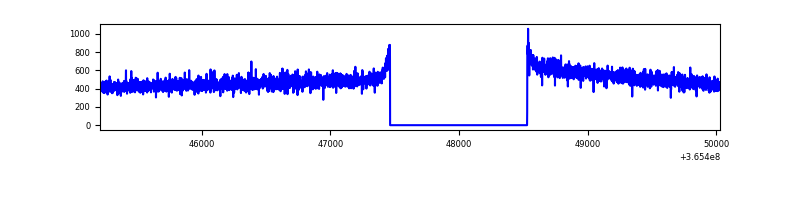 |
| B | 4817 | 3752 | 169 | 169 | 3.51% | 4.50% | 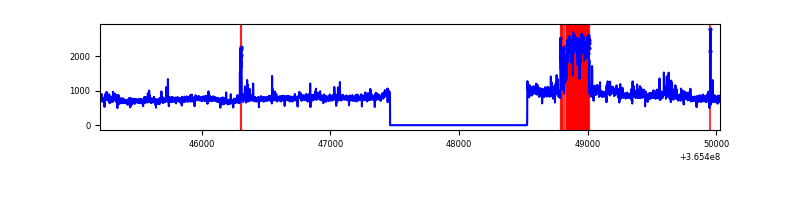 |
| C | 4817 | 3752 | 9 | 9 | 0.19% | 0.24% | 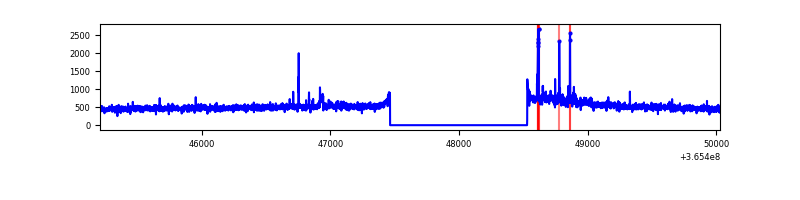 |
| D | 4817 | 3752 | 443 | 443 | 9.20% | 11.81% | 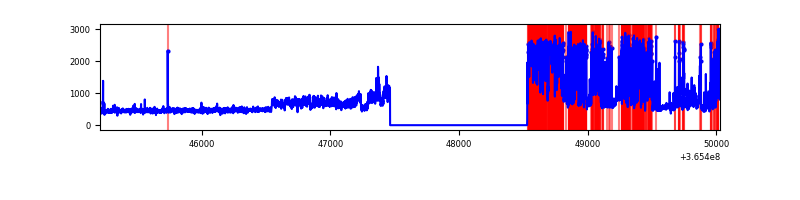 |
Top three noisy pixels from each quadrant. If the there are fewer than three noisy pixels in the level2.evt file, extra rows are filled as -1
| Pixel properties | Quadrant properties | ||||||
|---|---|---|---|---|---|---|---|
| Quadrant | DetID | PixID | Counts | Sigma | Mean | Median | Sigma |
| A | 13 | 254 | 6927 | 67.05 | 477 | 467 | 96.3 |
| A | 3 | 137 | 4688 | 43.81 | 477 | 467 | 96.3 |
| A | 0 | 226 | 3961 | 36.27 | 477 | 467 | 96.3 |
| B | 6 | 159 | 1058036 | 12163.21 | 452 | 441 | 87.0 |
| B | 5 | 172 | 388172 | 4459.23 | 452 | 441 | 87.0 |
| B | 4 | 80 | 74917 | 856.54 | 452 | 441 | 87.0 |
| C | 14 | 238 | 75579 | 699.05 | 458 | 460 | 107.5 |
| C | 3 | 233 | 45526 | 419.38 | 458 | 460 | 107.5 |
| C | 15 | 208 | 36066 | 331.35 | 458 | 460 | 107.5 |
| D | 12 | 218 | 1111764 | 11040.09 | 422 | 412 | 100.7 |
| D | 8 | 195 | 411623 | 4084.94 | 422 | 412 | 100.7 |
| D | 13 | 249 | 78838 | 779.08 | 422 | 412 | 100.7 |
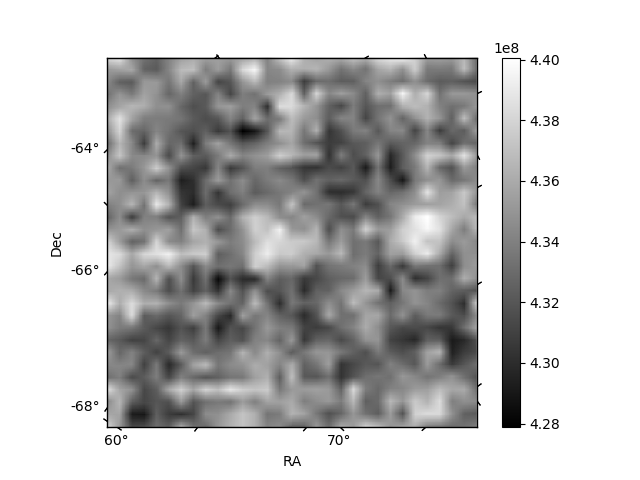
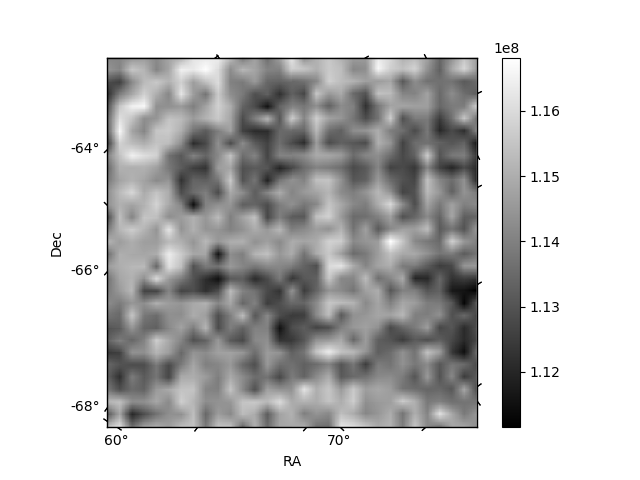
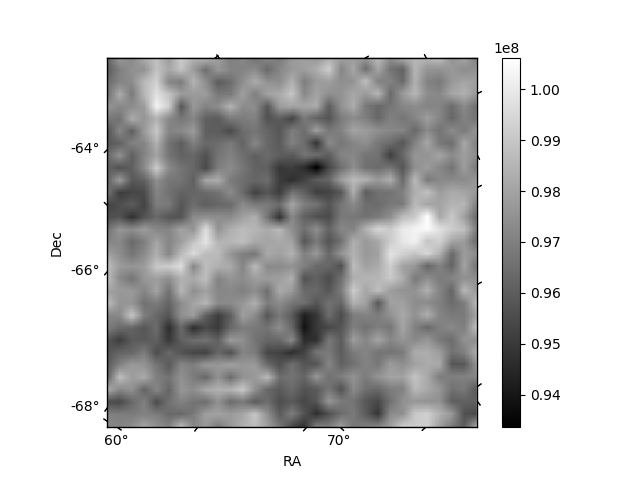
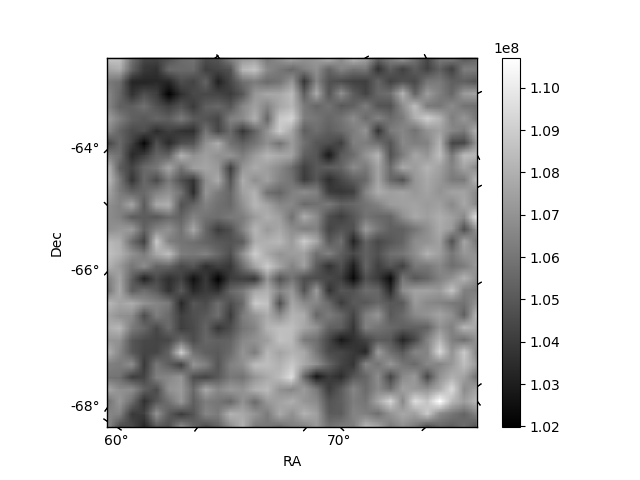
Histogram calculated using DETX and DETY for each event in the final _common_clean file
| Quadrant A | 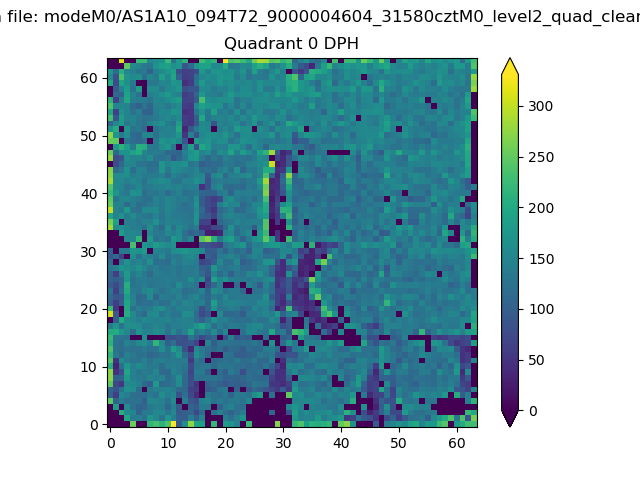 |
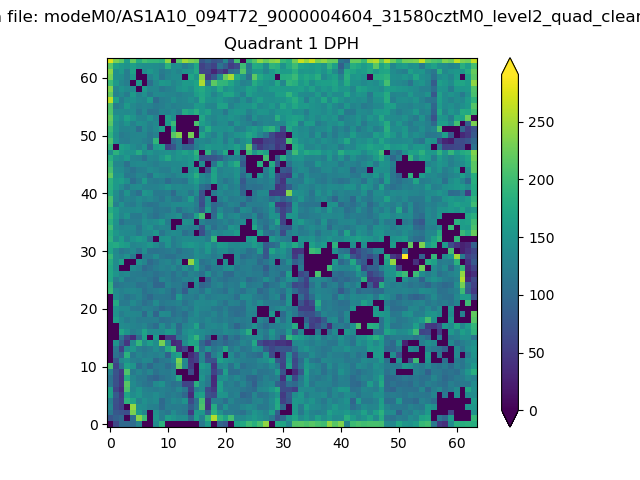 |
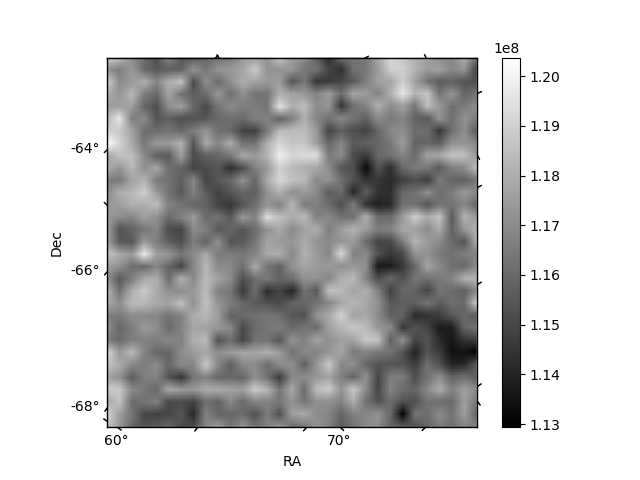
Quadrant B |
|---|---|---|---|
| Quadrant D | 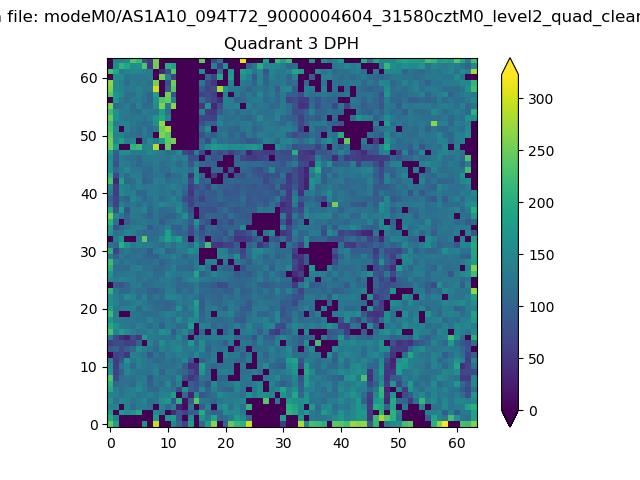 |
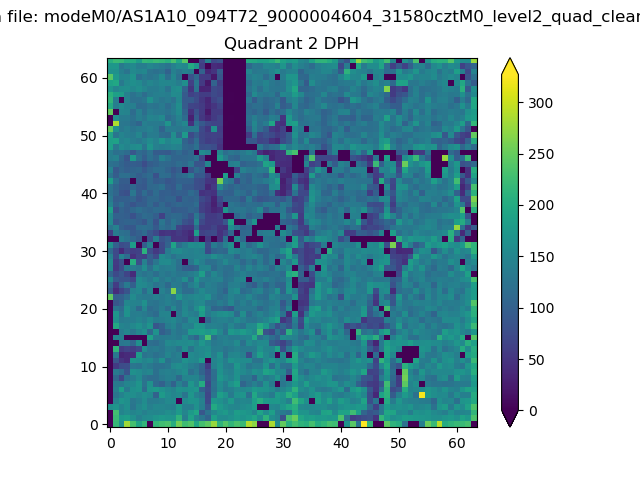 |
Quadrant C |
| Plot type | Count rate plots | Images |
|---|---|---|
| Comparison with Poisson distribution Blue bars denote a histogram of data divided into 1 sec bins. Red curve is a Poisson curve with rate = median count rate of data. |
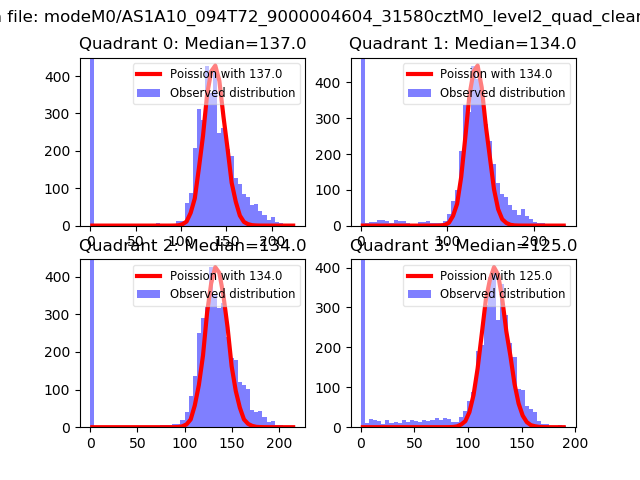 |
 |
| Quadrant-wise count rates Data is divided into 100 sec bins |
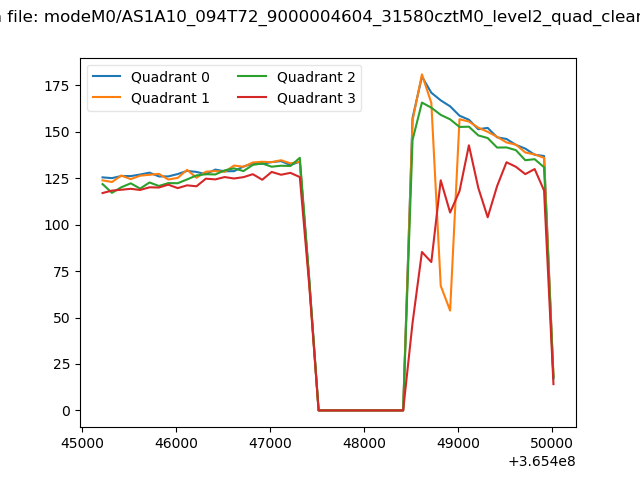 |
|
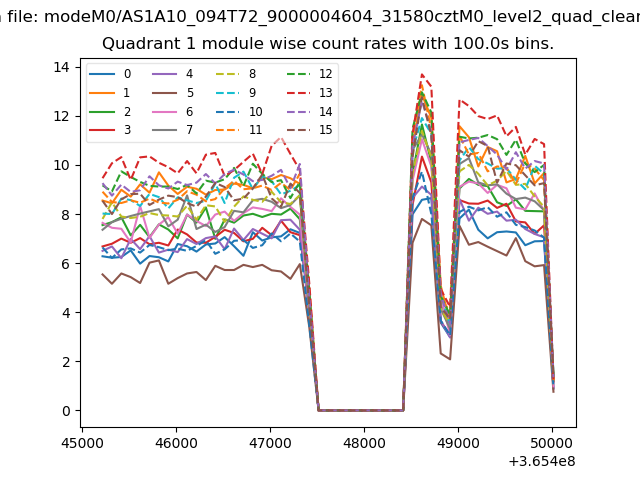
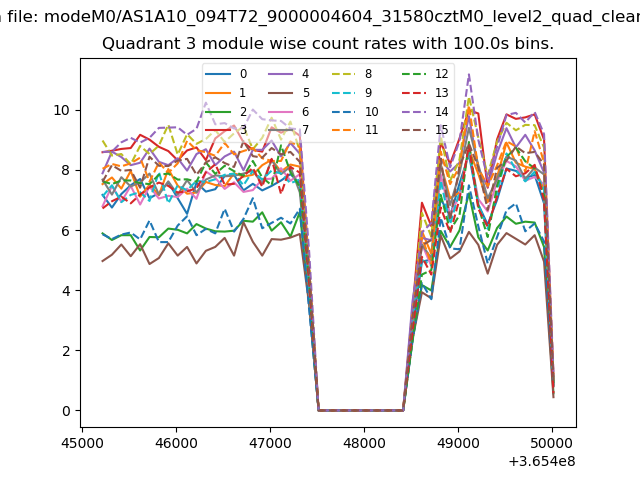
| Module-wise count rates for Quadrant A Data is divided into 100 sec bins |
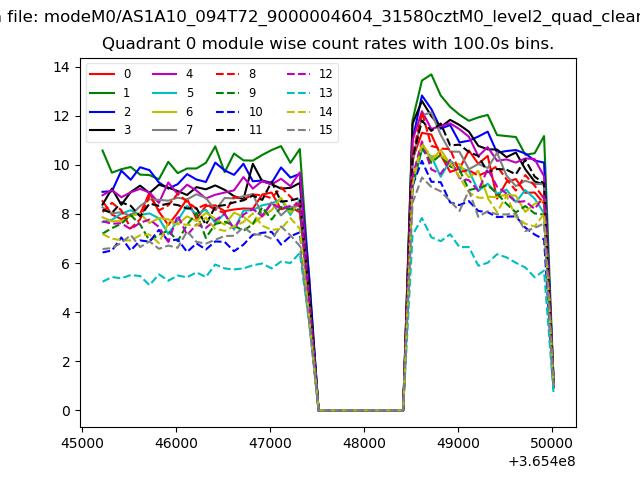 |
 |
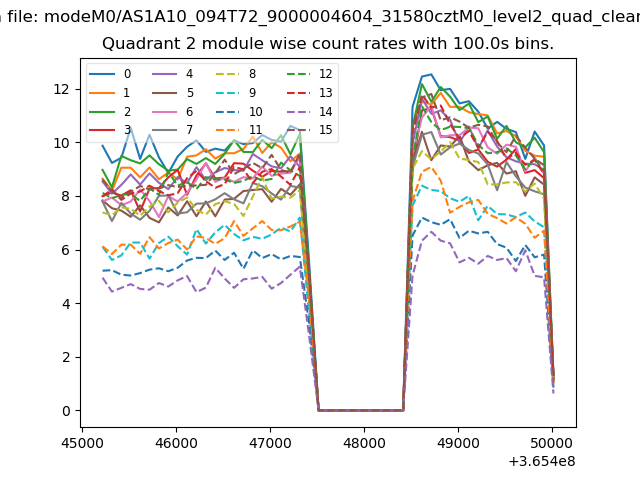
| Module-wise count rates for Quadrant B Data is divided into 100 sec bins |
 |
 |
| Module-wise count rates for Quadrant C Data is divided into 100 sec bins |
 |
 |
| Module-wise count rates for Quadrant D Data is divided into 100 sec bins |
 |
 |
| Parameter | Plot |
|---|---|
| CZT HV Monitor | 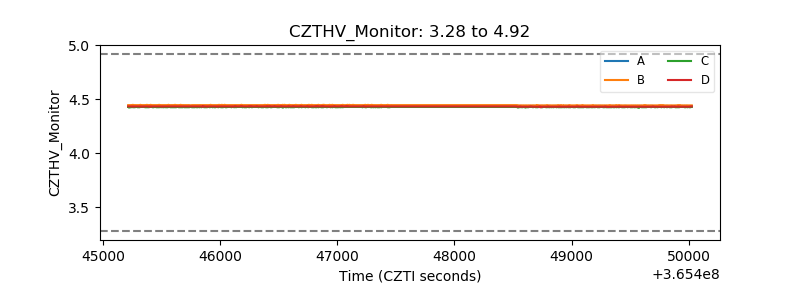 |
| D_VDD | 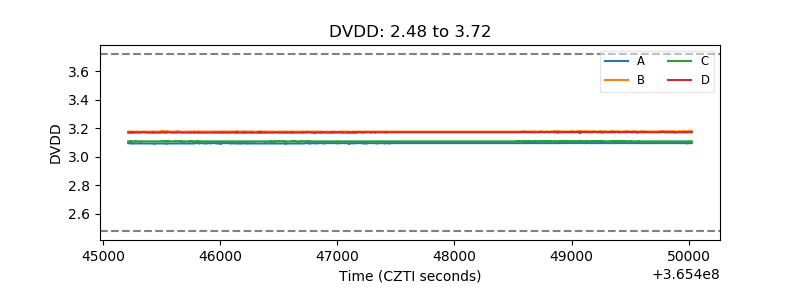 |
| Temperature 1 | 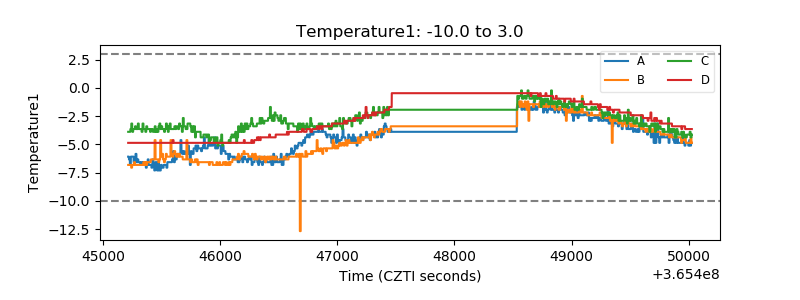 |
| Veto HV Monitor | 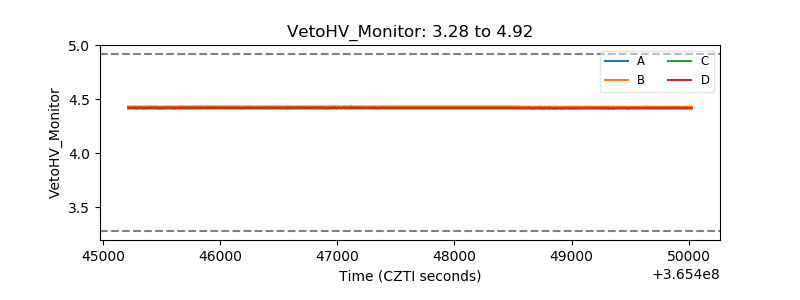 |
| Veto LLD | 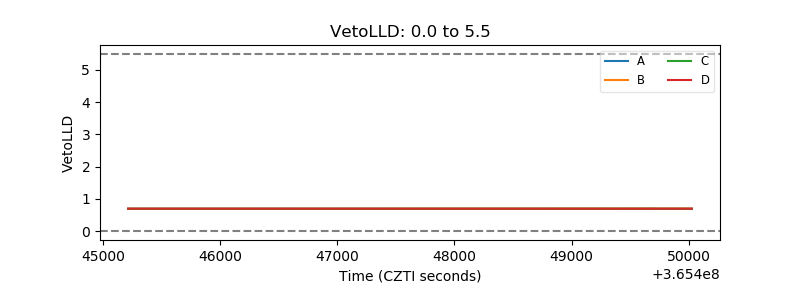 |
| Alpha Counter | 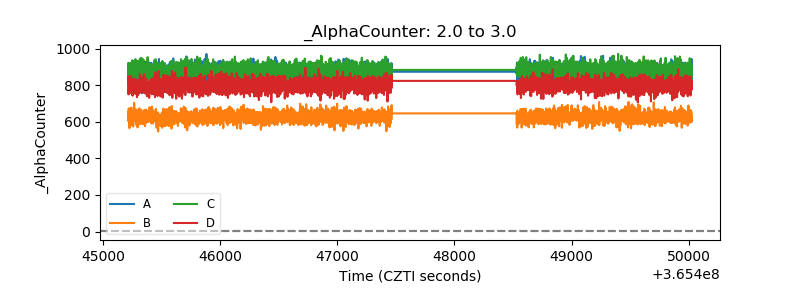 |
| _CPM_Rate | 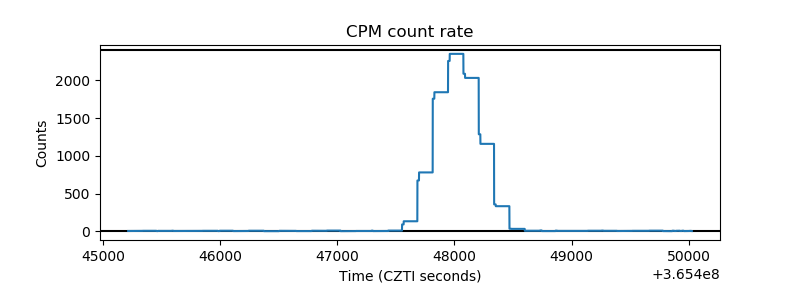 |
| CZT Counter | 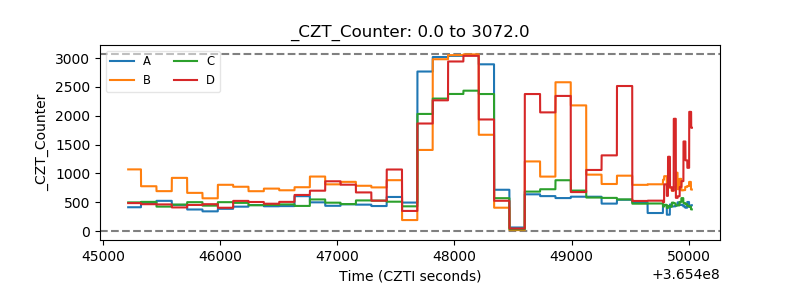 |
| +2.5 Volts monitor |  |
| +5 Volts monitor |  |
| _ROLL_ROT | 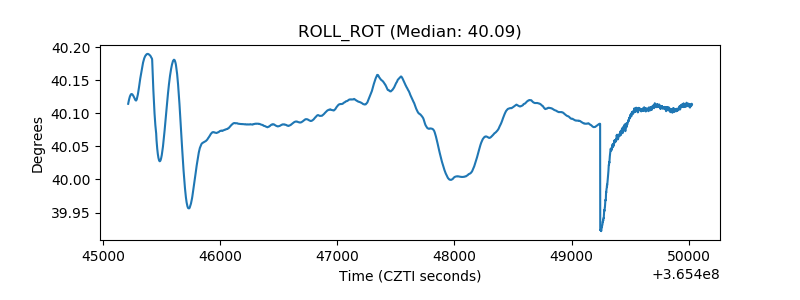 |
| _Roll_DEC | 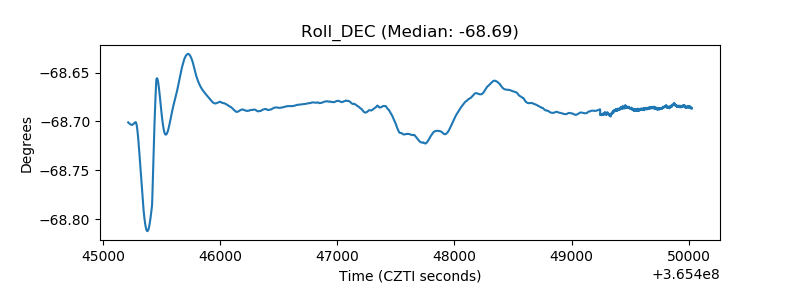 |
| _Roll_RA | 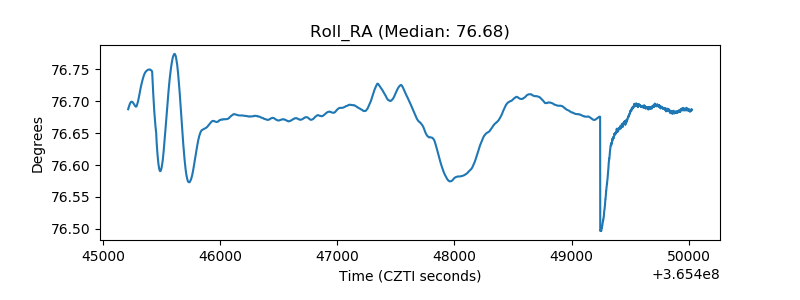 |
| Veto Counter | 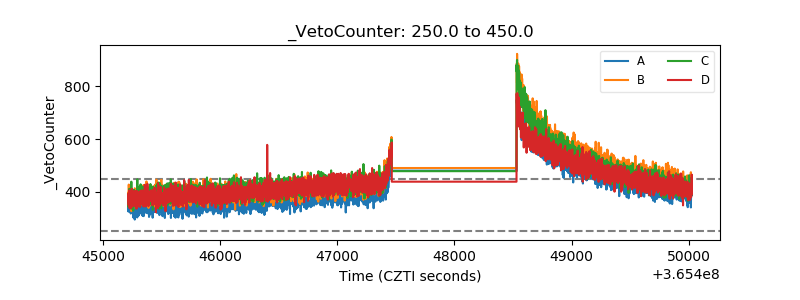 |