| Param | Original file | Final file |
|---|---|---|
| Filename | modeM0/AS1A10_094T72_9000004604_31582cztM0_level2.evt | modeM0/AS1A10_094T72_9000004604_31582cztM0_level2_quad_clean.evt |
| Size (bytes) | 623,594,880 | 133,122,240 |
| Size | 594.7 MB | 127.0 MB |
| Events in quadrant A | 3,201,081 | 946,139 |
| Events in quadrant B | 5,722,708 | 917,558 |
| Events in quadrant C | 3,478,031 | 908,115 |
| Events in quadrant D | 6,045,987 | 808,291 |
| Mode M9 | |||
|---|---|---|---|
| Quadrant | BADHDUFLAG | Total packets | Discarded packets |
| A | 0 | 12 | 0 |
| B | 0 | 13 | 0 |
| C | 0 | 13 | 0 |
| D | 0 | 13 | 0 |
| Mode M0 | |||
|---|---|---|---|
| Quadrant | BADHDUFLAG | Total packets | Discarded packets |
| A | 0 | 13794 | 2 |
| B | 0 | 21716 | 2 |
| C | 0 | 14444 | 2 |
| D | 0 | 22576 | 2 |
| Mode SS | |||
|---|---|---|---|
| Quadrant | BADHDUFLAG | Total packets | Discarded packets |
| A | 0 | 132 | 0 |
| B | 0 | 132 | 0 |
| C | 0 | 132 | 0 |
| D | 0 | 132 | 0 |
| Quadrant | Total seconds | Saturated seconds | Saturation percentage |
|---|---|---|---|
| A | 6470 | 31 | 0.479134% |
| B | 6470 | 346 | 5.347759% |
| C | 6470 | 117 | 1.808346% |
| D | 6470 | 855 | 13.214838% |
Noise dominated data is calculated using 1-second bins in cleaned event files. If a bin has >2000 counts, and if more than 50% of those come from <1% of pixels, then it is considered to be noise-dominated and hence unusable.
| Quadrant | # 1 sec bins | Bins with >0 counts | Bins with >2000 counts | High rate bins dominated by noise | Noise dominated (total time) | Noise dominated (detector-on time) | Marked lightcurve |
|---|---|---|---|---|---|---|---|
| A | 7645 | 6470 | 0 | 0 | 0.00% | 0.00% | 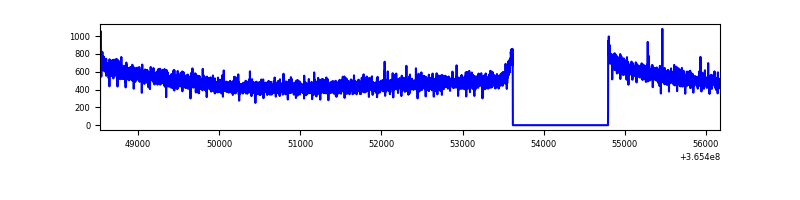 |
| B | 7645 | 6470 | 195 | 195 | 2.55% | 3.01% | 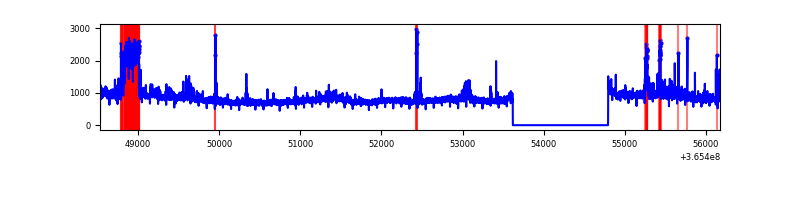 |
| C | 7645 | 6470 | 30 | 30 | 0.39% | 0.46% | 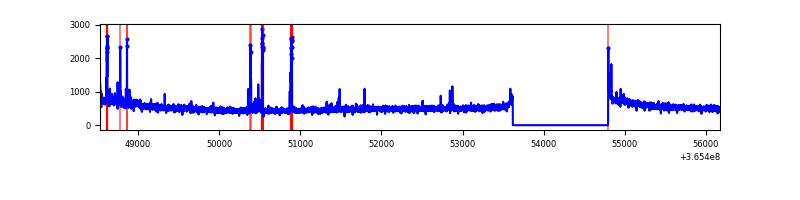 |
| D | 7645 | 6470 | 765 | 765 | 10.01% | 11.82% | 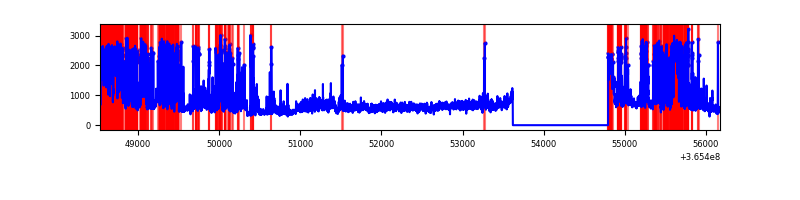 |
Top three noisy pixels from each quadrant. If the there are fewer than three noisy pixels in the level2.evt file, extra rows are filled as -1
| Pixel properties | Quadrant properties | ||||||
|---|---|---|---|---|---|---|---|
| Quadrant | DetID | PixID | Counts | Sigma | Mean | Median | Sigma |
| A | 13 | 254 | 12166 | 68.96 | 830 | 814 | 164.6 |
| A | 3 | 137 | 7898 | 43.04 | 830 | 814 | 164.6 |
| A | 0 | 226 | 6922 | 37.11 | 830 | 814 | 164.6 |
| B | 6 | 159 | 1814790 | 12217.31 | 800 | 782 | 148.5 |
| B | 5 | 172 | 393326 | 2643.78 | 800 | 782 | 148.5 |
| B | 4 | 80 | 193663 | 1299.05 | 800 | 782 | 148.5 |
| C | 14 | 238 | 130935 | 716.71 | 786 | 791 | 181.6 |
| C | 15 | 208 | 75108 | 409.27 | 786 | 791 | 181.6 |
| C | 4 | 175 | 64552 | 351.14 | 786 | 791 | 181.6 |
| D | 12 | 218 | 1520204 | 8846.52 | 732 | 714 | 171.8 |
| D | 8 | 195 | 777702 | 4523.65 | 732 | 714 | 171.8 |
| D | 12 | 233 | 628308 | 3653.87 | 732 | 714 | 171.8 |
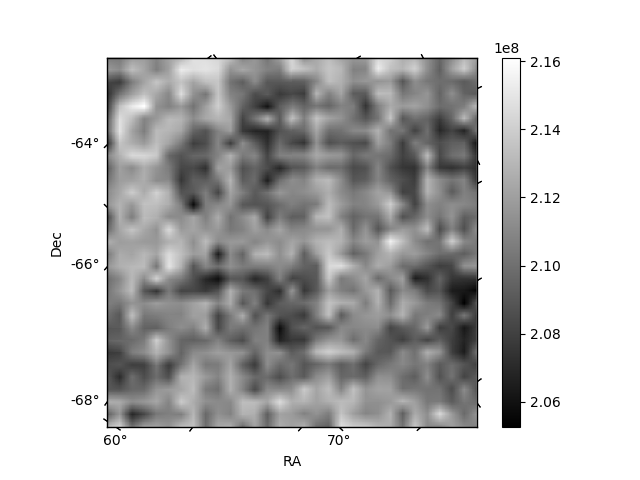
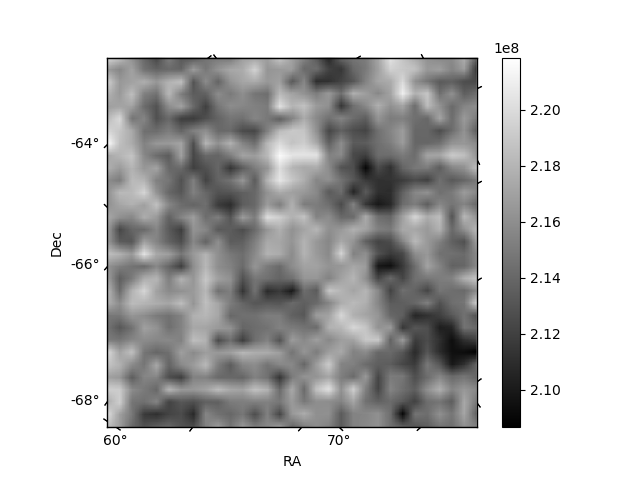
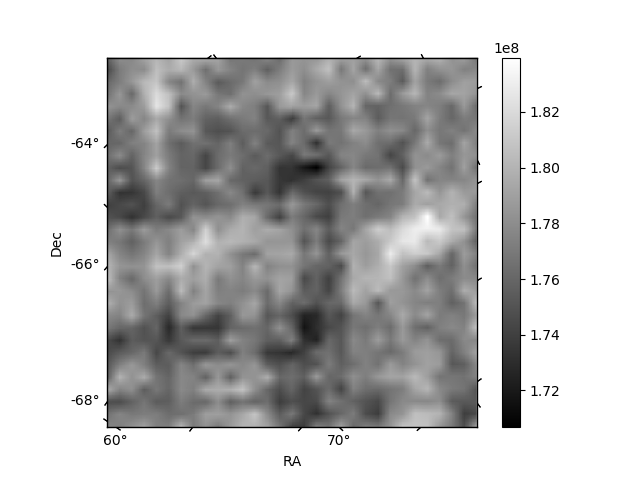
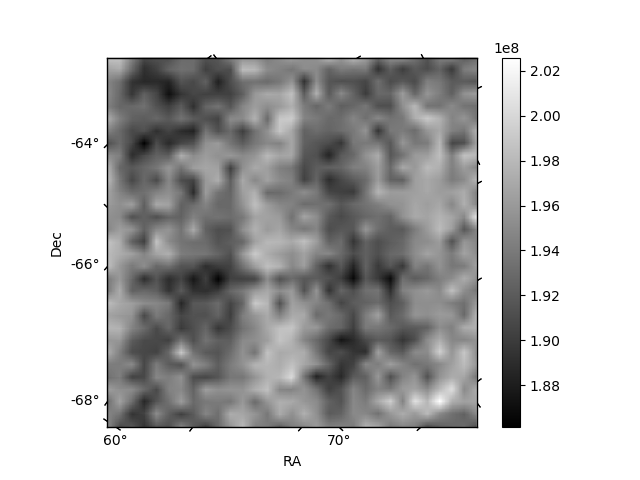
Histogram calculated using DETX and DETY for each event in the final _common_clean file
| Quadrant A | 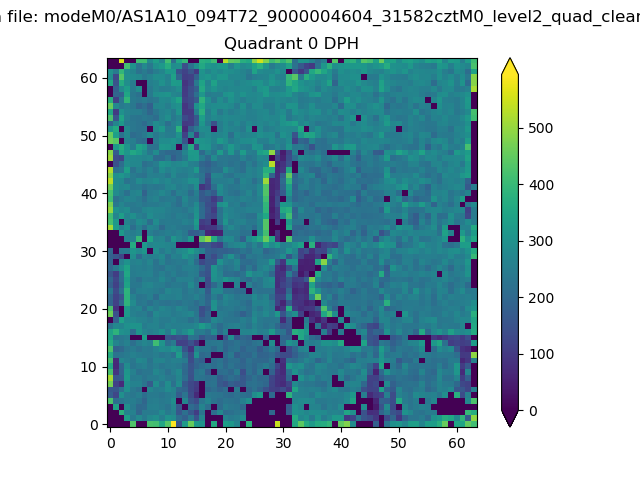 |
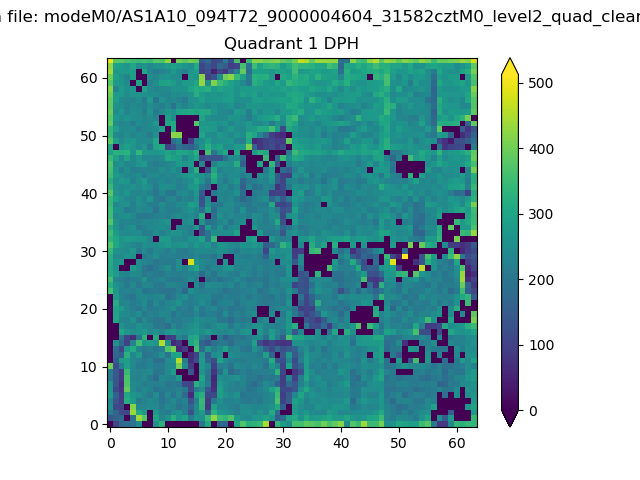 |
Quadrant B |
|---|---|---|---|
| Quadrant D | 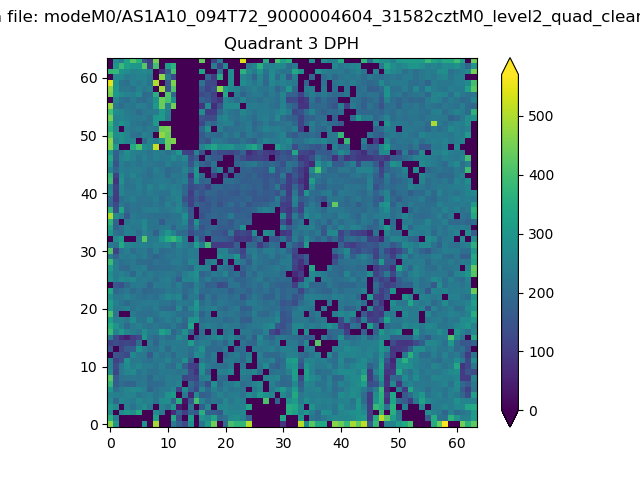 |
 |
Quadrant C |
| Plot type | Count rate plots | Images |
|---|---|---|
| Comparison with Poisson distribution Blue bars denote a histogram of data divided into 1 sec bins. Red curve is a Poisson curve with rate = median count rate of data. |
 |
 |
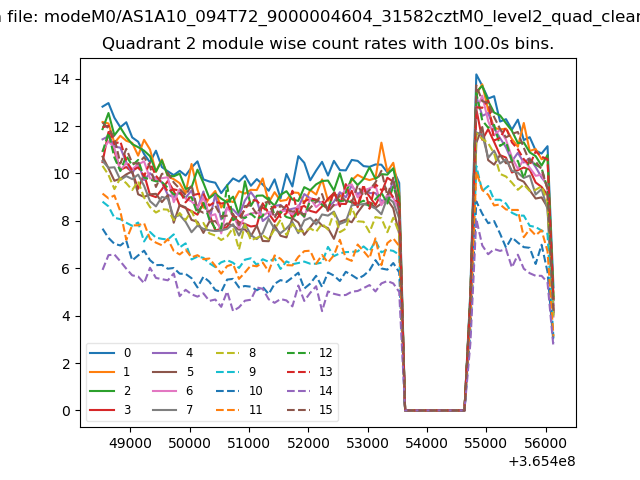
| Quadrant-wise count rates Data is divided into 100 sec bins |
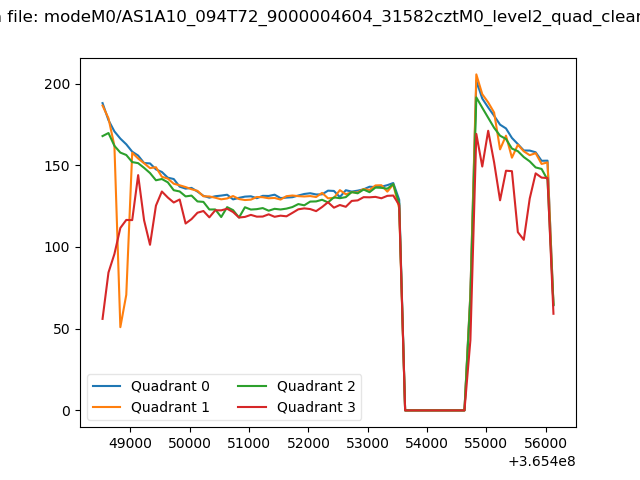 |
|
| Module-wise count rates for Quadrant A Data is divided into 100 sec bins |
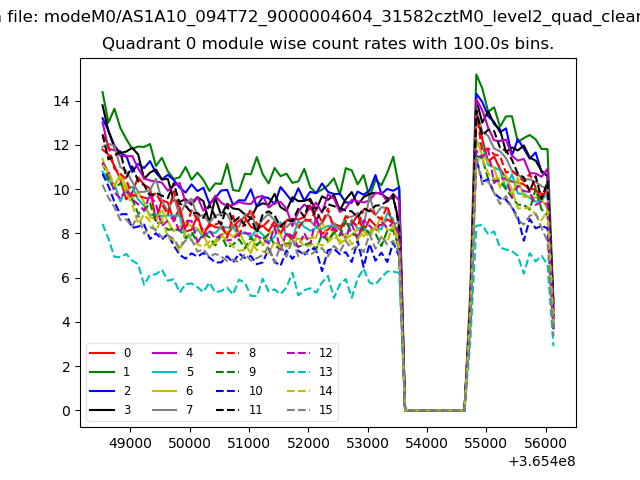 |
 |
| Module-wise count rates for Quadrant B Data is divided into 100 sec bins |
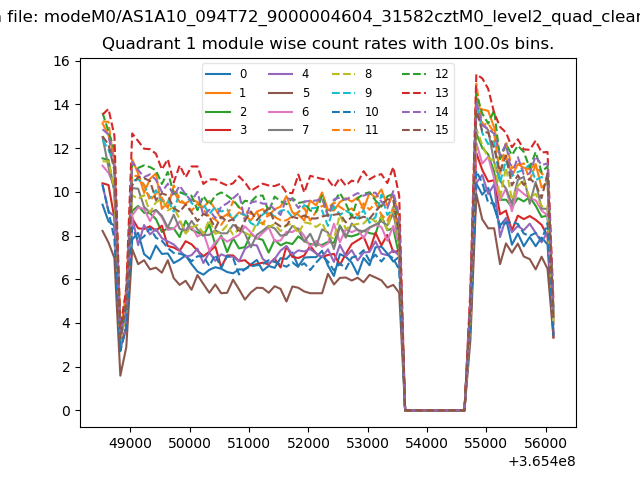 |
 |
| Module-wise count rates for Quadrant C Data is divided into 100 sec bins |
 |
 |
| Module-wise count rates for Quadrant D Data is divided into 100 sec bins |
 |
 |
| Parameter | Plot |
|---|---|
| CZT HV Monitor | 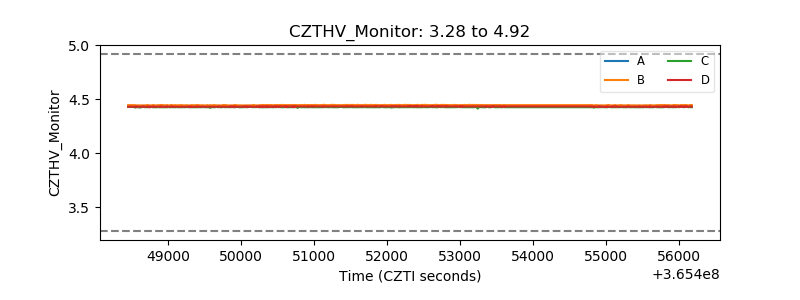 |
| D_VDD | 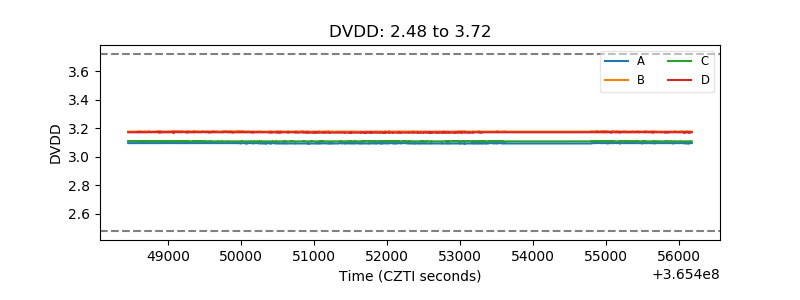 |
| Temperature 1 | 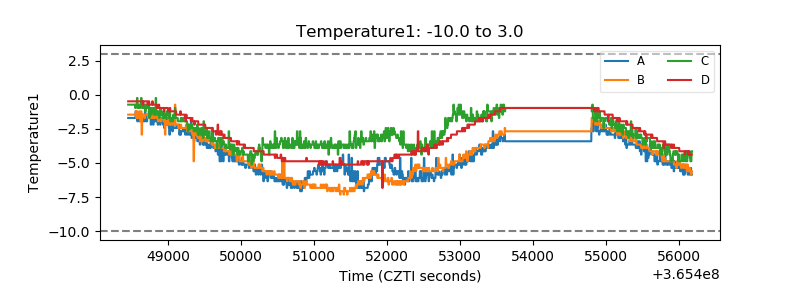 |
| Veto HV Monitor |  |
| Veto LLD | 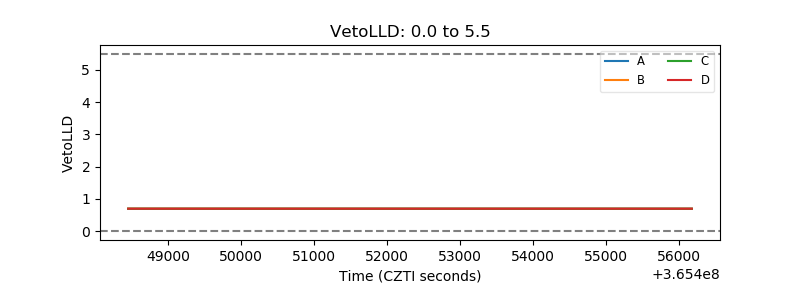 |
| Alpha Counter | 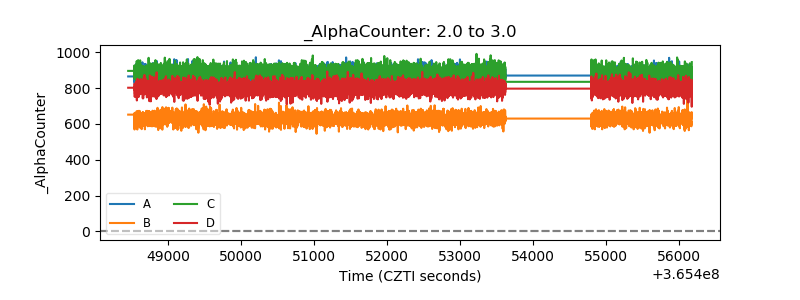 |
| _CPM_Rate | 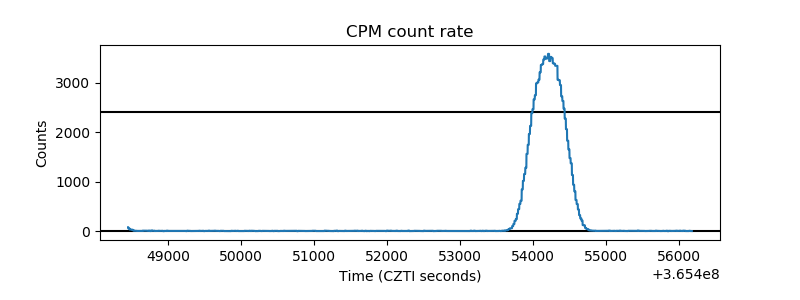 |
| CZT Counter | 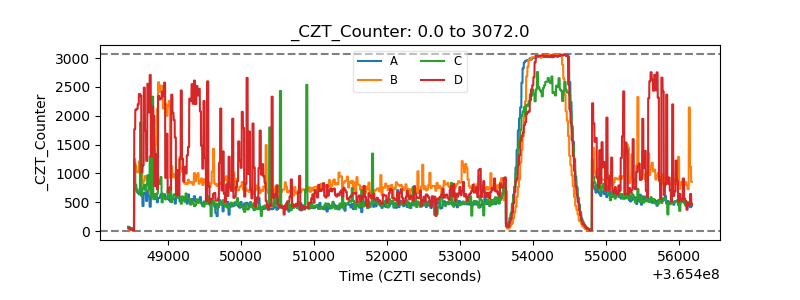 |
| +2.5 Volts monitor |  |
| +5 Volts monitor |  |
| _ROLL_ROT |  |
| _Roll_DEC |  |
| _Roll_RA | 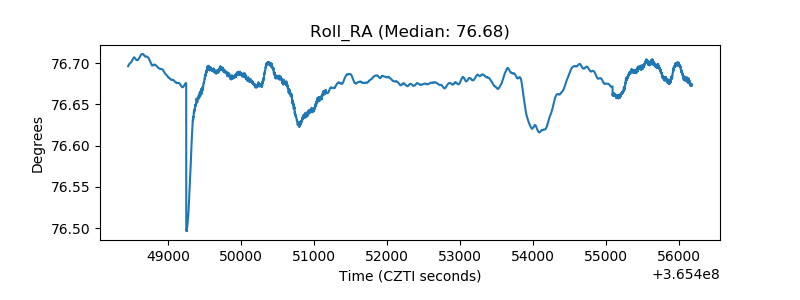 |
| Veto Counter |  |