| Param | Original file | Final file |
|---|---|---|
| Filename | modeM0/AS1A10_094T72_9000004604_31583cztM0_level2.evt | modeM0/AS1A10_094T72_9000004604_31583cztM0_level2_quad_clean.evt |
| Size (bytes) | 202,924,800 | 45,123,840 |
| Size | 193.5 MB | 43.0 MB |
| Events in quadrant A | 1,049,963 | 322,069 |
| Events in quadrant B | 1,876,805 | 318,729 |
| Events in quadrant C | 1,091,402 | 307,547 |
| Events in quadrant D | 1,990,952 | 273,665 |
| Mode M9 | |||
|---|---|---|---|
| Quadrant | BADHDUFLAG | Total packets | Discarded packets |
| A | 0 | 6 | 0 |
| B | 0 | 7 | 0 |
| C | 0 | 7 | 0 |
| D | 0 | 7 | 0 |
| Mode M0 | |||
|---|---|---|---|
| Quadrant | BADHDUFLAG | Total packets | Discarded packets |
| A | 0 | 4421 | 1 |
| B | 0 | 6921 | 1 |
| C | 0 | 4509 | 1 |
| D | 0 | 7240 | 1 |
| Mode SS | |||
|---|---|---|---|
| Quadrant | BADHDUFLAG | Total packets | Discarded packets |
| A | 0 | 40 | 0 |
| B | 0 | 40 | 0 |
| C | 0 | 40 | 0 |
| D | 0 | 40 | 0 |
| Quadrant | Total seconds | Saturated seconds | Saturation percentage |
|---|---|---|---|
| A | 1981 | 7 | 0.353357% |
| B | 1981 | 81 | 4.088844% |
| C | 1981 | 27 | 1.362948% |
| D | 1981 | 315 | 15.901060% |
Noise dominated data is calculated using 1-second bins in cleaned event files. If a bin has >2000 counts, and if more than 50% of those come from <1% of pixels, then it is considered to be noise-dominated and hence unusable.
| Quadrant | # 1 sec bins | Bins with >0 counts | Bins with >2000 counts | High rate bins dominated by noise | Noise dominated (total time) | Noise dominated (detector-on time) | Marked lightcurve |
|---|---|---|---|---|---|---|---|
| A | 1981 | 1981 | 0 | 0 | 0.00% | 0.00% |  |
| B | 1981 | 1981 | 26 | 26 | 1.31% | 1.31% |  |
| C | 1981 | 1981 | 1 | 1 | 0.05% | 0.05% |  |
| D | 1981 | 1981 | 295 | 295 | 14.89% | 14.89% |  |
Top three noisy pixels from each quadrant. If the there are fewer than three noisy pixels in the level2.evt file, extra rows are filled as -1
| Pixel properties | Quadrant properties | ||||||
|---|---|---|---|---|---|---|---|
| Quadrant | DetID | PixID | Counts | Sigma | Mean | Median | Sigma |
| A | 13 | 254 | 4150 | 71.0 | 272 | 268 | 54.7 |
| A | 3 | 137 | 2485 | 40.55 | 272 | 268 | 54.7 |
| A | 0 | 226 | 2337 | 37.84 | 272 | 268 | 54.7 |
| B | 6 | 159 | 564044 | 10958.84 | 268 | 263 | 51.4 |
| B | 4 | 80 | 198558 | 3854.48 | 268 | 263 | 51.4 |
| B | 12 | 1 | 18022 | 345.2 | 268 | 263 | 51.4 |
| C | 14 | 238 | 43502 | 737.48 | 251 | 253 | 58.6 |
| C | 4 | 175 | 27885 | 471.18 | 251 | 253 | 58.6 |
| C | 3 | 233 | 17538 | 294.74 | 251 | 253 | 58.6 |
| D | 12 | 233 | 476824 | 8431.03 | 235 | 228 | 56.5 |
| D | 12 | 218 | 335074 | 5923.46 | 235 | 228 | 56.5 |
| D | 8 | 195 | 157028 | 2773.8 | 235 | 228 | 56.5 |
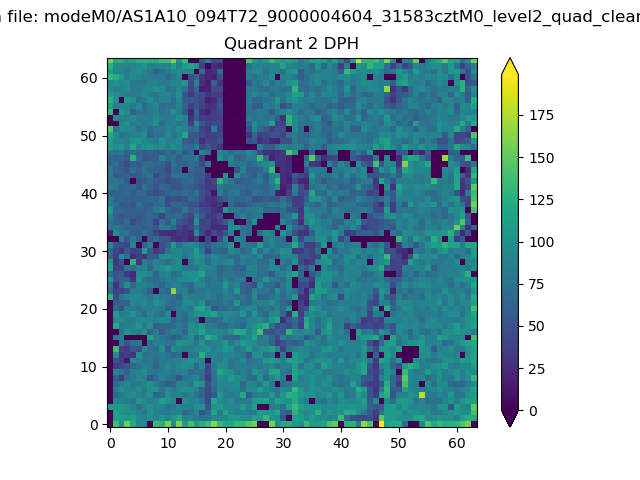
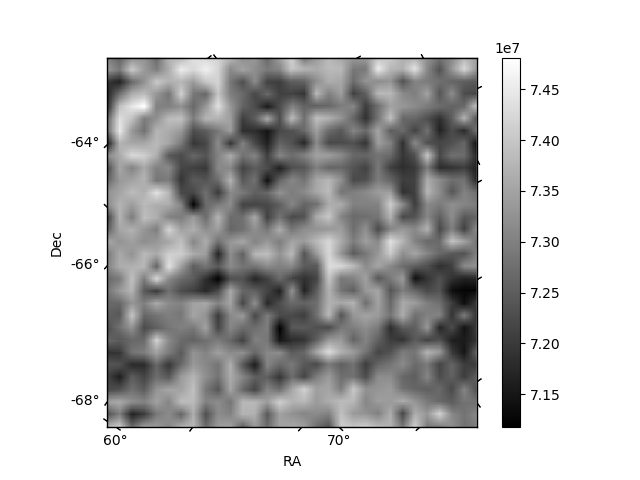
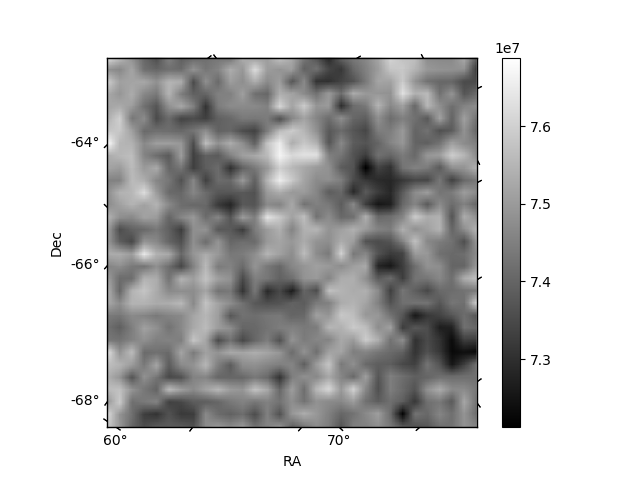
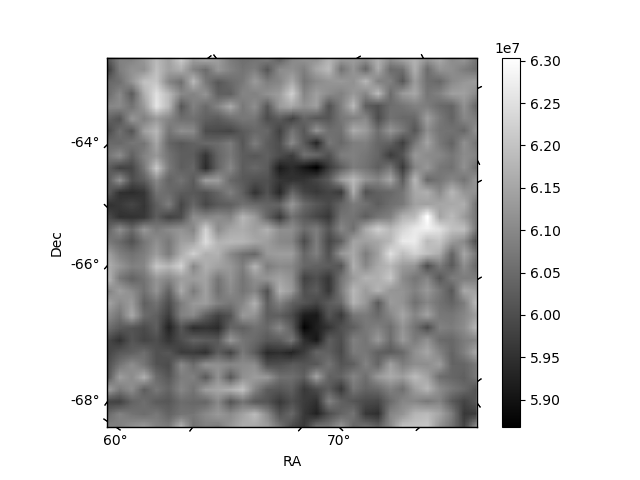
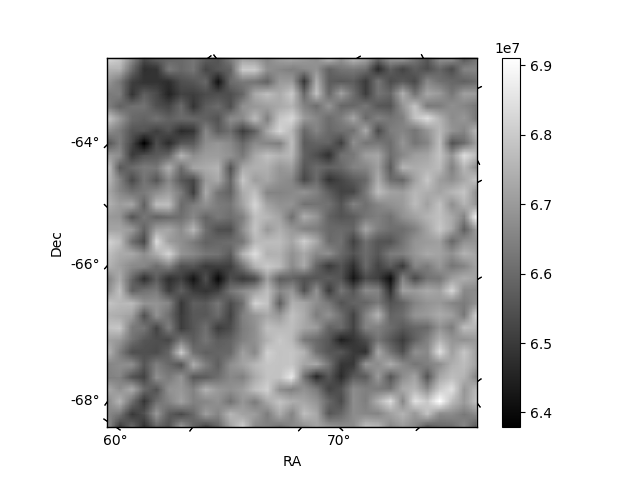
Histogram calculated using DETX and DETY for each event in the final _common_clean file
| Quadrant A | 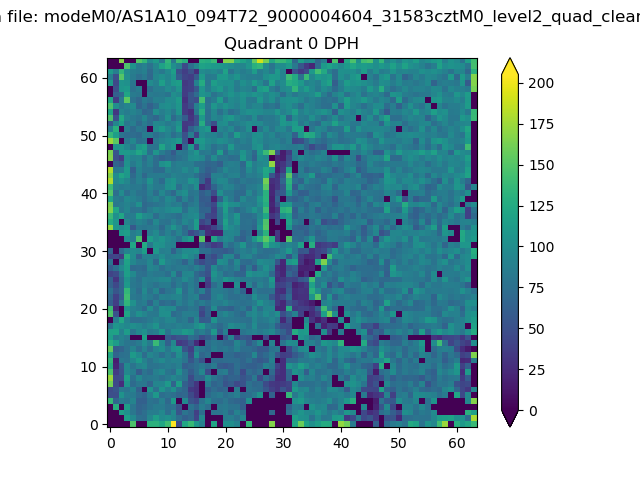 |
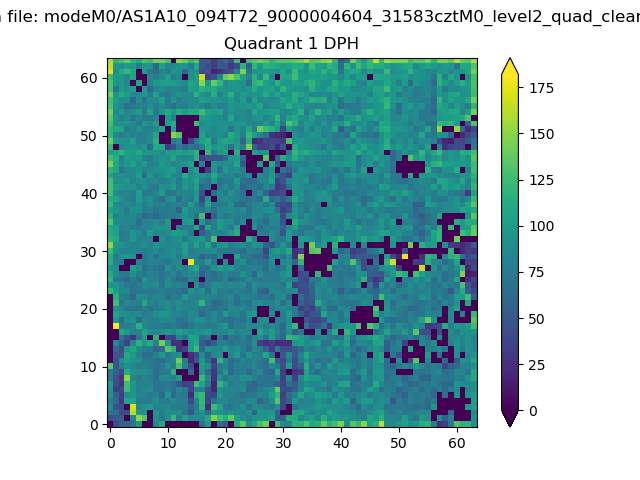 |
Quadrant B |
|---|---|---|---|
| Quadrant D | 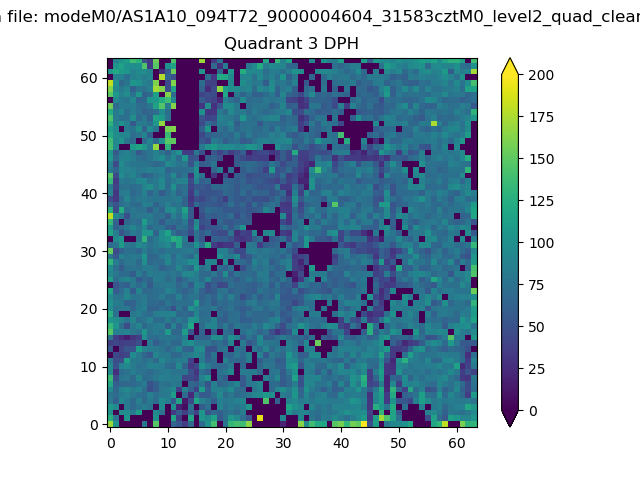 |
 |
Quadrant C |
| Plot type | Count rate plots | Images |
|---|---|---|
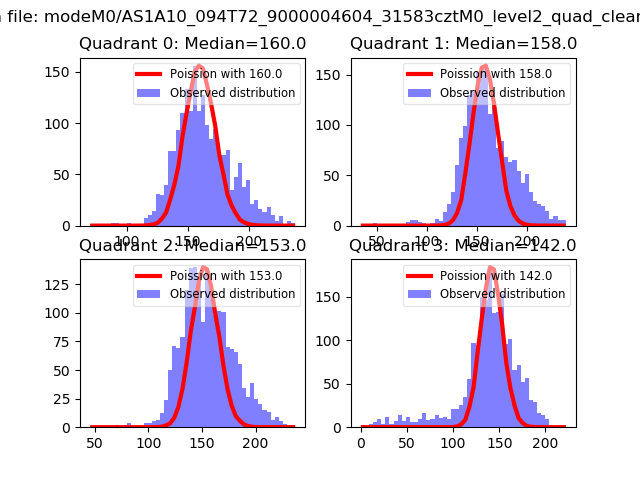
| Comparison with Poisson distribution Blue bars denote a histogram of data divided into 1 sec bins. Red curve is a Poisson curve with rate = median count rate of data. |
 |
 |
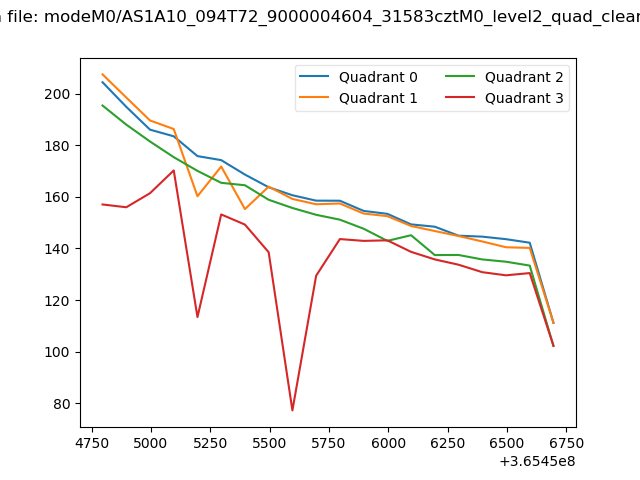
| Quadrant-wise count rates Data is divided into 100 sec bins |
 |
|
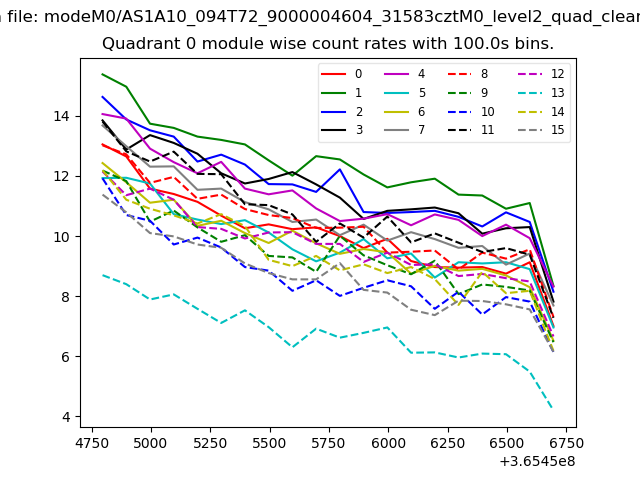
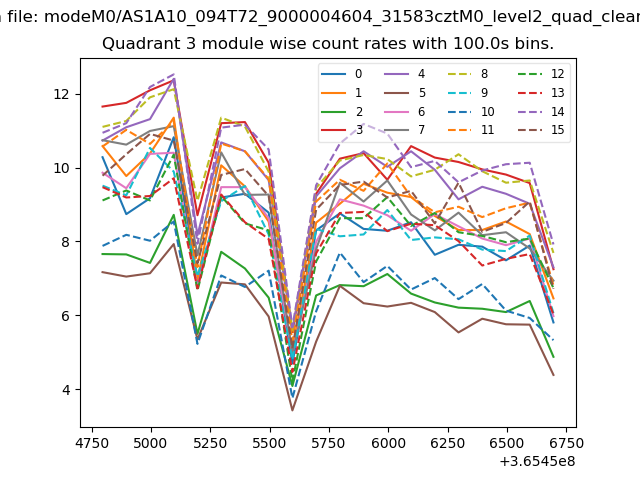
| Module-wise count rates for Quadrant A Data is divided into 100 sec bins |
 |
 |
| Module-wise count rates for Quadrant B Data is divided into 100 sec bins |
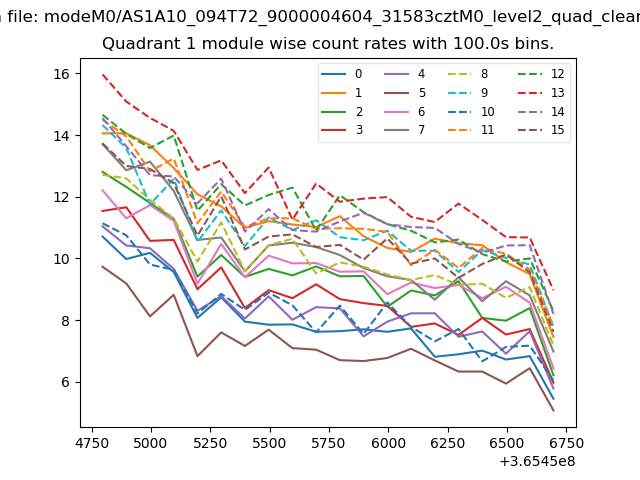 |
 |
| Module-wise count rates for Quadrant C Data is divided into 100 sec bins |
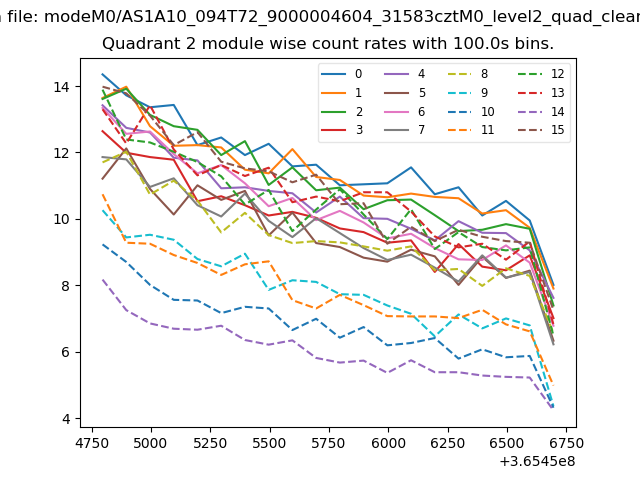 |
 |
| Module-wise count rates for Quadrant D Data is divided into 100 sec bins |
 |
 |
| Parameter | Plot |
|---|---|
| CZT HV Monitor | 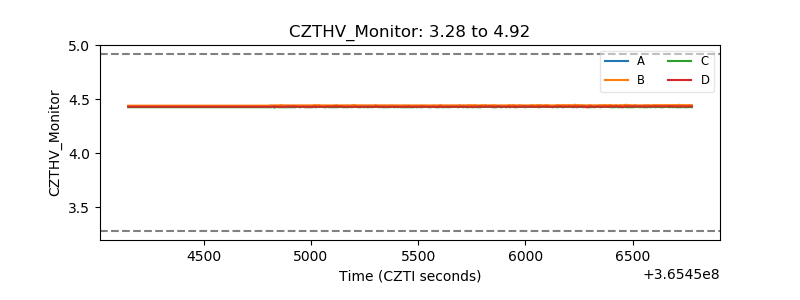 |
| D_VDD | 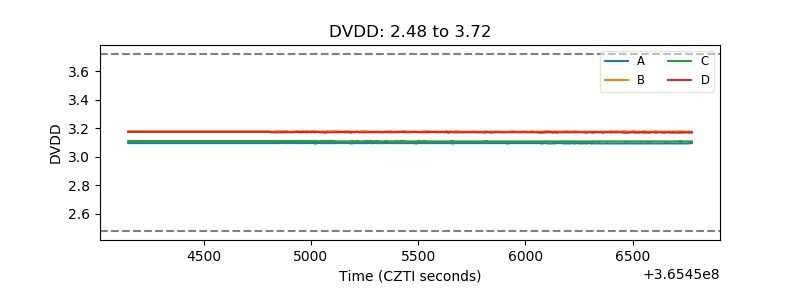 |
| Temperature 1 | 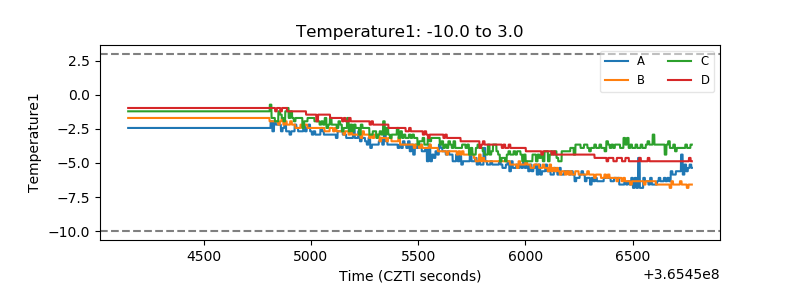 |
| Veto HV Monitor | 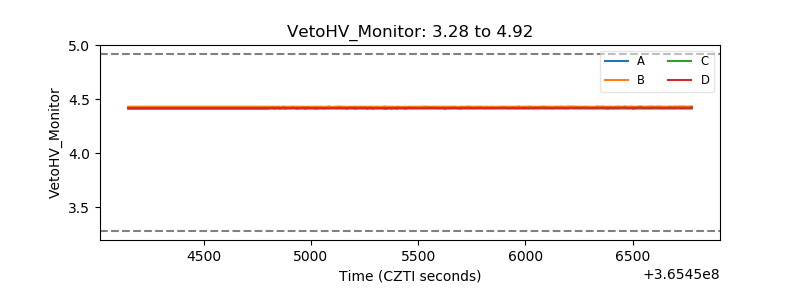 |
| Veto LLD | 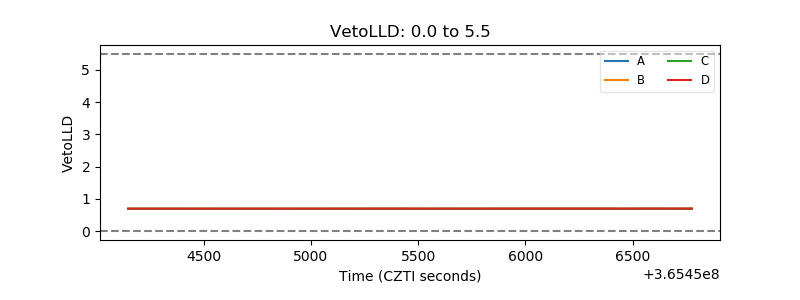 |
| Alpha Counter | 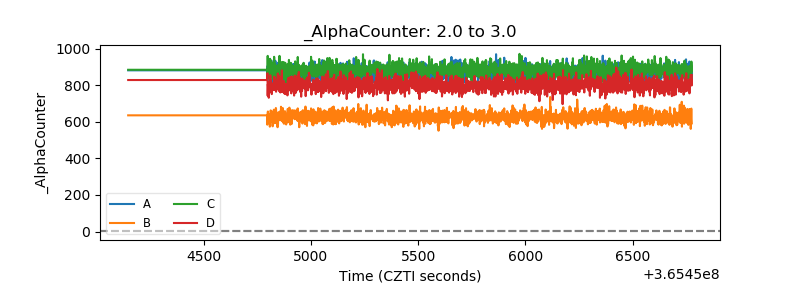 |
| _CPM_Rate | 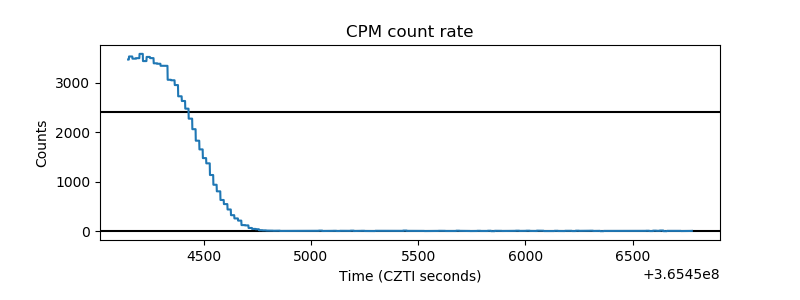 |
| CZT Counter | 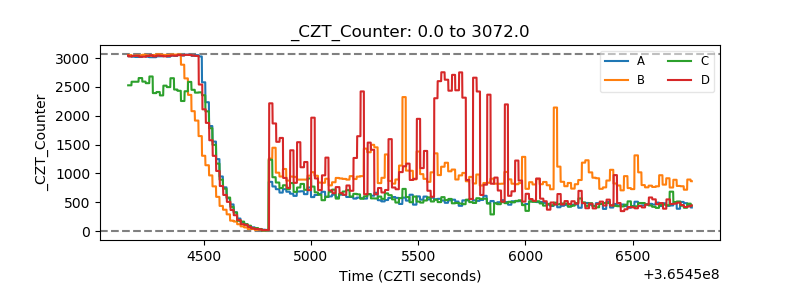 |
| +2.5 Volts monitor |  |
| +5 Volts monitor |  |
| _ROLL_ROT | 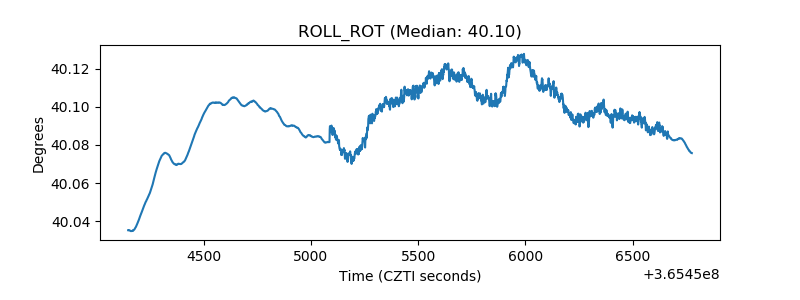 |
| _Roll_DEC | 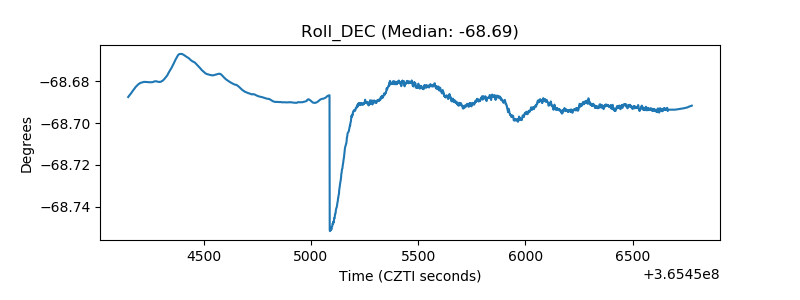 |
| _Roll_RA | 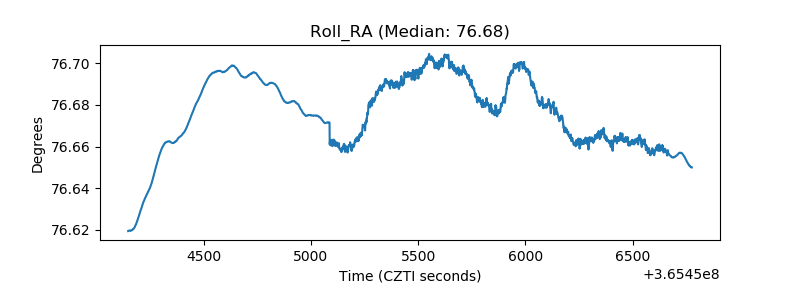 |
| Veto Counter | 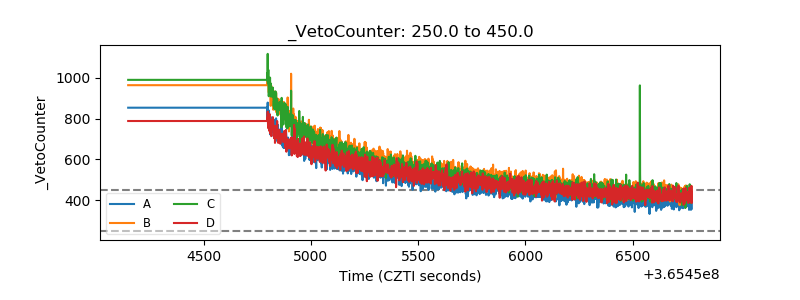 |