| Param | Original file | Final file |
|---|---|---|
| Filename | modeM0/AS1A10_094T73_9000004606cztM0_level2.fits | modeM0/AS1A10_094T73_9000004606cztM0_level2_quad_clean.evt |
| Size (bytes) | 84,251,520 | 60,937,920 |
| Size | 80.3 MB | 58.1 MB |
| Events in quadrant A | 545,268 | 347,246 |
| Events in quadrant B | 503,570 | 337,474 |
| Events in quadrant C | 524,010 | 326,905 |
| Events in quadrant D | 441,608 | 295,574 |
| Mode M9 | |||
|---|---|---|---|
| Quadrant | BADHDUFLAG | Total packets | Discarded packets |
| A | 0 | 21 | 0 |
| B | 0 | 21 | 0 |
| C | 0 | 21 | 0 |
| D | 0 | 21 | 0 |
| Mode M0 | |||
|---|---|---|---|
| Quadrant | BADHDUFLAG | Total packets | Discarded packets |
| A | 0 | 16437 | 0 |
| B | 0 | 24693 | 0 |
| C | 0 | 18102 | 0 |
| D | 0 | 26155 | 0 |
| Mode SS | |||
|---|---|---|---|
| Quadrant | BADHDUFLAG | Total packets | Discarded packets |
| A | 0 | 160 | 0 |
| B | 0 | 158 | 0 |
| C | 0 | 160 | 0 |
| D | 0 | 160 | 0 |
| Quadrant | Total seconds | Saturated seconds | Saturation percentage |
|---|---|---|---|
| A | 7744 | 40 | 0.516529% |
| B | 7683 | 216 | 2.811402% |
| C | 7739 | 131 | 1.692725% |
| D | 7689 | 368 | 4.786058% |
Noise dominated data is calculated using 1-second bins in cleaned event files. If a bin has >2000 counts, and if more than 50% of those come from <1% of pixels, then it is considered to be noise-dominated and hence unusable.
| Quadrant | # 1 sec bins | Bins with >0 counts | Bins with >2000 counts | High rate bins dominated by noise | Noise dominated (total time) | Noise dominated (detector-on time) | Marked lightcurve |
|---|---|---|---|---|---|---|---|
| A | 11011 | 7809 | 0 | 0 | 0.00% | 0.00% |  |
| B | 10998 | 7753 | 0 | 0 | 0.00% | 0.00% | 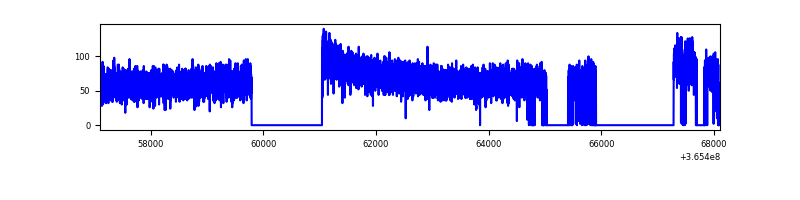 |
| C | 11012 | 7797 | 0 | 0 | 0.00% | 0.00% | 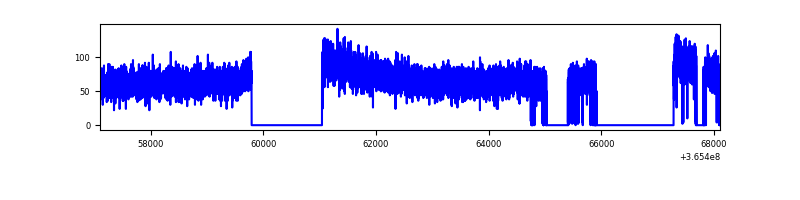 |
| D | 11011 | 7749 | 0 | 0 | 0.00% | 0.00% | 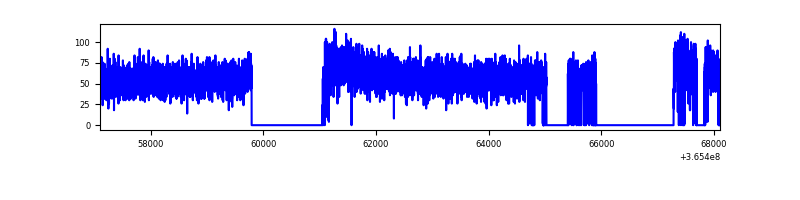 |
Top three noisy pixels from each quadrant. If the there are fewer than three noisy pixels in the level2.evt file, extra rows are filled as -1
| Pixel properties | Quadrant properties | ||||||
|---|---|---|---|---|---|---|---|
| Quadrant | DetID | PixID | Counts | Sigma | Mean | Median | Sigma |
| A | 0 | 29 | 491 | 9.76 | 142 | 136 | 36.4 |
| A | 7 | 110 | 433 | 8.17 | 142 | 136 | 36.4 |
| A | 9 | 19 | 420 | 7.81 | 142 | 136 | 36.4 |
| B | 2 | 9 | 379 | 8.93 | 133 | 129 | 28.0 |
| B | 3 | 80 | 362 | 8.32 | 133 | 129 | 28.0 |
| B | 5 | 128 | 353 | 8.0 | 133 | 129 | 28.0 |
| C | 1 | 81 | 418 | 7.9 | 138 | 132 | 36.2 |
| C | 1 | 80 | 409 | 7.65 | 138 | 132 | 36.2 |
| C | 3 | 203 | 407 | 7.59 | 138 | 132 | 36.2 |
| D | 15 | 47 | 342 | 6.54 | 126 | 116 | 34.5 |
| D | 15 | 63 | 333 | 6.28 | 126 | 116 | 34.5 |
| D | 7 | 3 | 333 | 6.28 | 126 | 116 | 34.5 |
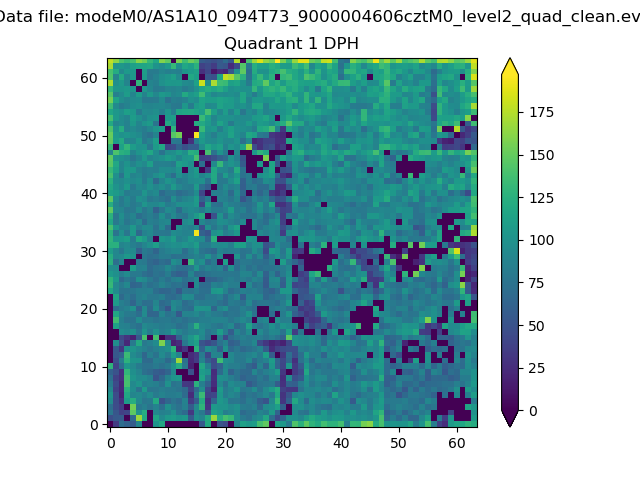
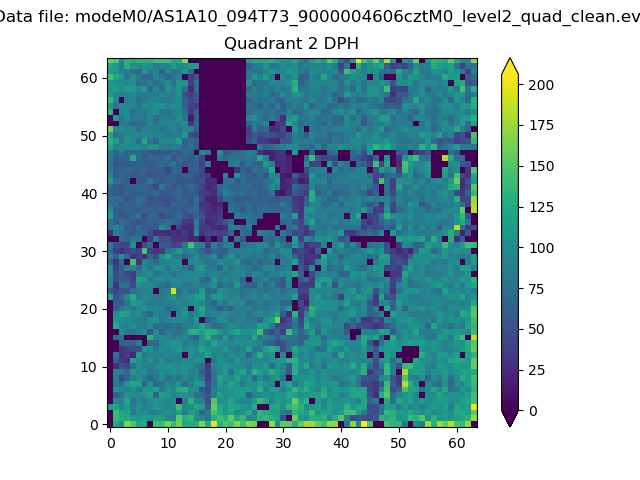
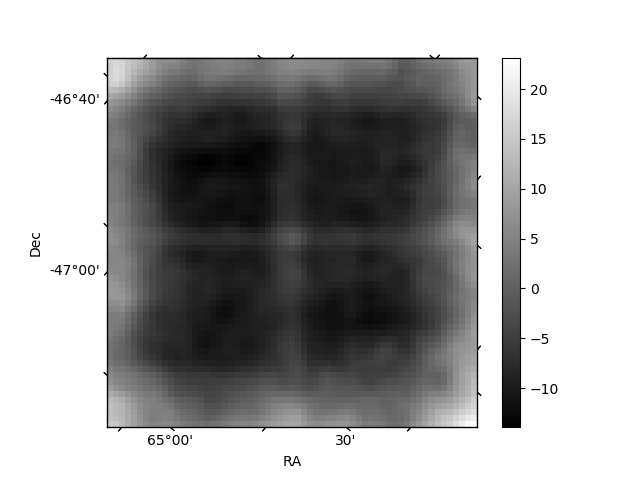
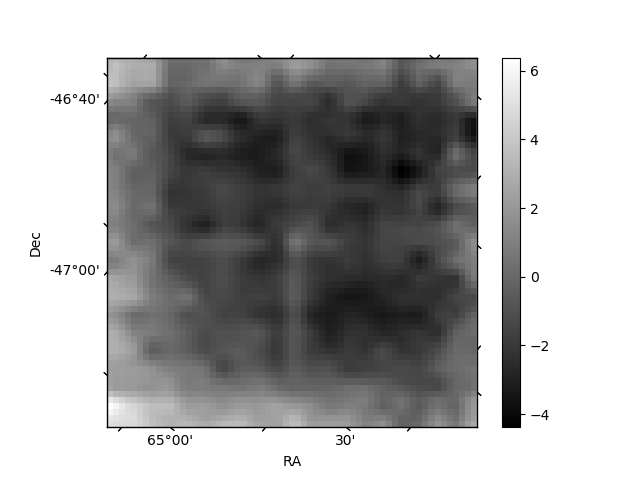
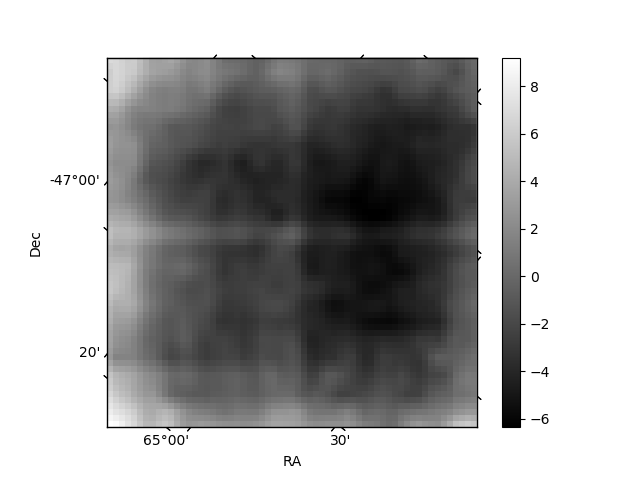
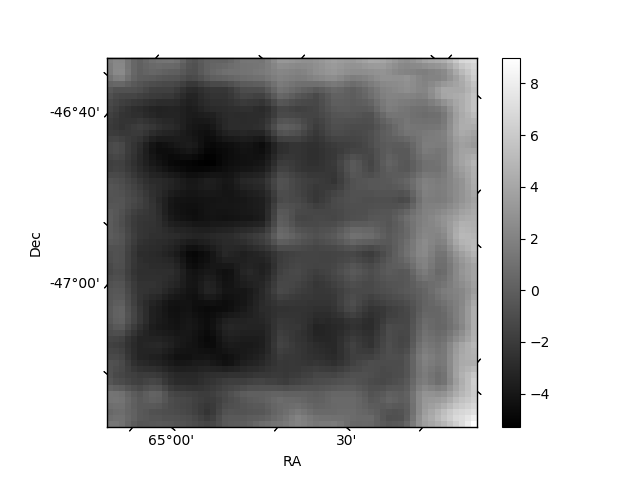
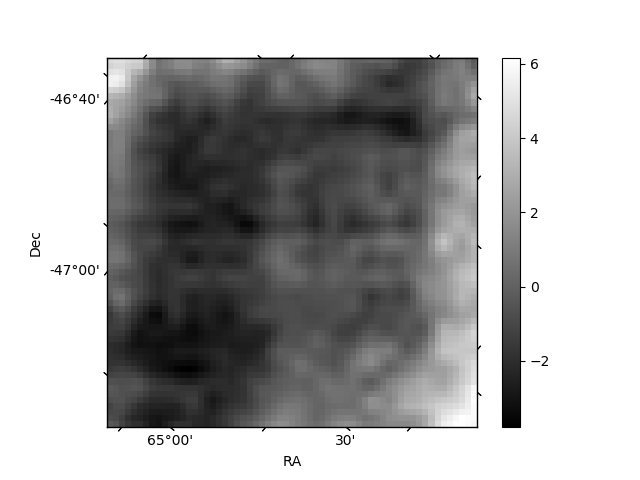
Histogram calculated using DETX and DETY for each event in the final _common_clean file
| Quadrant A | 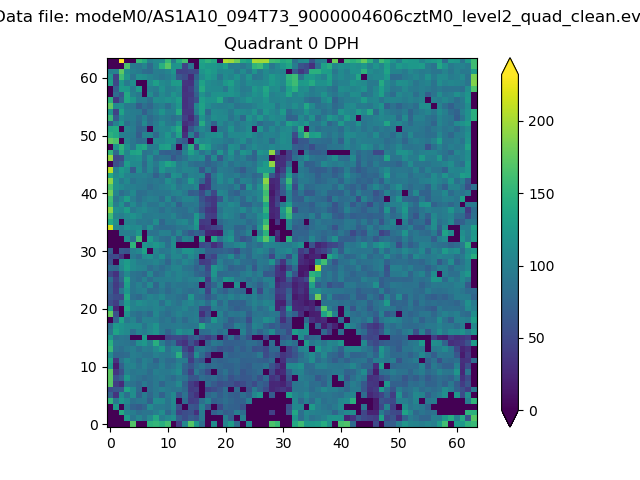 |
 |
Quadrant B |
|---|---|---|---|
| Quadrant D | 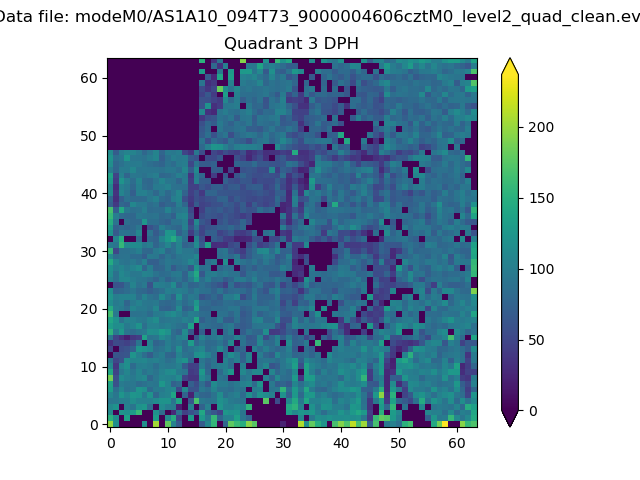 |
 |
Quadrant C |
| Plot type | Count rate plots | Images |
|---|---|---|
| Comparison with Poisson distribution Blue bars denote a histogram of data divided into 1 sec bins. Red curve is a Poisson curve with rate = median count rate of data. |
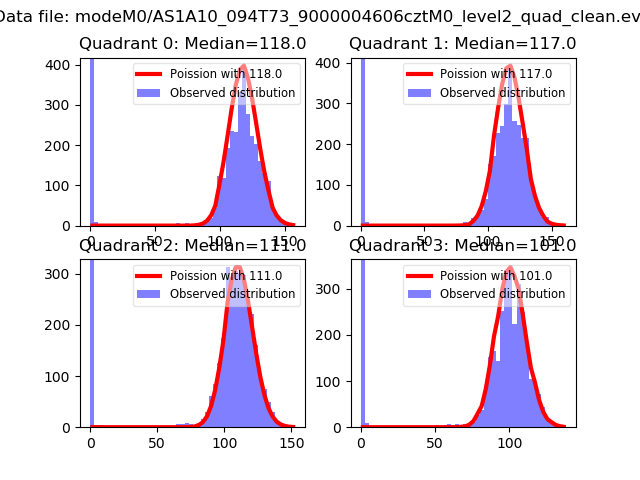 |
 |
| Quadrant-wise count rates Data is divided into 100 sec bins |
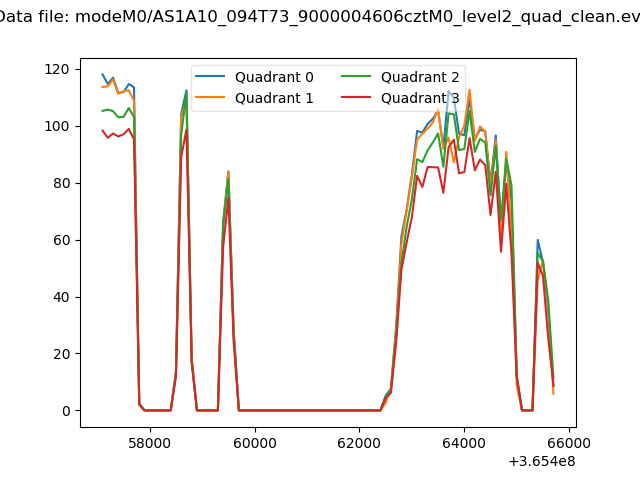 |
|
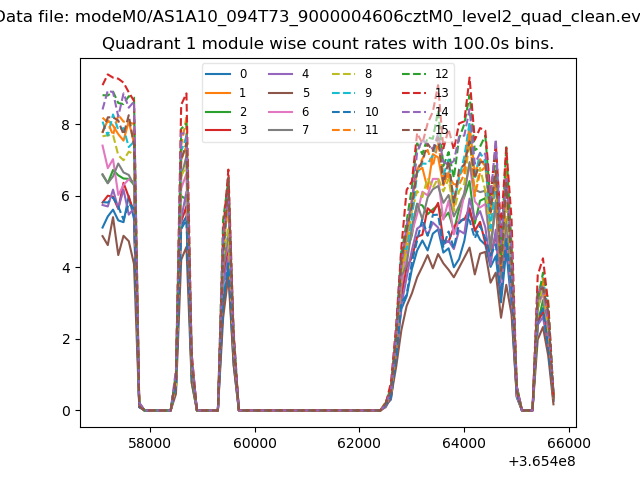
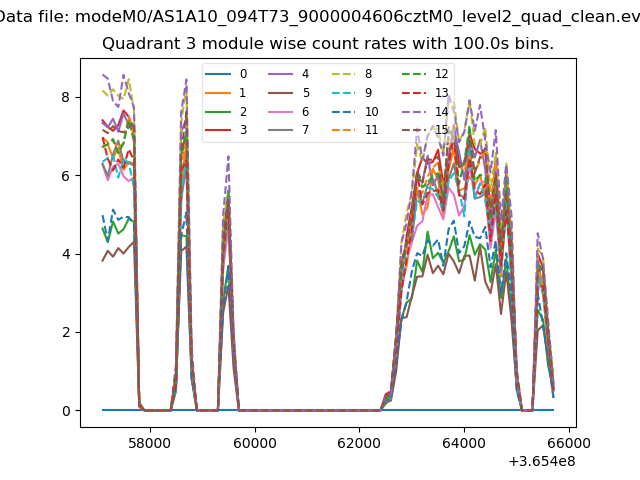
| Module-wise count rates for Quadrant A Data is divided into 100 sec bins |
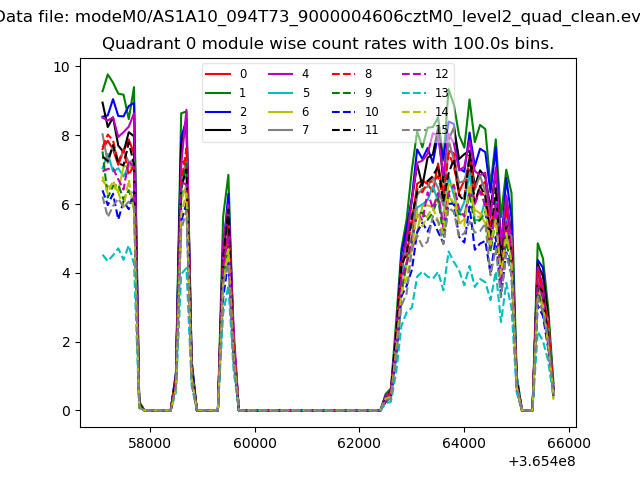 |
 |
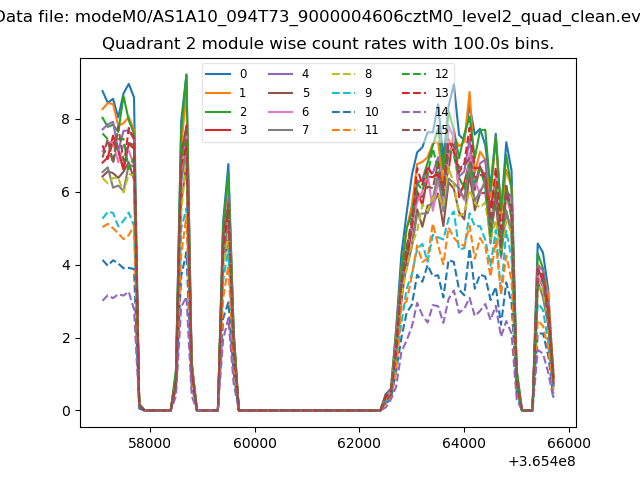
| Module-wise count rates for Quadrant B Data is divided into 100 sec bins |
 |
 |
| Module-wise count rates for Quadrant C Data is divided into 100 sec bins |
 |
 |
| Module-wise count rates for Quadrant D Data is divided into 100 sec bins |
 |
 |
| Parameter | Plot |
|---|---|
| CZT HV Monitor |  |
| D_VDD | 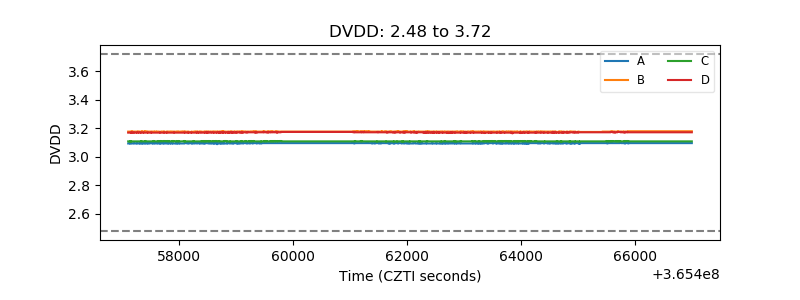 |
| Temperature 1 | 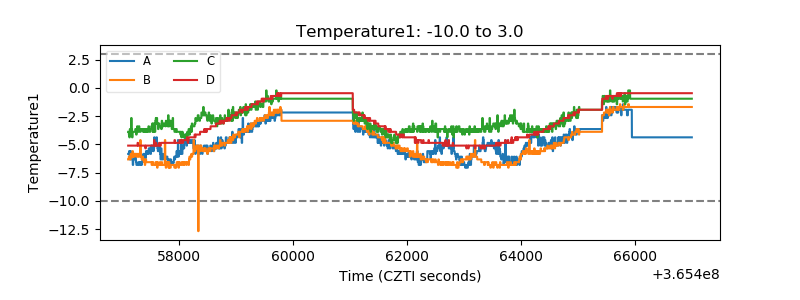 |
| Veto HV Monitor | 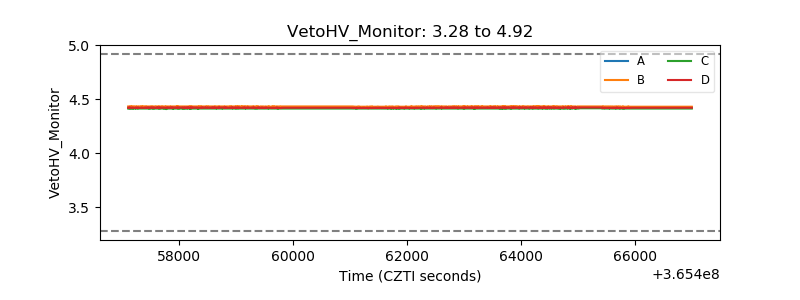 |
| Veto LLD | 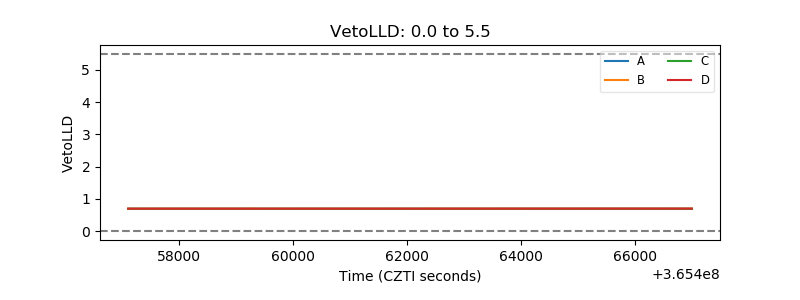 |
| Alpha Counter | 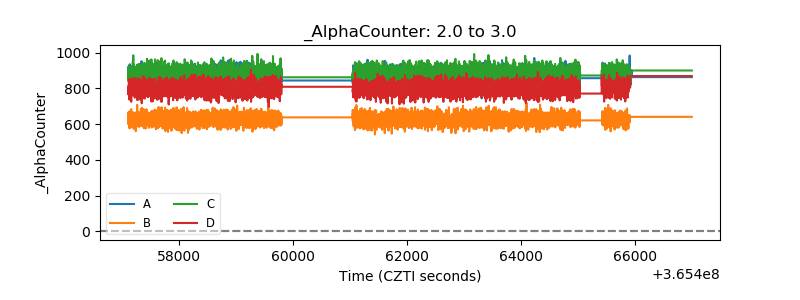 |
| _CPM_Rate | 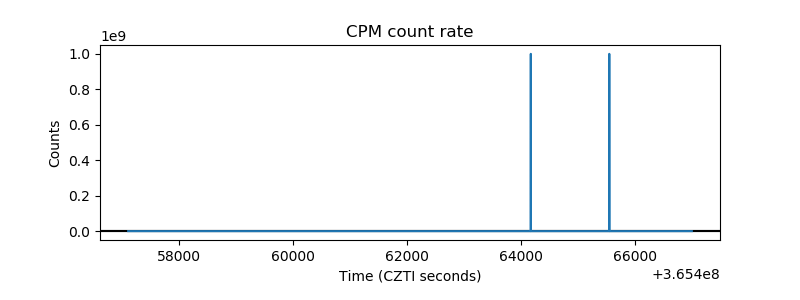 |
| CZT Counter | 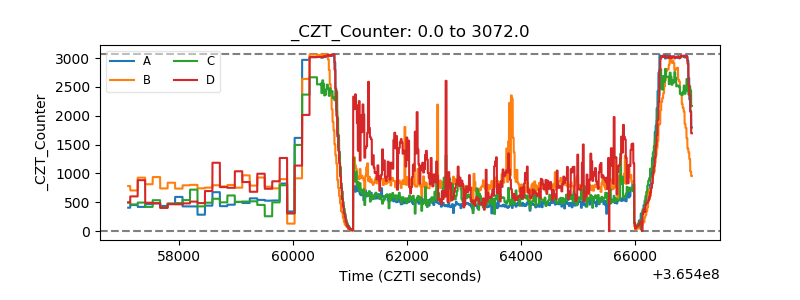 |
| +2.5 Volts monitor | 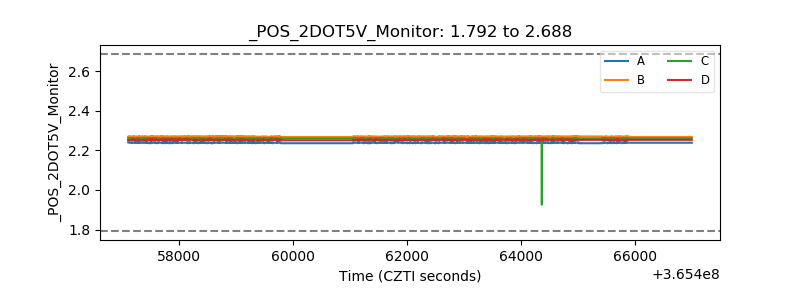 |
| +5 Volts monitor | 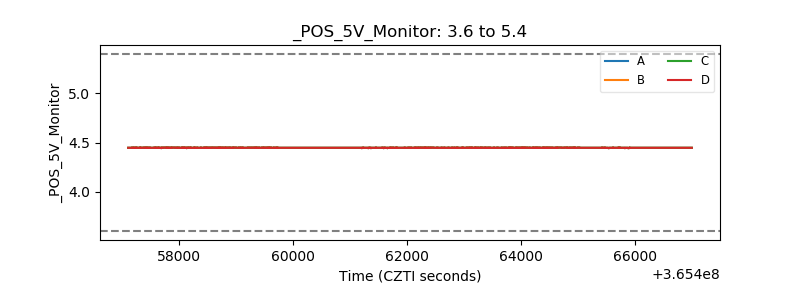 |
| _ROLL_ROT | 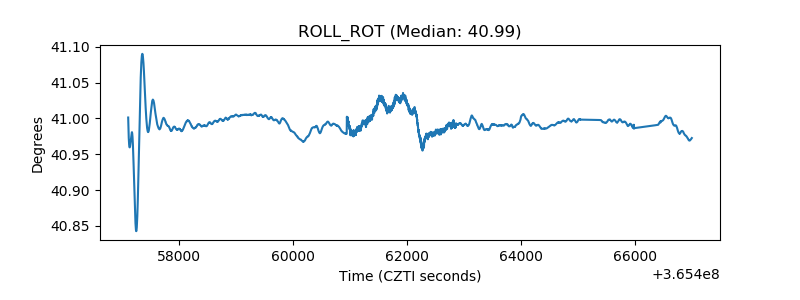 |
| _Roll_DEC | 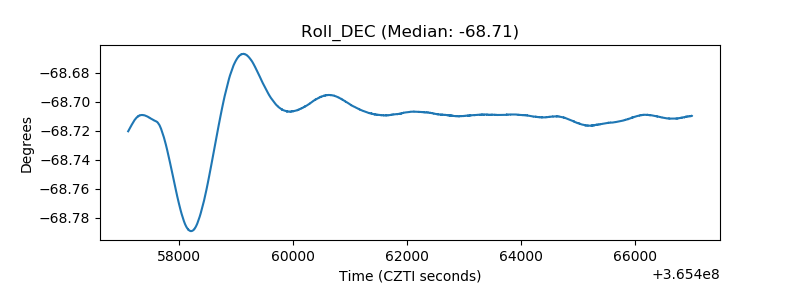 |
| _Roll_RA | 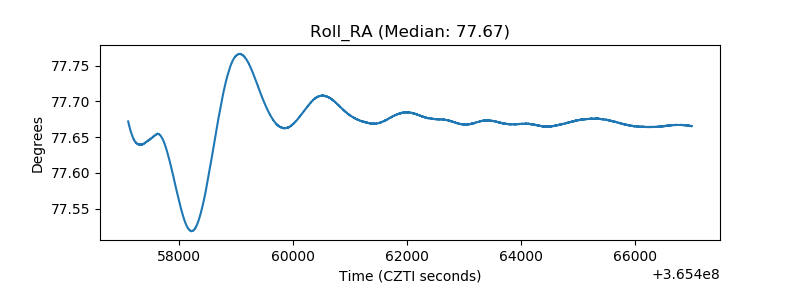 |
| Veto Counter | 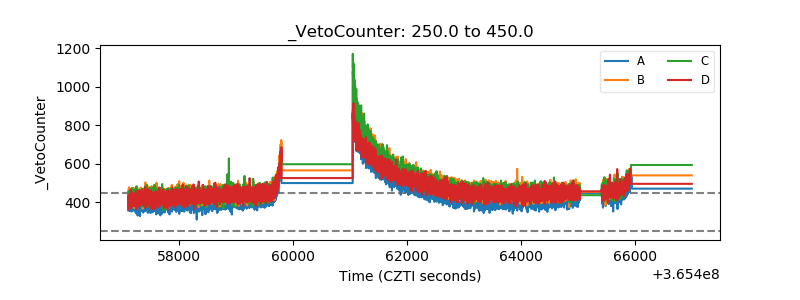 |