| Param | Original file | Final file |
|---|---|---|
| Filename | modeM0/AS1A10_094T73_9000004606_31583cztM0_level2.evt | modeM0/AS1A10_094T73_9000004606_31583cztM0_level2_quad_clean.evt |
| Size (bytes) | 380,980,800 | 87,284,160 |
| Size | 363.3 MB | 83.2 MB |
| Events in quadrant A | 2,043,991 | 610,370 |
| Events in quadrant B | 3,345,505 | 610,450 |
| Events in quadrant C | 2,168,022 | 591,048 |
| Events in quadrant D | 3,707,874 | 548,255 |
| Mode M9 | |||
|---|---|---|---|
| Quadrant | BADHDUFLAG | Total packets | Discarded packets |
| A | 0 | 12 | 0 |
| B | 0 | 12 | 0 |
| C | 0 | 12 | 0 |
| D | 0 | 12 | 0 |
| Mode M0 | |||
|---|---|---|---|
| Quadrant | BADHDUFLAG | Total packets | Discarded packets |
| A | 0 | 8584 | 1 |
| B | 0 | 12627 | 1 |
| C | 0 | 8870 | 1 |
| D | 0 | 13647 | 1 |
| Mode SS | |||
|---|---|---|---|
| Quadrant | BADHDUFLAG | Total packets | Discarded packets |
| A | 0 | 84 | 0 |
| B | 0 | 84 | 0 |
| C | 0 | 84 | 0 |
| D | 0 | 84 | 0 |
| Quadrant | Total seconds | Saturated seconds | Saturation percentage |
|---|---|---|---|
| A | 4010 | 35 | 0.872818% |
| B | 4010 | 102 | 2.543641% |
| C | 4010 | 77 | 1.920200% |
| D | 4010 | 218 | 5.436409% |
Noise dominated data is calculated using 1-second bins in cleaned event files. If a bin has >2000 counts, and if more than 50% of those come from <1% of pixels, then it is considered to be noise-dominated and hence unusable.
| Quadrant | # 1 sec bins | Bins with >0 counts | Bins with >2000 counts | High rate bins dominated by noise | Noise dominated (total time) | Noise dominated (detector-on time) | Marked lightcurve |
|---|---|---|---|---|---|---|---|
| A | 5260 | 4010 | 0 | 0 | 0.00% | 0.00% | 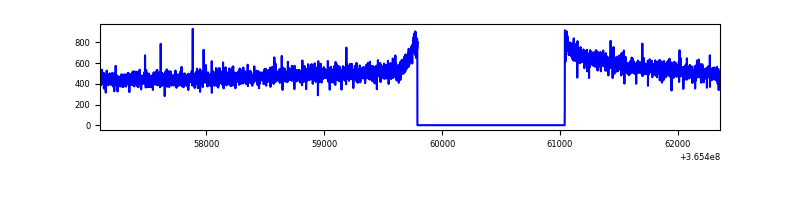 |
| B | 5260 | 4010 | 9 | 9 | 0.17% | 0.22% | 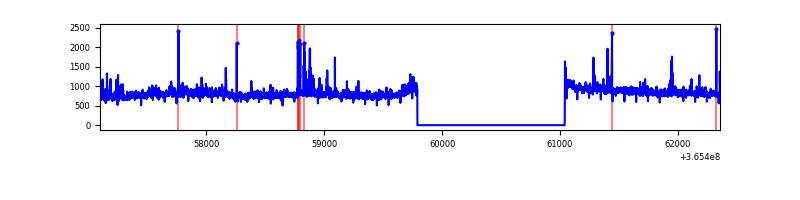 |
| C | 5260 | 4010 | 1 | 1 | 0.02% | 0.02% | 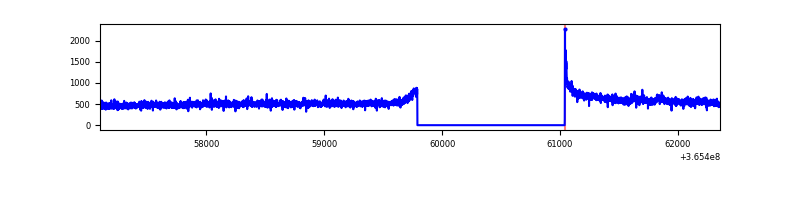 |
| D | 5260 | 4010 | 177 | 177 | 3.37% | 4.41% | 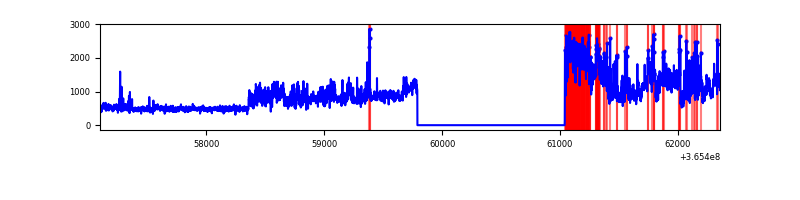 |
Top three noisy pixels from each quadrant. If the there are fewer than three noisy pixels in the level2.evt file, extra rows are filled as -1
| Pixel properties | Quadrant properties | ||||||
|---|---|---|---|---|---|---|---|
| Quadrant | DetID | PixID | Counts | Sigma | Mean | Median | Sigma |
| A | 13 | 254 | 7465 | 65.71 | 529 | 520 | 105.7 |
| A | 3 | 137 | 4896 | 41.4 | 529 | 520 | 105.7 |
| A | 0 | 226 | 4582 | 38.43 | 529 | 520 | 105.7 |
| B | 6 | 159 | 1108055 | 11321.33 | 521 | 510 | 97.8 |
| B | 4 | 80 | 98341 | 1000.03 | 521 | 510 | 97.8 |
| B | 12 | 1 | 47250 | 477.78 | 521 | 510 | 97.8 |
| C | 14 | 238 | 85441 | 721.7 | 510 | 514 | 117.7 |
| C | 3 | 233 | 44589 | 374.54 | 510 | 514 | 117.7 |
| C | 4 | 175 | 26644 | 222.05 | 510 | 514 | 117.7 |
| D | 8 | 195 | 1392900 | 11868.09 | 498 | 485 | 117.3 |
| D | 12 | 218 | 143223 | 1216.61 | 498 | 485 | 117.3 |
| D | 12 | 233 | 85136 | 721.51 | 498 | 485 | 117.3 |
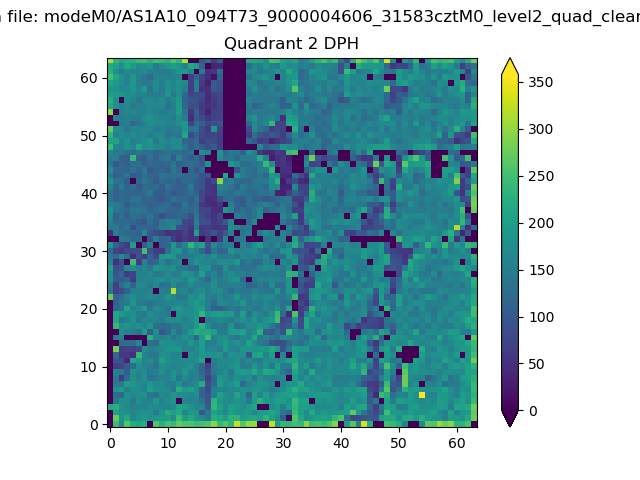
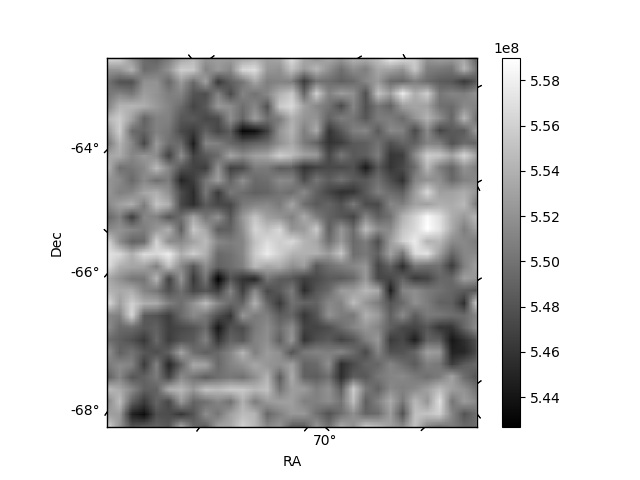
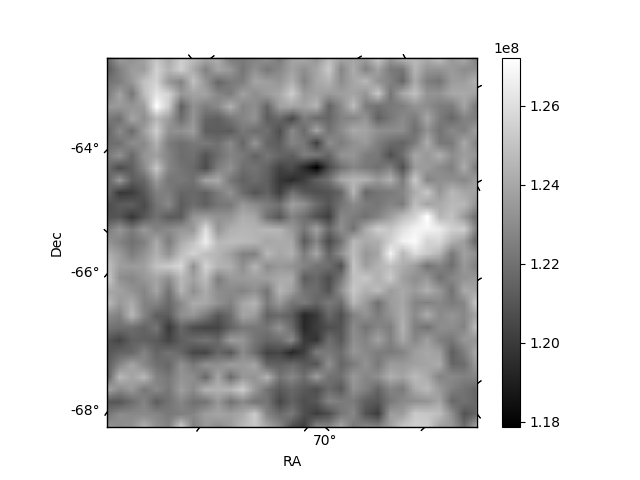
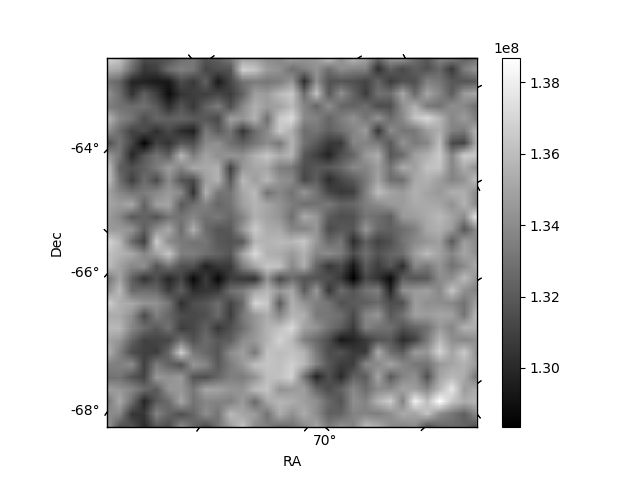
Histogram calculated using DETX and DETY for each event in the final _common_clean file
| Quadrant A | 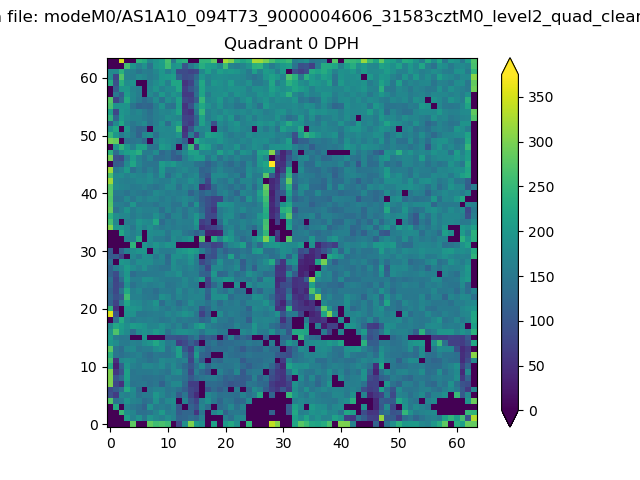 |
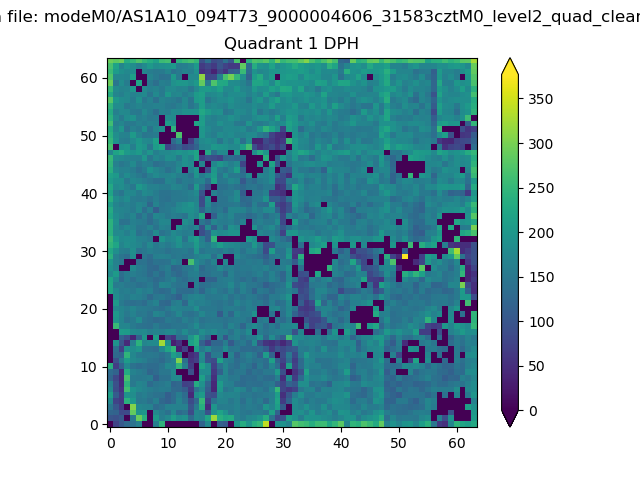 |
Quadrant B |
|---|---|---|---|
| Quadrant D | 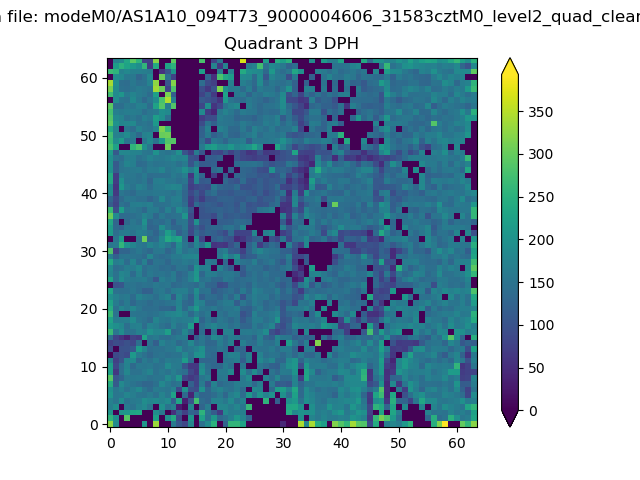 |
 |
Quadrant C |
| Plot type | Count rate plots | Images |
|---|---|---|
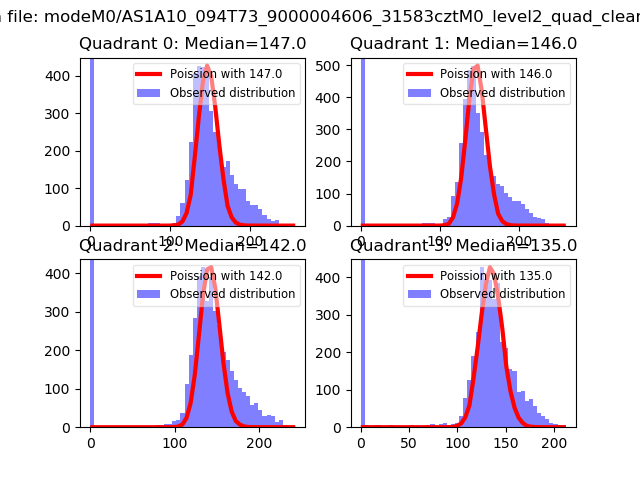
| Comparison with Poisson distribution Blue bars denote a histogram of data divided into 1 sec bins. Red curve is a Poisson curve with rate = median count rate of data. |
 |
 |
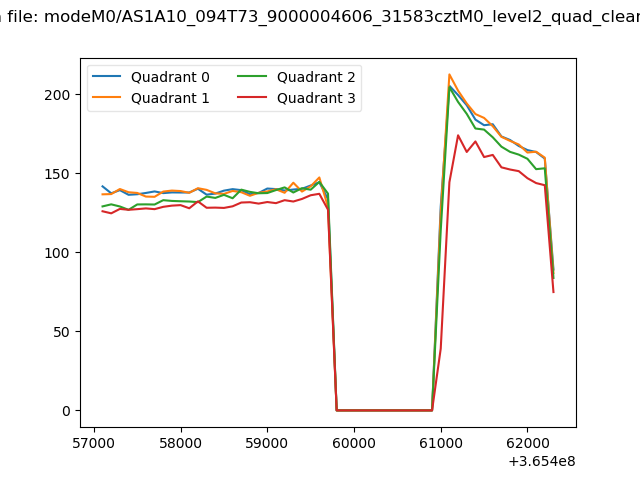
| Quadrant-wise count rates Data is divided into 100 sec bins |
 |
|
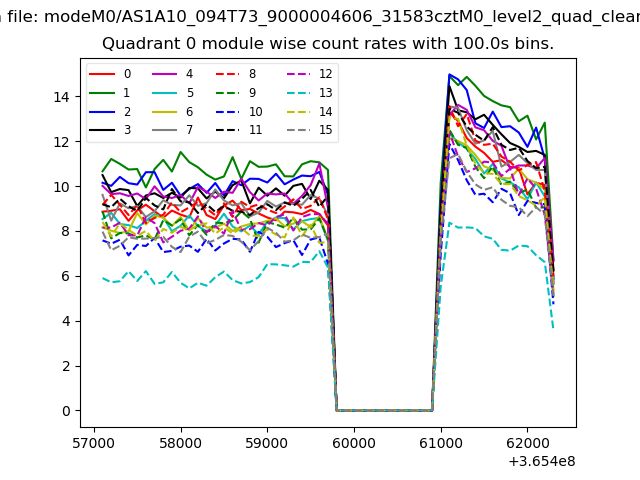
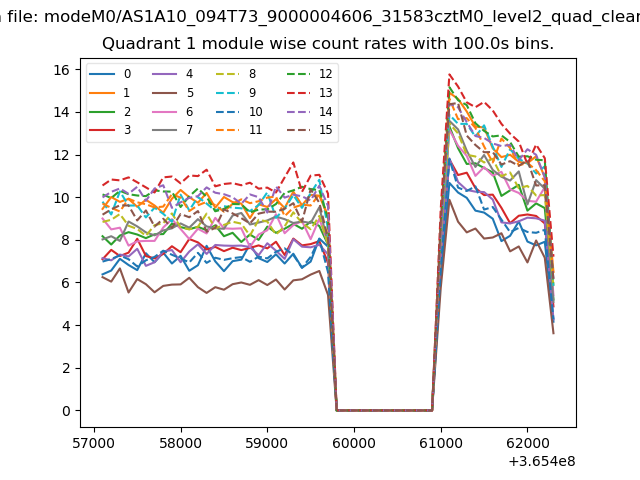
| Module-wise count rates for Quadrant A Data is divided into 100 sec bins |
 |
 |
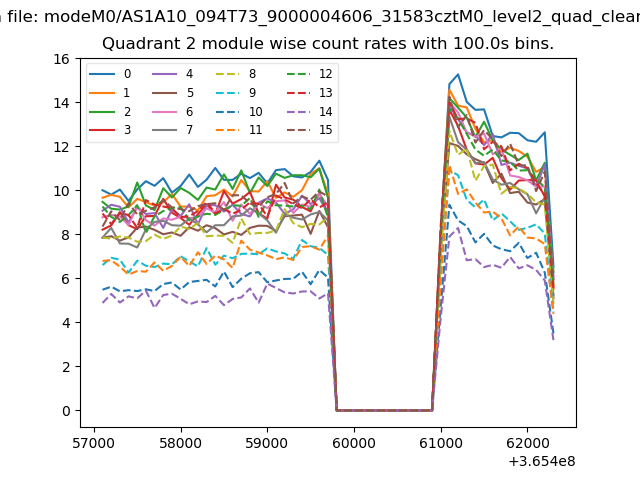
| Module-wise count rates for Quadrant B Data is divided into 100 sec bins |
 |
 |
| Module-wise count rates for Quadrant C Data is divided into 100 sec bins |
 |
 |
| Module-wise count rates for Quadrant D Data is divided into 100 sec bins |
 |
 |
| Parameter | Plot |
|---|---|
| CZT HV Monitor | 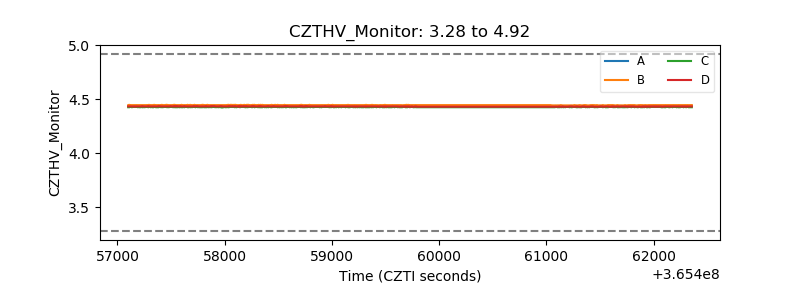 |
| D_VDD | 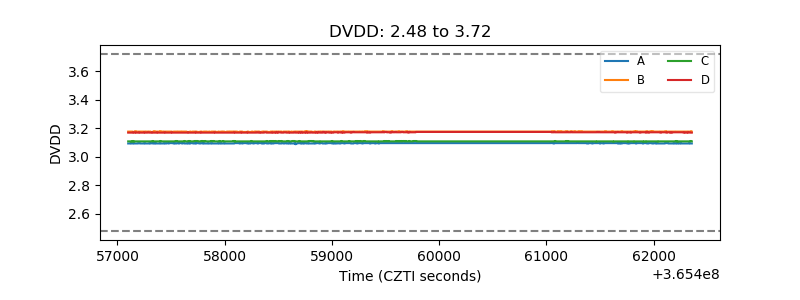 |
| Temperature 1 |  |
| Veto HV Monitor | 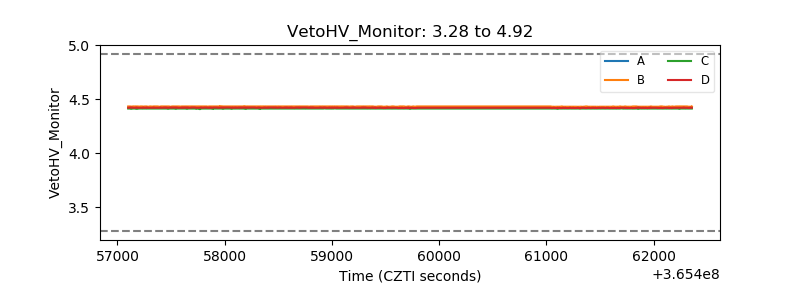 |
| Veto LLD | 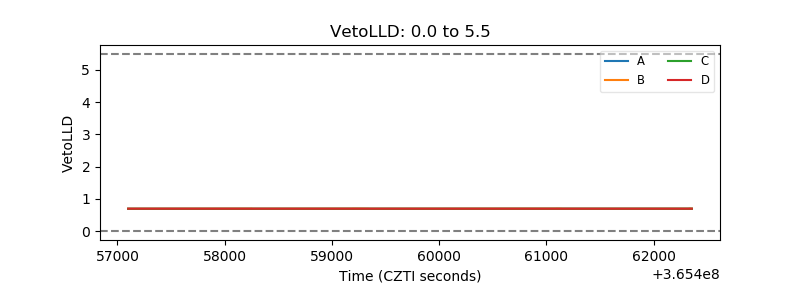 |
| Alpha Counter | 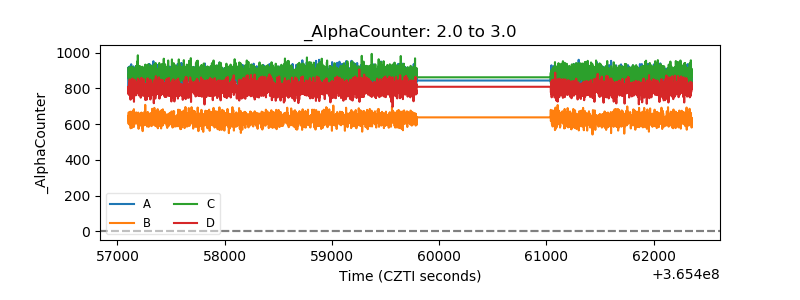 |
| _CPM_Rate | 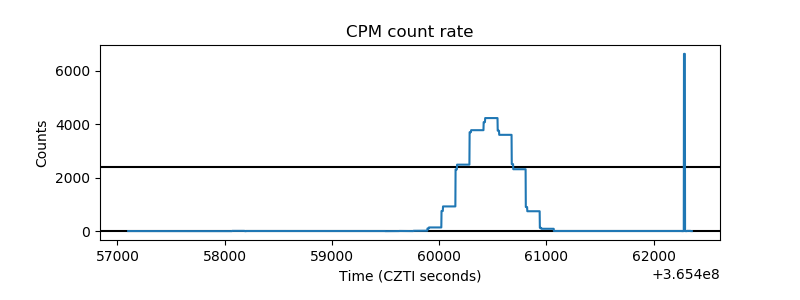 |
| CZT Counter | 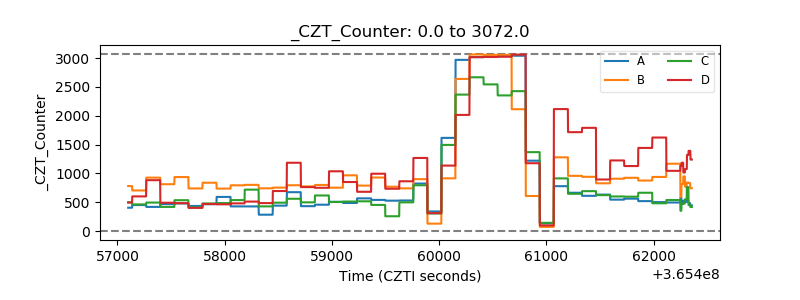 |
| +2.5 Volts monitor |  |
| +5 Volts monitor |  |
| _ROLL_ROT |  |
| _Roll_DEC | 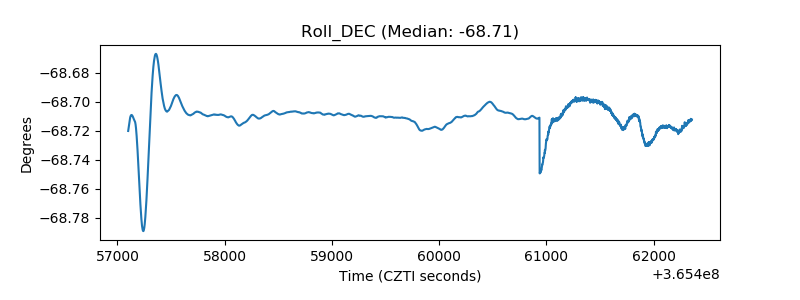 |
| _Roll_RA | 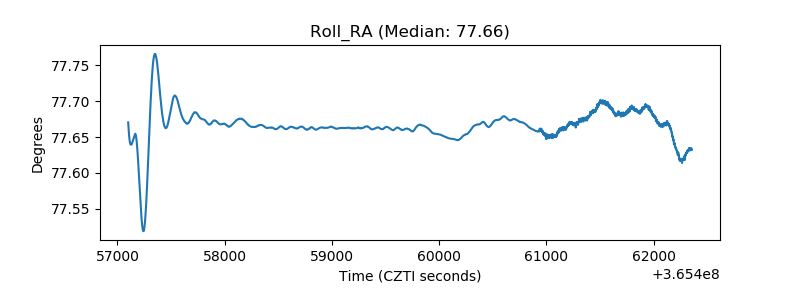 |
| Veto Counter | 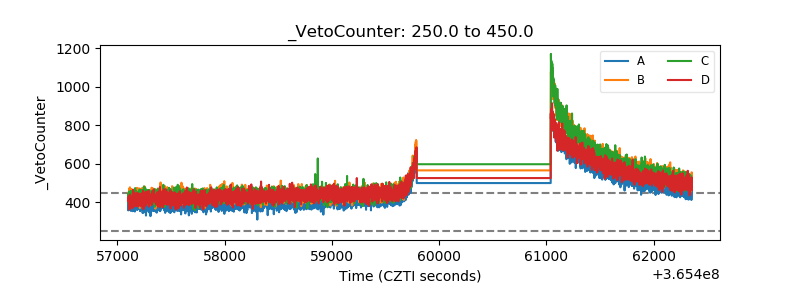 |