| Param | Original file | Final file |
|---|---|---|
| Filename | modeM0/AS1C06_006T05_9000004600cztM0_level2.fits | modeM0/AS1C06_006T05_9000004600cztM0_level2_quad_clean.evt |
| Size (bytes) | 83,759,040 | 89,141,760 |
| Size | 79.9 MB | 85.0 MB |
| Events in quadrant A | 526,702 | 577,748 |
| Events in quadrant B | 488,124 | 562,472 |
| Events in quadrant C | 475,980 | 467,531 |
| Events in quadrant D | 435,714 | 481,596 |
| Mode M9 | |||
|---|---|---|---|
| Quadrant | BADHDUFLAG | Total packets | Discarded packets |
| A | 0 | 20 | 0 |
| B | 0 | 20 | 0 |
| C | 0 | 20 | 0 |
| D | 0 | 20 | 0 |
| Mode M0 | |||
|---|---|---|---|
| Quadrant | BADHDUFLAG | Total packets | Discarded packets |
| A | 0 | 17908 | 0 |
| B | 0 | 27481 | 0 |
| C | 0 | 26662 | 0 |
| D | 0 | 28386 | 0 |
| Mode SS | |||
|---|---|---|---|
| Quadrant | BADHDUFLAG | Total packets | Discarded packets |
| A | 0 | 210 | 0 |
| B | 0 | 206 | 0 |
| C | 0 | 212 | 0 |
| D | 0 | 208 | 0 |
| Quadrant | Total seconds | Saturated seconds | Saturation percentage |
|---|---|---|---|
| A | 8700 | 96 | 1.103448% |
| B | 8673 | 242 | 2.790269% |
| C | 8665 | 1167 | 13.467975% |
| D | 8662 | 299 | 3.451859% |
Noise dominated data is calculated using 1-second bins in cleaned event files. If a bin has >2000 counts, and if more than 50% of those come from <1% of pixels, then it is considered to be noise-dominated and hence unusable.
| Quadrant | # 1 sec bins | Bins with >0 counts | Bins with >2000 counts | High rate bins dominated by noise | Noise dominated (total time) | Noise dominated (detector-on time) | Marked lightcurve |
|---|---|---|---|---|---|---|---|
| A | 15709 | 8735 | 0 | 0 | 0.00% | 0.00% |  |
| B | 15709 | 8709 | 0 | 0 | 0.00% | 0.00% | 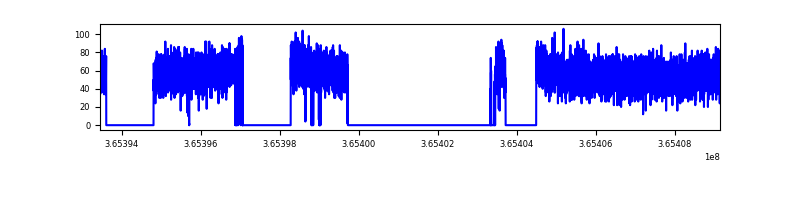 |
| C | 15708 | 8704 | 0 | 0 | 0.00% | 0.00% | 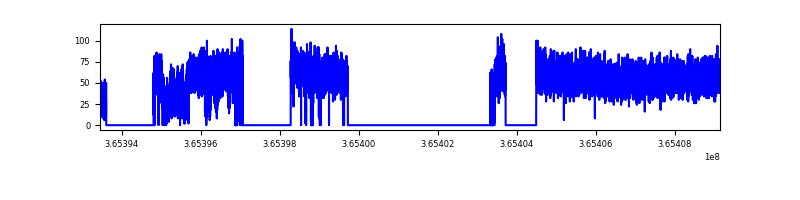 |
| D | 15709 | 8694 | 0 | 0 | 0.00% | 0.00% | 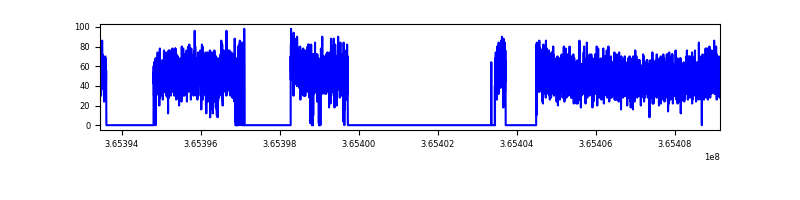 |
Top three noisy pixels from each quadrant. If the there are fewer than three noisy pixels in the level2.evt file, extra rows are filled as -1
| Pixel properties | Quadrant properties | ||||||
|---|---|---|---|---|---|---|---|
| Quadrant | DetID | PixID | Counts | Sigma | Mean | Median | Sigma |
| A | 0 | 29 | 495 | 10.33 | 137 | 129 | 35.4 |
| A | 7 | 110 | 450 | 9.06 | 137 | 129 | 35.4 |
| A | 9 | 19 | 409 | 7.9 | 137 | 129 | 35.4 |
| B | 2 | 9 | 380 | 8.99 | 129 | 123 | 28.6 |
| B | 5 | 232 | 326 | 7.1 | 129 | 123 | 28.6 |
| B | 2 | 8 | 318 | 6.82 | 129 | 123 | 28.6 |
| C | 1 | 81 | 370 | 7.53 | 126 | 118 | 33.4 |
| C | 1 | 80 | 366 | 7.41 | 126 | 118 | 33.4 |
| C | 3 | 187 | 338 | 6.58 | 126 | 118 | 33.4 |
| D | 4 | 246 | 337 | 6.49 | 124 | 113 | 34.5 |
| D | 6 | 231 | 319 | 5.96 | 124 | 113 | 34.5 |
| D | 6 | 38 | 313 | 5.79 | 124 | 113 | 34.5 |
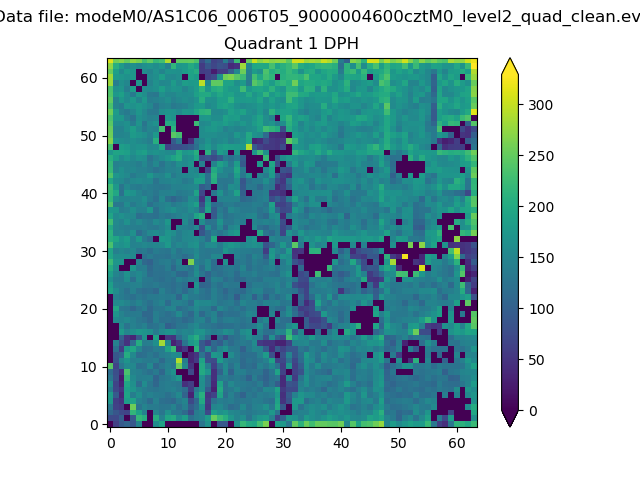
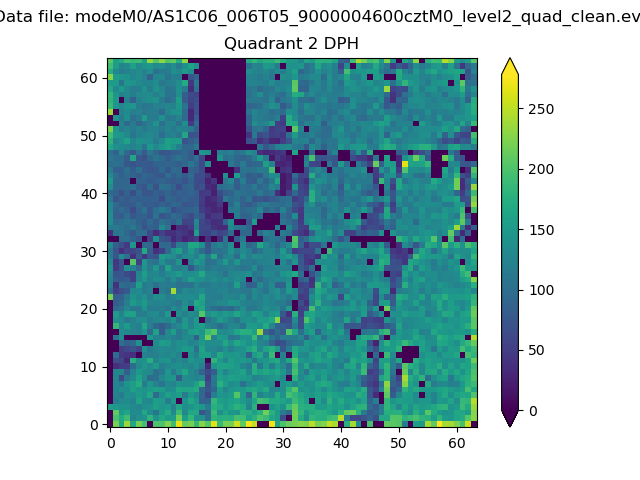
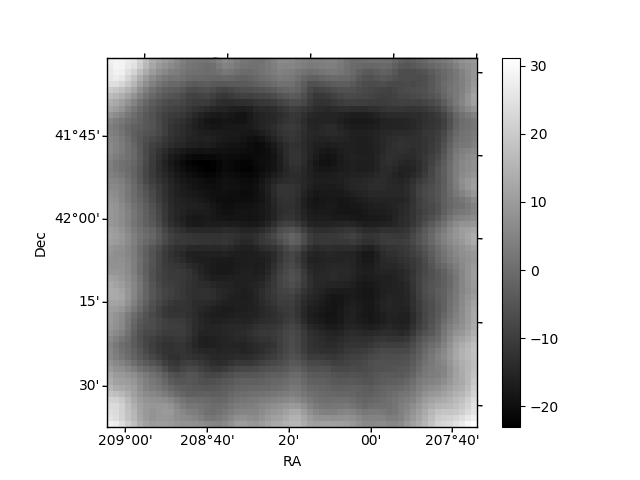
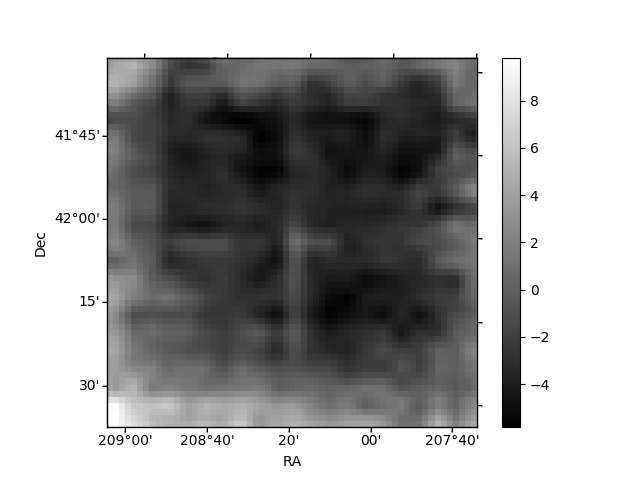
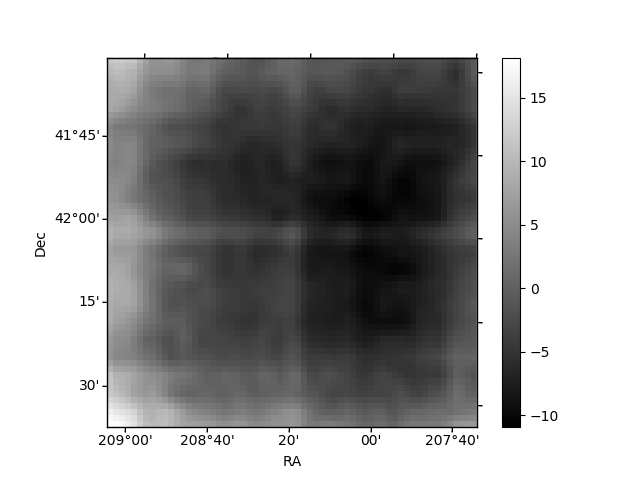
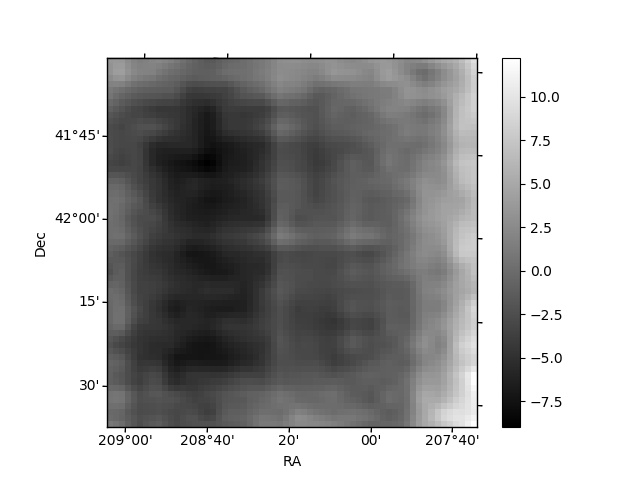
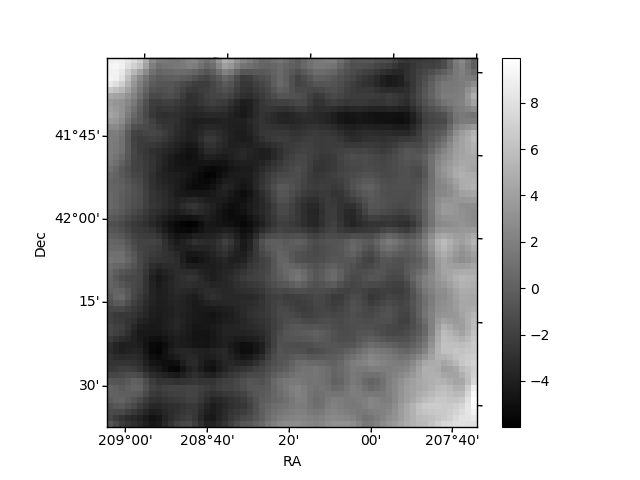
Histogram calculated using DETX and DETY for each event in the final _common_clean file
| Quadrant A | 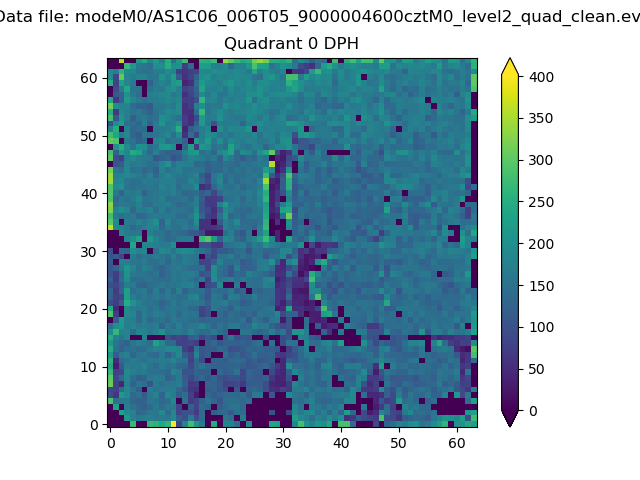 |
 |
Quadrant B |
|---|---|---|---|
| Quadrant D | 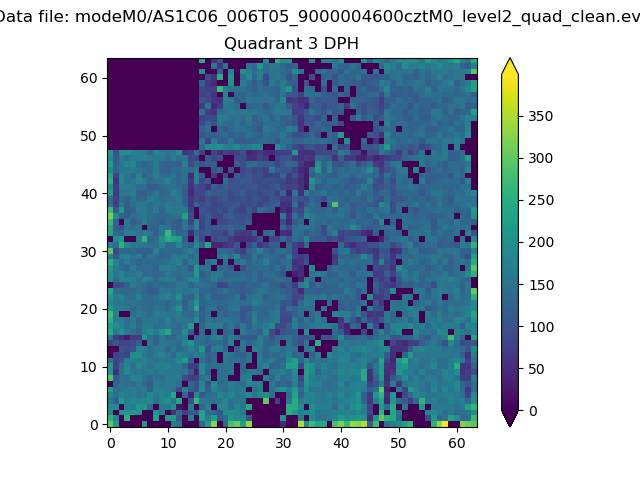 |
 |
Quadrant C |
| Plot type | Count rate plots | Images |
|---|---|---|
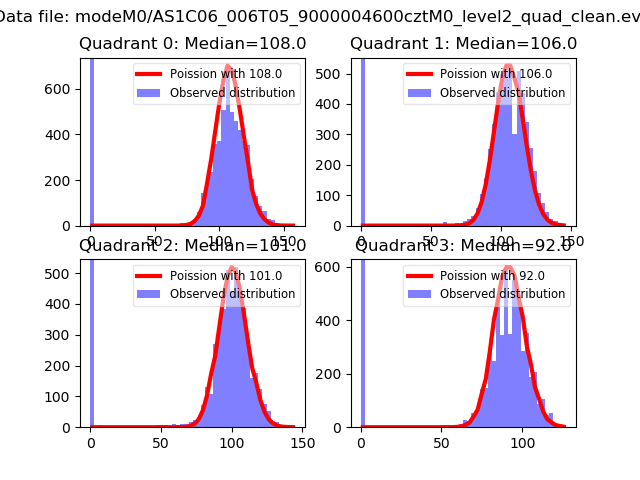
| Comparison with Poisson distribution Blue bars denote a histogram of data divided into 1 sec bins. Red curve is a Poisson curve with rate = median count rate of data. |
 |
 |
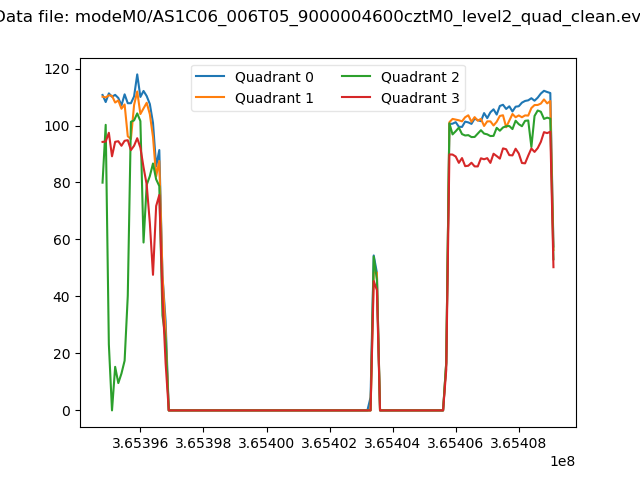
| Quadrant-wise count rates Data is divided into 100 sec bins |
 |
|
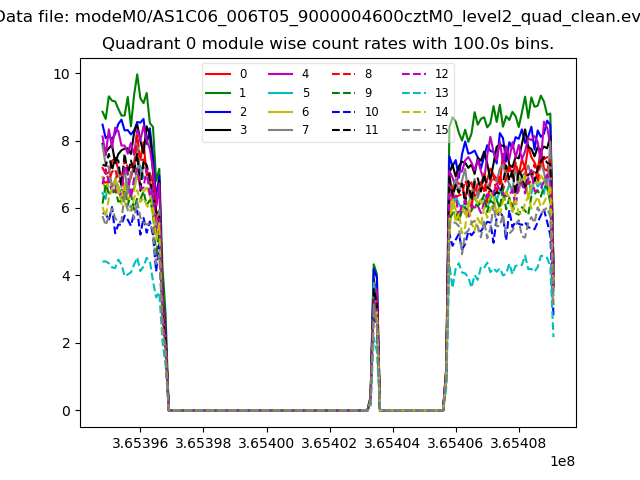
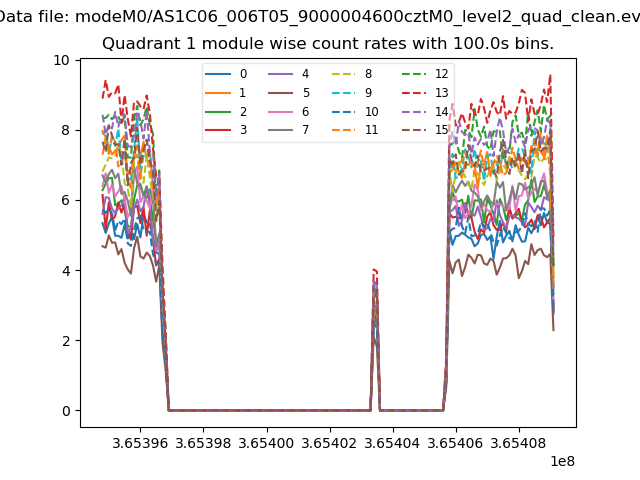
| Module-wise count rates for Quadrant A Data is divided into 100 sec bins |
 |
 |
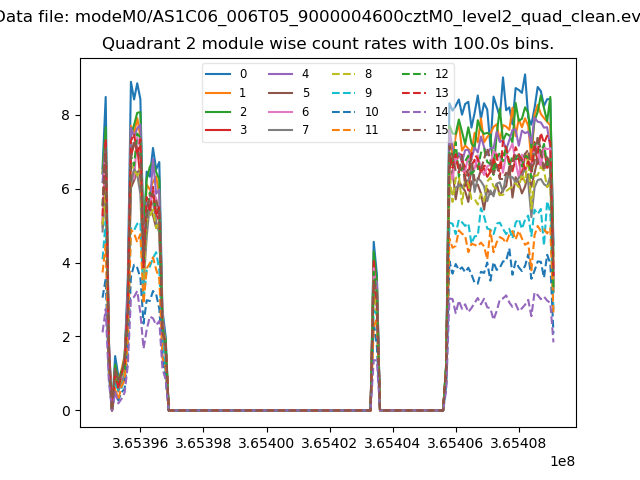
| Module-wise count rates for Quadrant B Data is divided into 100 sec bins |
 |
 |
| Module-wise count rates for Quadrant C Data is divided into 100 sec bins |
 |
 |
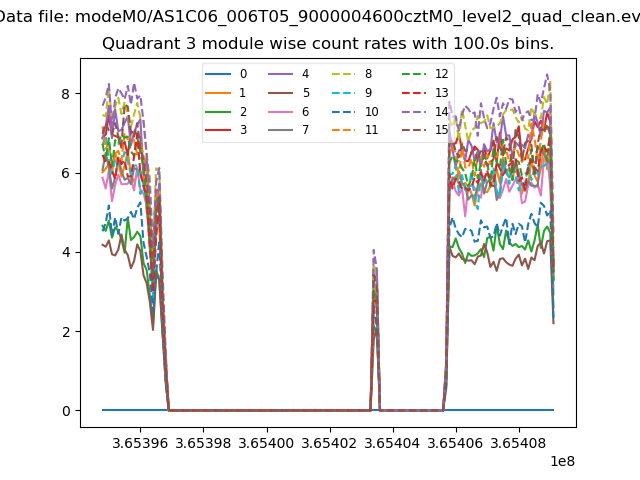
| Module-wise count rates for Quadrant D Data is divided into 100 sec bins |
 |
 |
| Parameter | Plot |
|---|---|
| CZT HV Monitor | 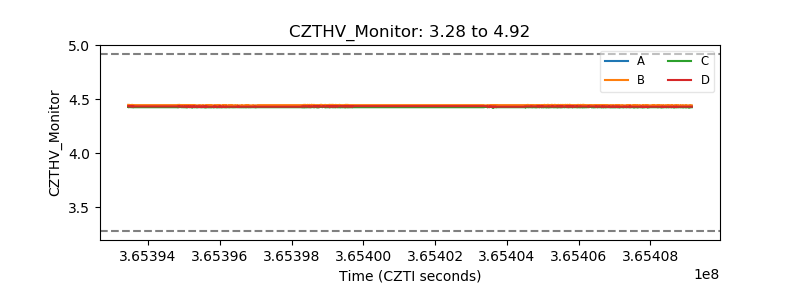 |
| D_VDD | 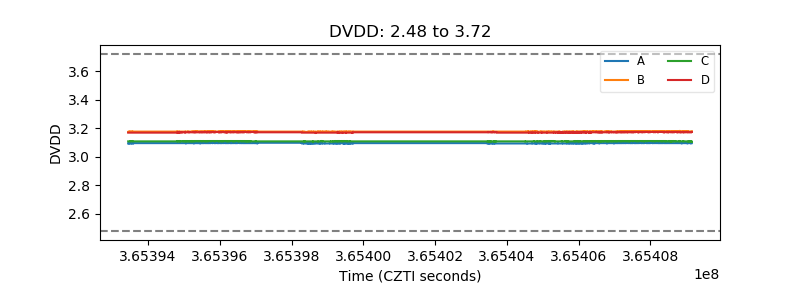 |
| Temperature 1 | 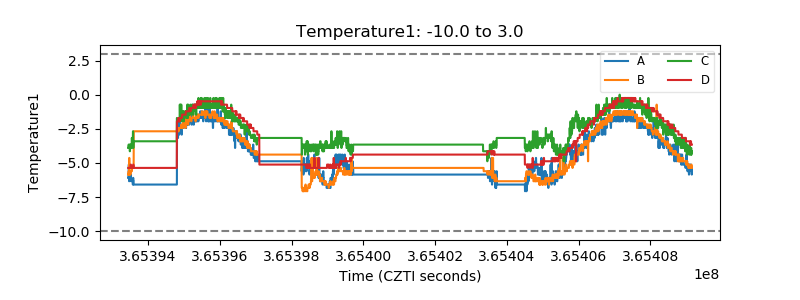 |
| Veto HV Monitor | 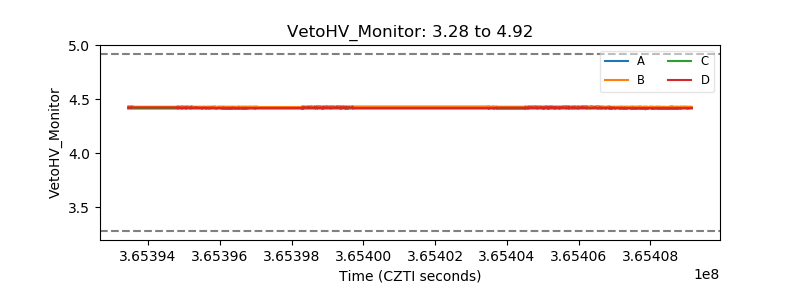 |
| Veto LLD | 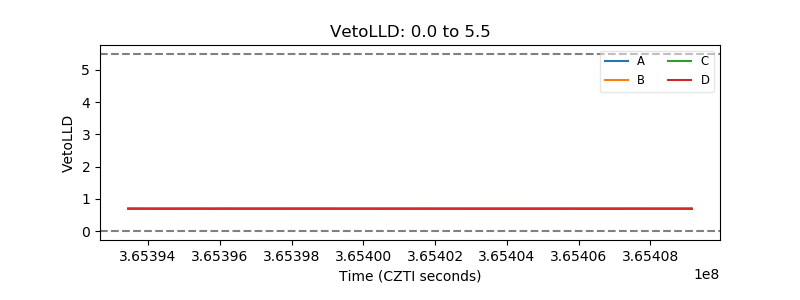 |
| Alpha Counter | 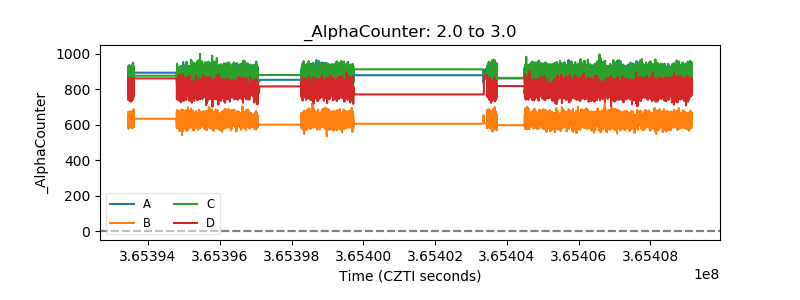 |
| _CPM_Rate | 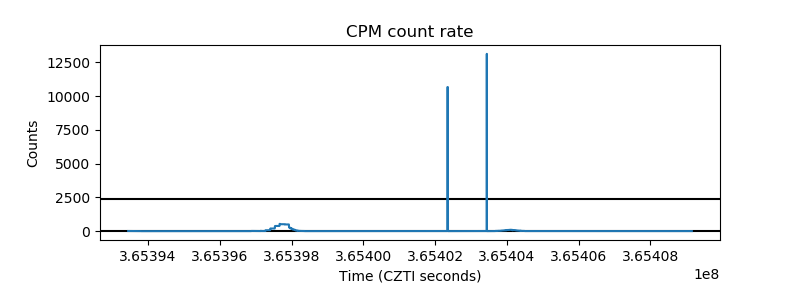 |
| CZT Counter | 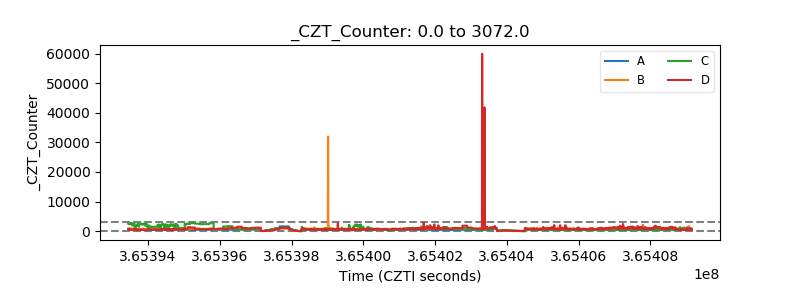 |
| +2.5 Volts monitor | 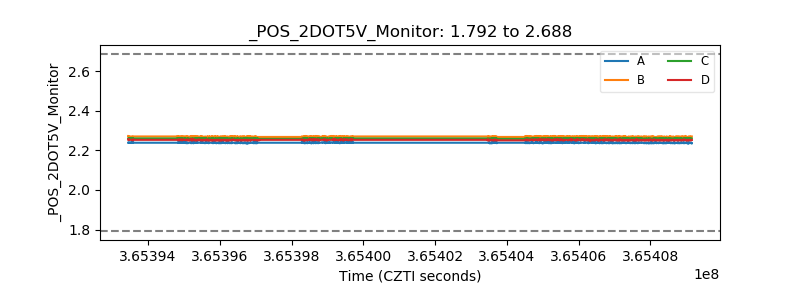 |
| +5 Volts monitor | 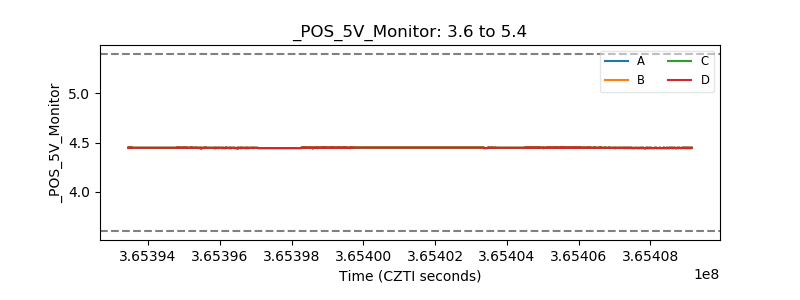 |
| _ROLL_ROT | 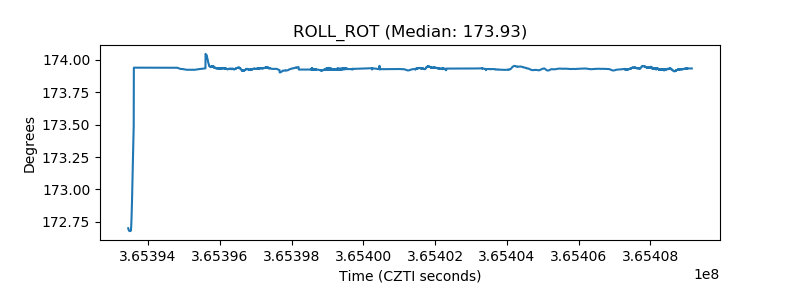 |
| _Roll_DEC | 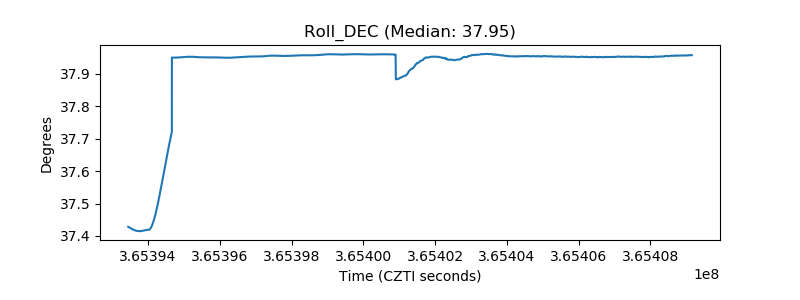 |
| _Roll_RA | 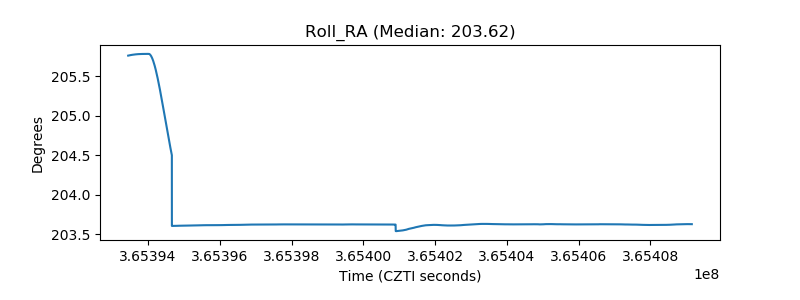 |
| Veto Counter | 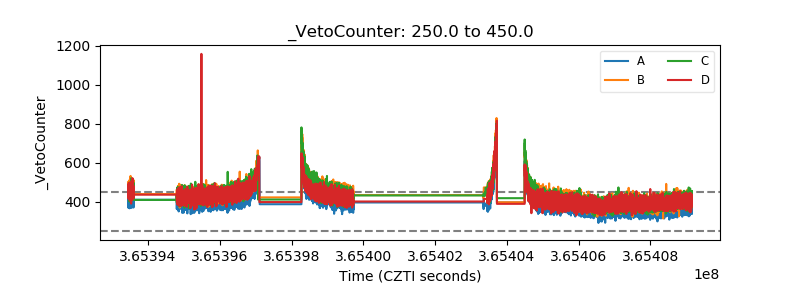 |