| Param | Original file | Final file |
|---|---|---|
| Filename | modeM0/AS1C06_006T05_9000004600_31572cztM0_level2.evt | modeM0/AS1C06_006T05_9000004600_31572cztM0_level2_quad_clean.evt |
| Size (bytes) | 396,659,520 | 45,806,400 |
| Size | 378.3 MB | 43.7 MB |
| Events in quadrant A | 1,765,471 | 309,320 |
| Events in quadrant B | 3,024,384 | 301,403 |
| Events in quadrant C | 3,989,197 | 244,741 |
| Events in quadrant D | 2,989,839 | 276,596 |
| Mode M9 | |||
|---|---|---|---|
| Quadrant | BADHDUFLAG | Total packets | Discarded packets |
| A | 0 | 12 | 0 |
| B | 0 | 12 | 0 |
| C | 0 | 12 | 0 |
| D | 0 | 12 | 0 |
| Mode M0 | |||
|---|---|---|---|
| Quadrant | BADHDUFLAG | Total packets | Discarded packets |
| A | 0 | 7823 | 387 |
| B | 0 | 12145 | 580 |
| C | 0 | 14978 | 581 |
| D | 0 | 11974 | 586 |
| Mode SS | |||
|---|---|---|---|
| Quadrant | BADHDUFLAG | Total packets | Discarded packets |
| A | 0 | 76 | 2 |
| B | 0 | 76 | 4 |
| C | 0 | 76 | 0 |
| D | 0 | 76 | 2 |
| Quadrant | Total seconds | Saturated seconds | Saturation percentage |
|---|---|---|---|
| A | 3606 | 11 | 0.305047% |
| B | 3586 | 78 | 2.175125% |
| C | 3571 | 858 | 24.026883% |
| D | 3579 | 159 | 4.442582% |
Noise dominated data is calculated using 1-second bins in cleaned event files. If a bin has >2000 counts, and if more than 50% of those come from <1% of pixels, then it is considered to be noise-dominated and hence unusable.
| Quadrant | # 1 sec bins | Bins with >0 counts | Bins with >2000 counts | High rate bins dominated by noise | Noise dominated (total time) | Noise dominated (detector-on time) | Marked lightcurve |
|---|---|---|---|---|---|---|---|
| A | 4922 | 3635 | 0 | 0 | 0.00% | 0.00% | 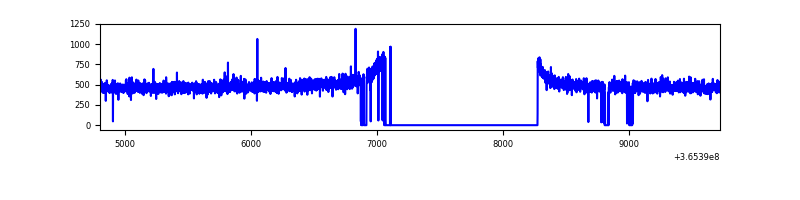 |
| B | 4922 | 3621 | 19 | 19 | 0.39% | 0.52% | 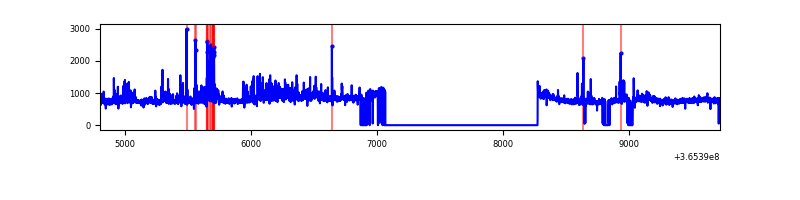 |
| C | 4922 | 3613 | 696 | 696 | 14.14% | 19.26% | 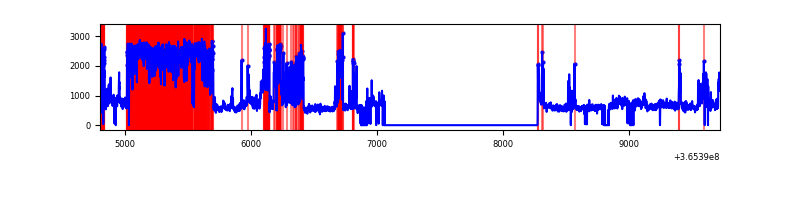 |
| D | 4922 | 3615 | 141 | 141 | 2.86% | 3.90% | 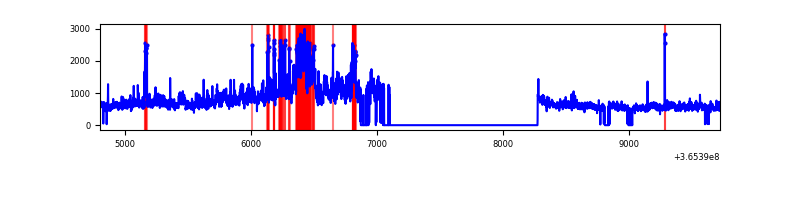 |
Top three noisy pixels from each quadrant. If the there are fewer than three noisy pixels in the level2.evt file, extra rows are filled as -1
| Pixel properties | Quadrant properties | ||||||
|---|---|---|---|---|---|---|---|
| Quadrant | DetID | PixID | Counts | Sigma | Mean | Median | Sigma |
| A | 13 | 254 | 6690 | 67.23 | 457 | 446 | 92.9 |
| A | 3 | 137 | 4475 | 43.38 | 457 | 446 | 92.9 |
| A | 0 | 226 | 3919 | 37.39 | 457 | 446 | 92.9 |
| B | 6 | 159 | 972711 | 11252.08 | 447 | 436 | 86.4 |
| B | 4 | 80 | 187058 | 2159.77 | 447 | 436 | 86.4 |
| B | 5 | 172 | 40732 | 466.34 | 447 | 436 | 86.4 |
| C | 3 | 233 | 2318151 | 24698.2 | 398 | 401 | 93.8 |
| C | 14 | 238 | 64120 | 679.0 | 398 | 401 | 93.8 |
| C | 0 | 10 | 19932 | 208.12 | 398 | 401 | 93.8 |
| D | 8 | 195 | 906433 | 8680.87 | 432 | 419 | 104.4 |
| D | 12 | 218 | 209136 | 1999.8 | 432 | 419 | 104.4 |
| D | 12 | 33 | 79102 | 753.89 | 432 | 419 | 104.4 |
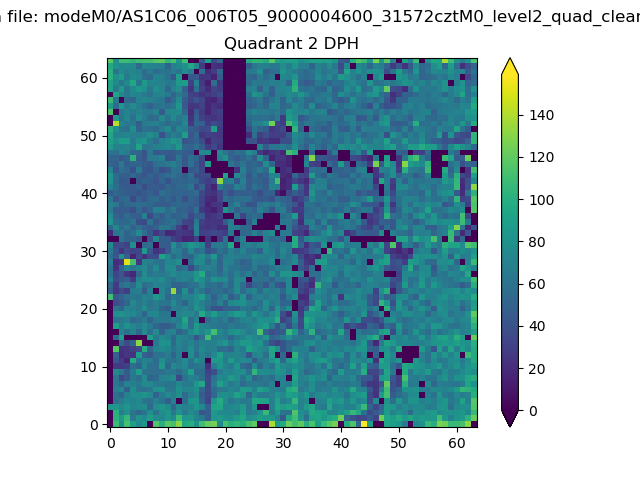
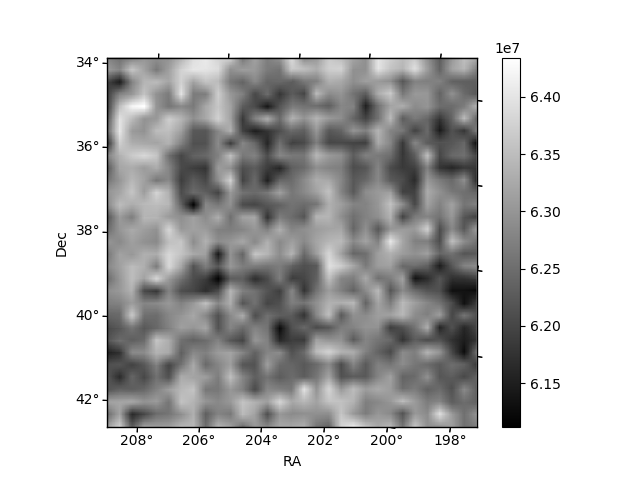
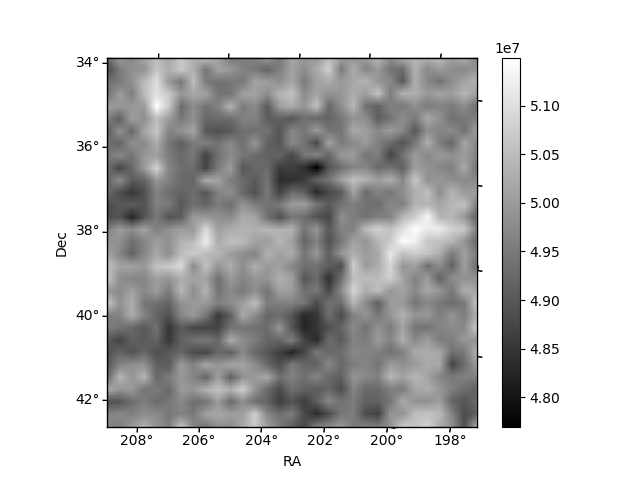
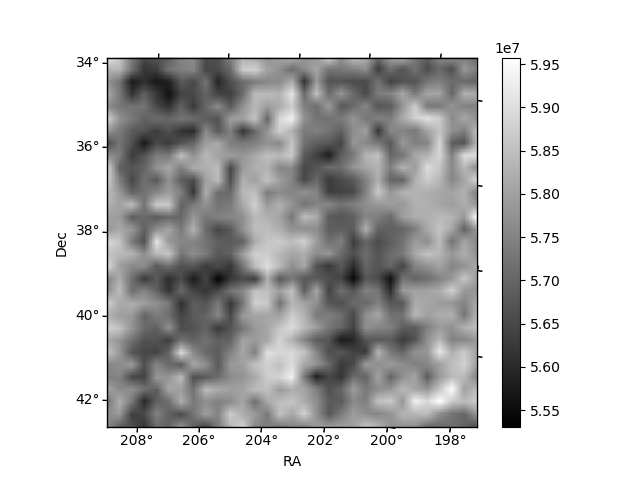
Histogram calculated using DETX and DETY for each event in the final _common_clean file
| Quadrant A | 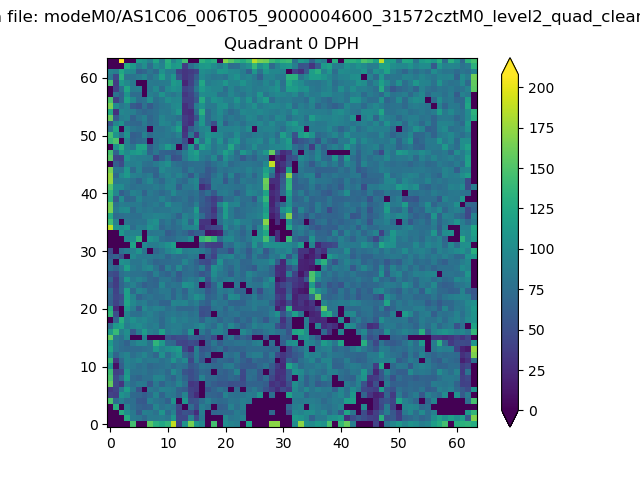 |
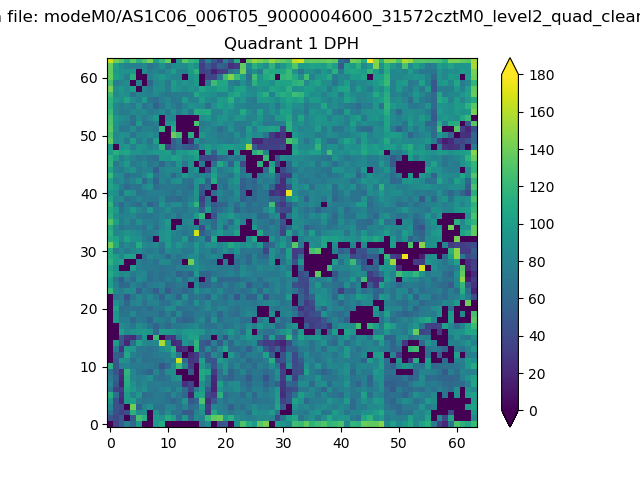 |
Quadrant B |
|---|---|---|---|
| Quadrant D | 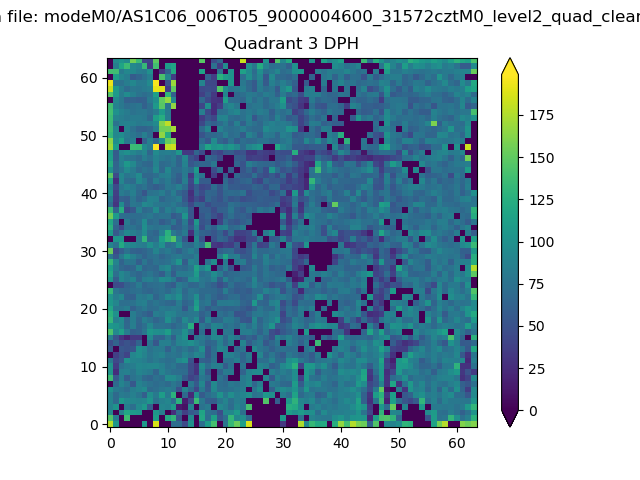 |
 |
Quadrant C |
| Plot type | Count rate plots | Images |
|---|---|---|
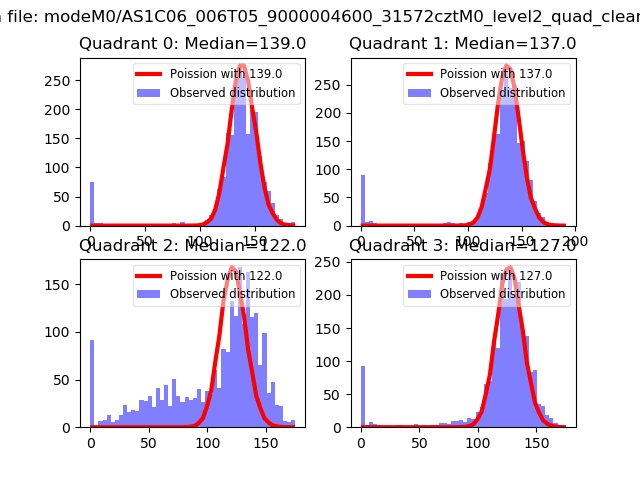
| Comparison with Poisson distribution Blue bars denote a histogram of data divided into 1 sec bins. Red curve is a Poisson curve with rate = median count rate of data. |
 |
 |
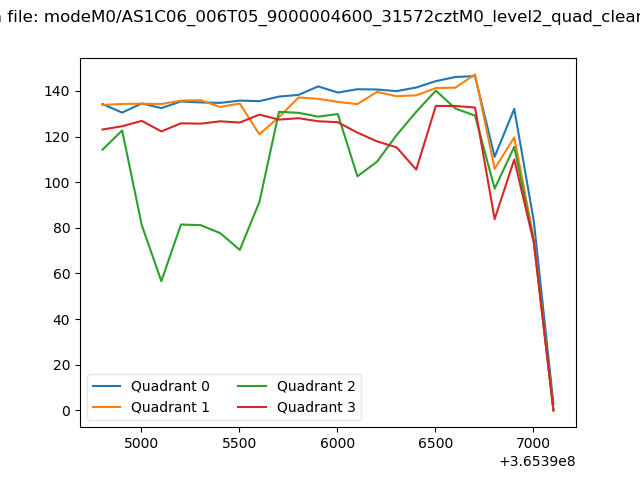
| Quadrant-wise count rates Data is divided into 100 sec bins |
 |
|
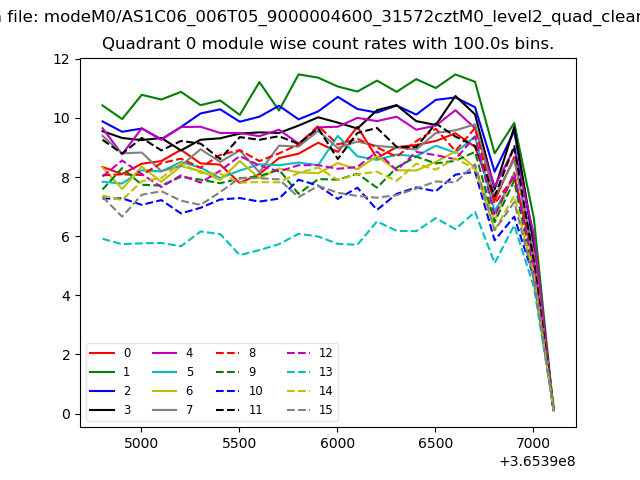
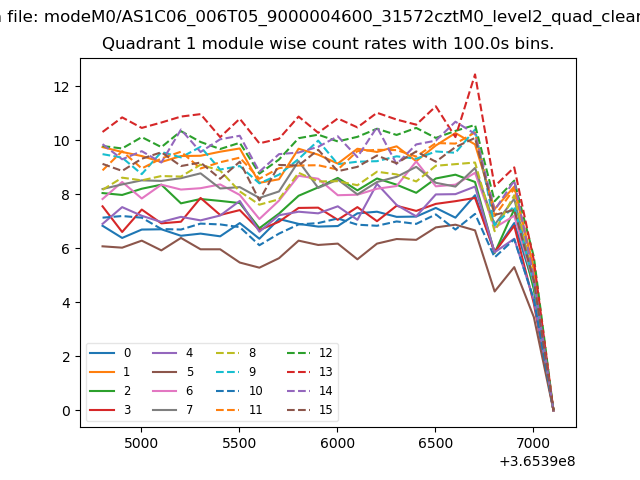
| Module-wise count rates for Quadrant A Data is divided into 100 sec bins |
 |
 |
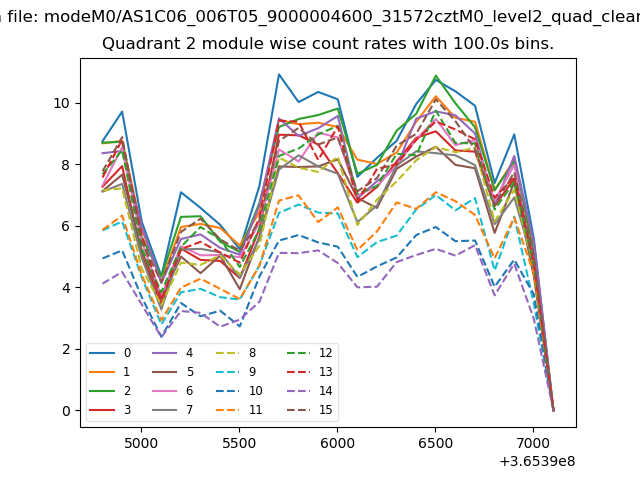
| Module-wise count rates for Quadrant B Data is divided into 100 sec bins |
 |
 |
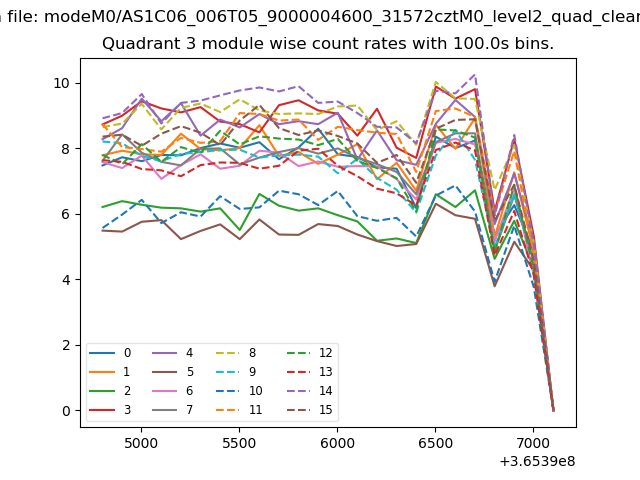
| Module-wise count rates for Quadrant C Data is divided into 100 sec bins |
 |
 |
| Module-wise count rates for Quadrant D Data is divided into 100 sec bins |
 |
 |
| Parameter | Plot |
|---|---|
| CZT HV Monitor | 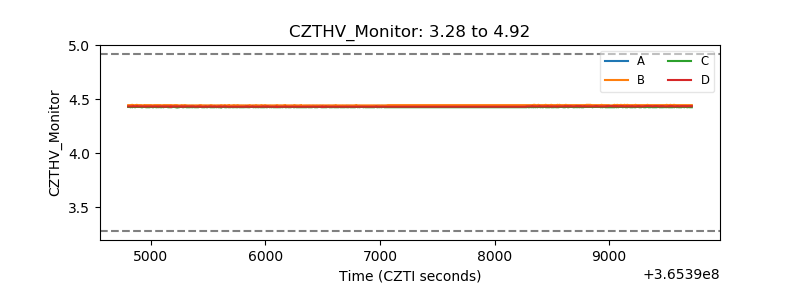 |
| D_VDD | 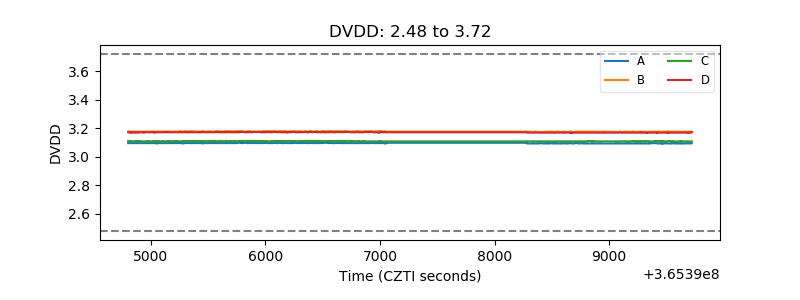 |
| Temperature 1 | 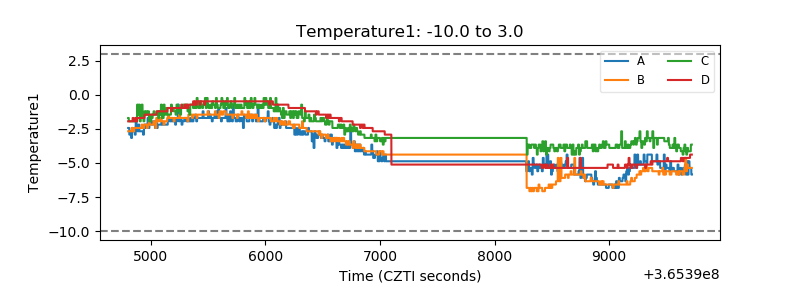 |
| Veto HV Monitor | 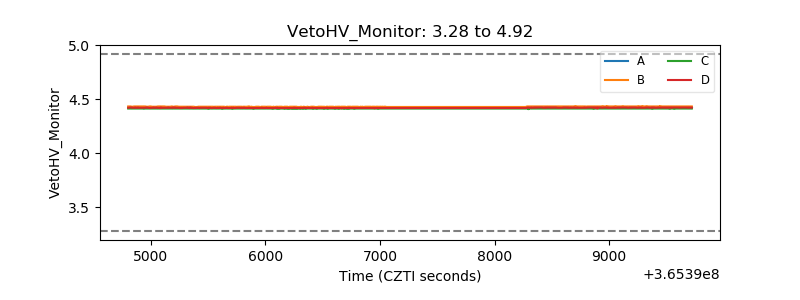 |
| Veto LLD | 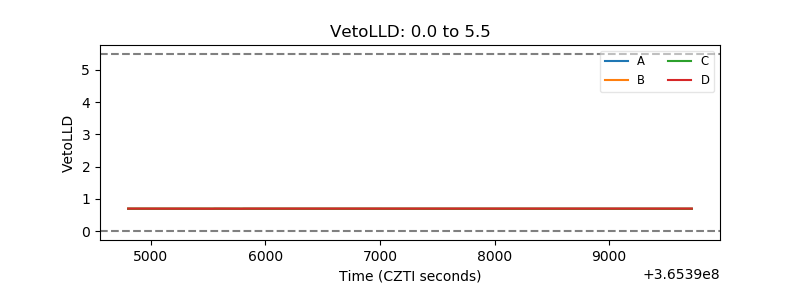 |
| Alpha Counter | 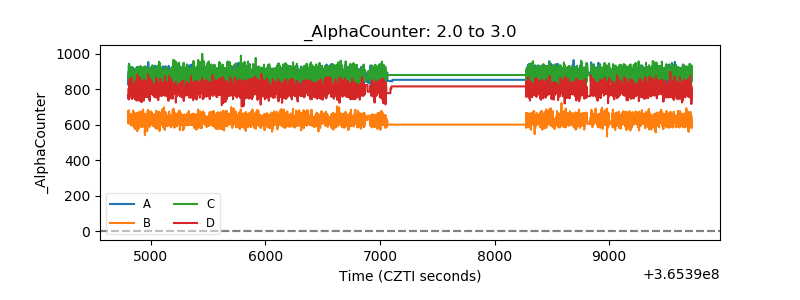 |
| _CPM_Rate | 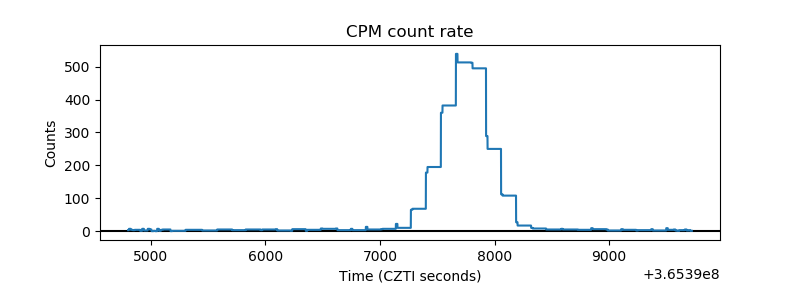 |
| CZT Counter |  |
| +2.5 Volts monitor | 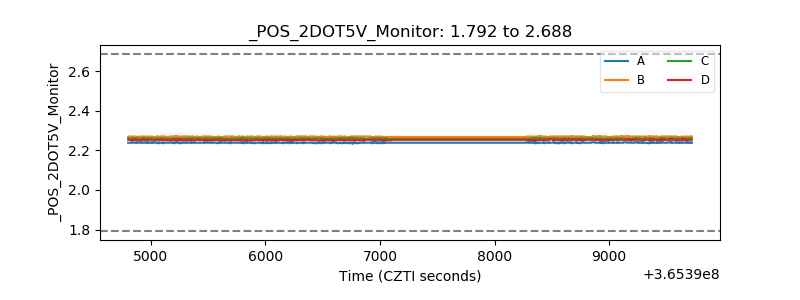 |
| +5 Volts monitor |  |
| _ROLL_ROT | 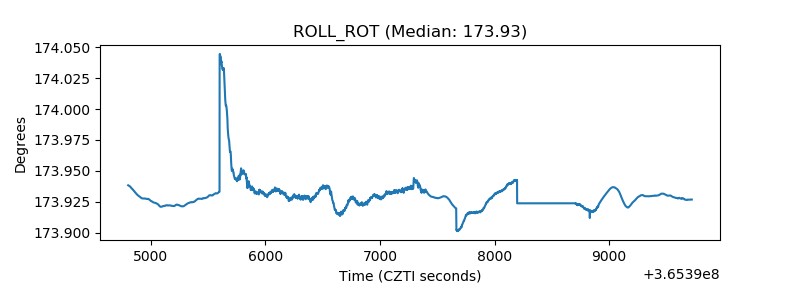 |
| _Roll_DEC | 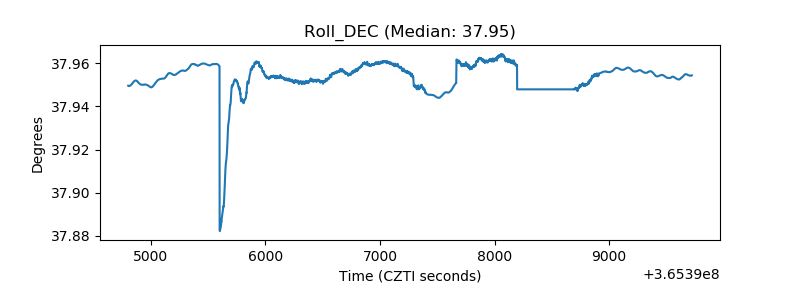 |
| _Roll_RA | 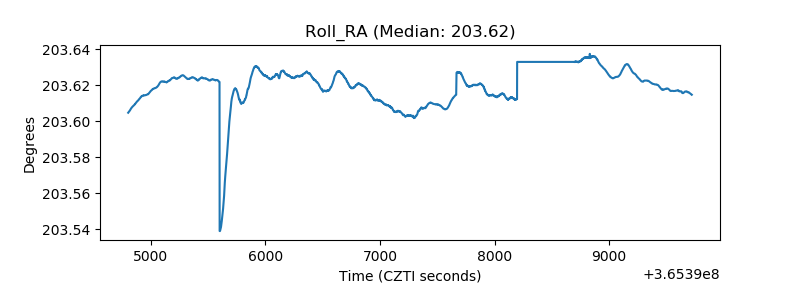 |
| Veto Counter | 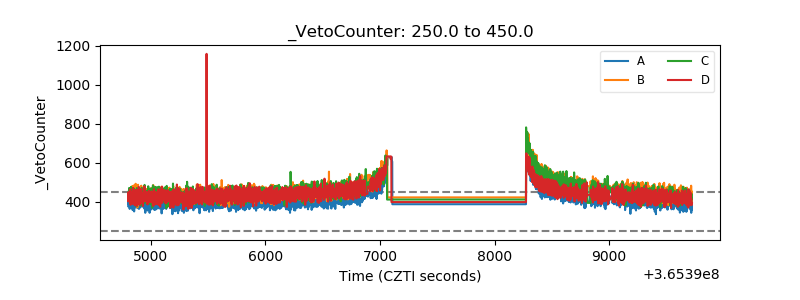 |