| Param | Original file | Final file |
|---|---|---|
| Filename | modeM0/AS1C06_006T06_9000004608cztM0_level2.fits | modeM0/AS1C06_006T06_9000004608cztM0_level2_quad_clean.evt |
| Size (bytes) | 172,270,080 | 177,727,680 |
| Size | 164.3 MB | 169.5 MB |
| Events in quadrant A | 1,117,965 | 1,185,468 |
| Events in quadrant B | 926,278 | 893,899 |
| Events in quadrant C | 1,067,512 | 1,119,314 |
| Events in quadrant D | 890,264 | 970,006 |
| Mode M9 | |||
|---|---|---|---|
| Quadrant | BADHDUFLAG | Total packets | Discarded packets |
| A | 0 | 32 | 0 |
| B | 0 | 33 | 0 |
| C | 0 | 33 | 0 |
| D | 0 | 34 | 0 |
| Mode M0 | |||
|---|---|---|---|
| Quadrant | BADHDUFLAG | Total packets | Discarded packets |
| A | 0 | 36392 | 0 |
| B | 0 | 74177 | 0 |
| C | 0 | 37305 | 0 |
| D | 0 | 60239 | 0 |
| Mode SS | |||
|---|---|---|---|
| Quadrant | BADHDUFLAG | Total packets | Discarded packets |
| A | 0 | 366 | 0 |
| B | 0 | 364 | 0 |
| C | 0 | 374 | 0 |
| D | 0 | 366 | 0 |
| Quadrant | Total seconds | Saturated seconds | Saturation percentage |
|---|---|---|---|
| A | 17705 | 155 | 0.875459% |
| B | 17315 | 3473 | 20.057753% |
| C | 17724 | 303 | 1.709546% |
| D | 17497 | 1235 | 7.058353% |
Noise dominated data is calculated using 1-second bins in cleaned event files. If a bin has >2000 counts, and if more than 50% of those come from <1% of pixels, then it is considered to be noise-dominated and hence unusable.
| Quadrant | # 1 sec bins | Bins with >0 counts | Bins with >2000 counts | High rate bins dominated by noise | Noise dominated (total time) | Noise dominated (detector-on time) | Marked lightcurve |
|---|---|---|---|---|---|---|---|
| A | 25201 | 17906 | 0 | 0 | 0.00% | 0.00% |  |
| B | 25198 | 17547 | 0 | 0 | 0.00% | 0.00% | 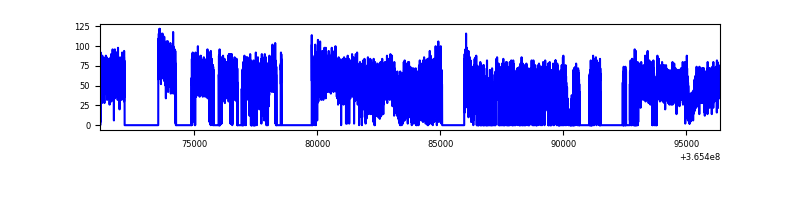 |
| C | 25208 | 17922 | 0 | 0 | 0.00% | 0.00% | 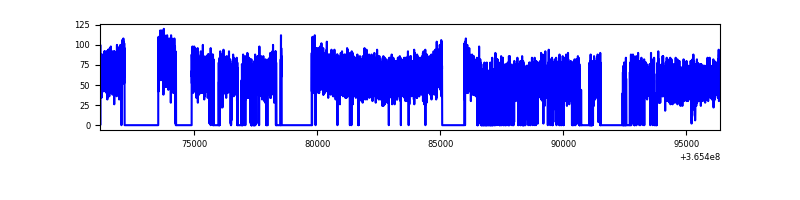 |
| D | 25196 | 17677 | 0 | 0 | 0.00% | 0.00% | 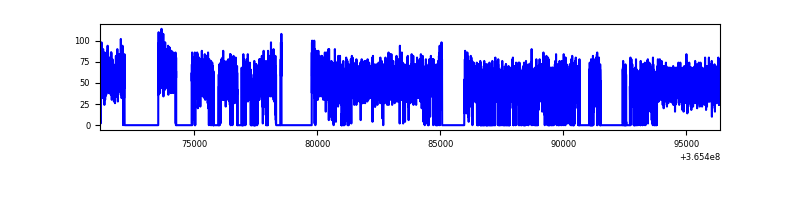 |
Top three noisy pixels from each quadrant. If the there are fewer than three noisy pixels in the level2.evt file, extra rows are filled as -1
| Pixel properties | Quadrant properties | ||||||
|---|---|---|---|---|---|---|---|
| Quadrant | DetID | PixID | Counts | Sigma | Mean | Median | Sigma |
| A | 0 | 29 | 1077 | 10.96 | 291 | 275 | 73.2 |
| A | 7 | 110 | 900 | 8.54 | 291 | 275 | 73.2 |
| A | 9 | 19 | 842 | 7.75 | 291 | 275 | 73.2 |
| B | 2 | 9 | 722 | 9.64 | 245 | 236 | 50.4 |
| B | 3 | 17 | 644 | 8.09 | 245 | 236 | 50.4 |
| B | 3 | 80 | 638 | 7.97 | 245 | 236 | 50.4 |
| C | 1 | 81 | 823 | 7.78 | 282 | 266 | 71.6 |
| C | 1 | 80 | 820 | 7.73 | 282 | 266 | 71.6 |
| C | 3 | 187 | 761 | 6.91 | 282 | 266 | 71.6 |
| D | 4 | 246 | 700 | 6.77 | 254 | 231 | 69.2 |
| D | 15 | 63 | 655 | 6.12 | 254 | 231 | 69.2 |
| D | 7 | 3 | 648 | 6.02 | 254 | 231 | 69.2 |
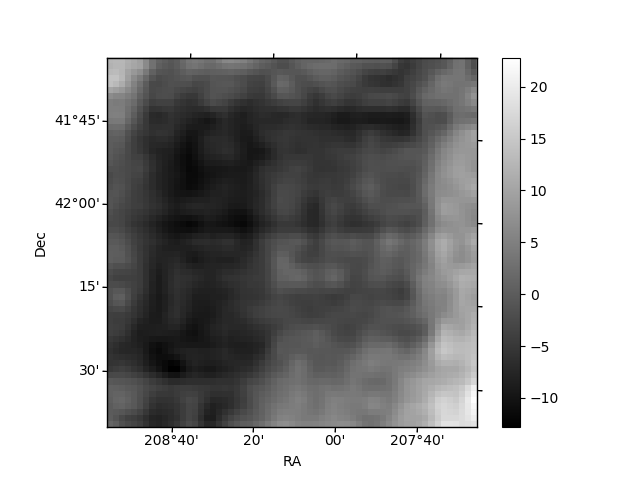
Histogram calculated using DETX and DETY for each event in the final _common_clean file
| Quadrant A | 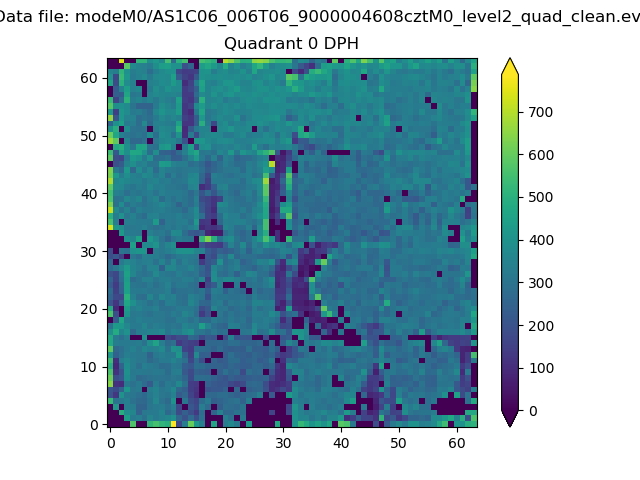 |
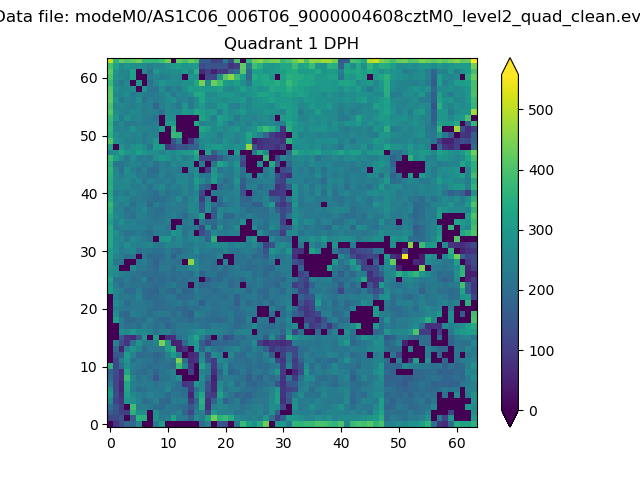 |
Quadrant B |
|---|---|---|---|
| Quadrant D | 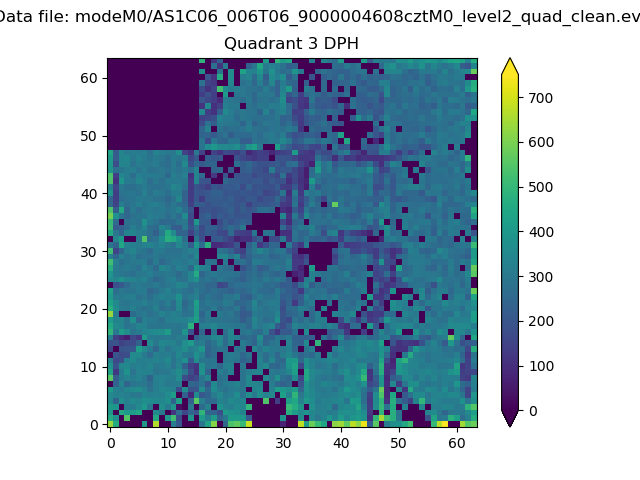 |
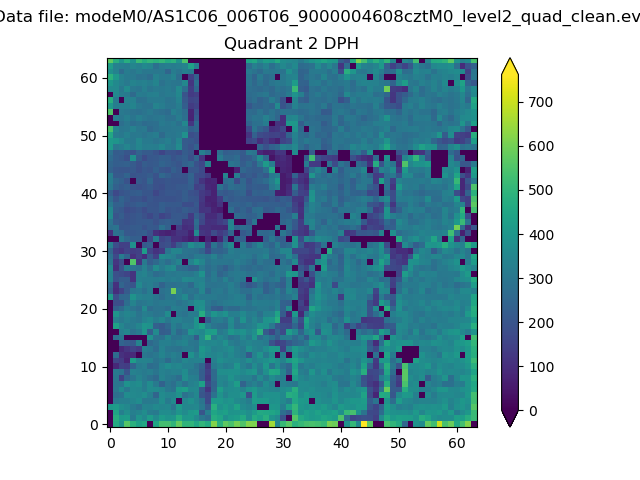 |
Quadrant C |
| Plot type | Count rate plots | Images |
|---|---|---|
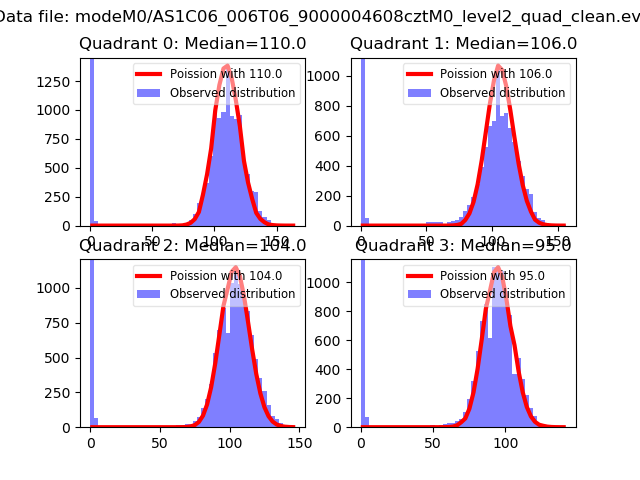
| Comparison with Poisson distribution Blue bars denote a histogram of data divided into 1 sec bins. Red curve is a Poisson curve with rate = median count rate of data. |
 |
 |
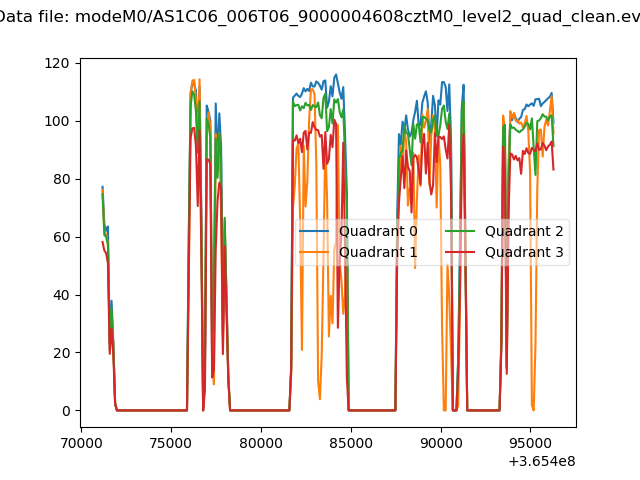
| Quadrant-wise count rates Data is divided into 100 sec bins |
 |
|
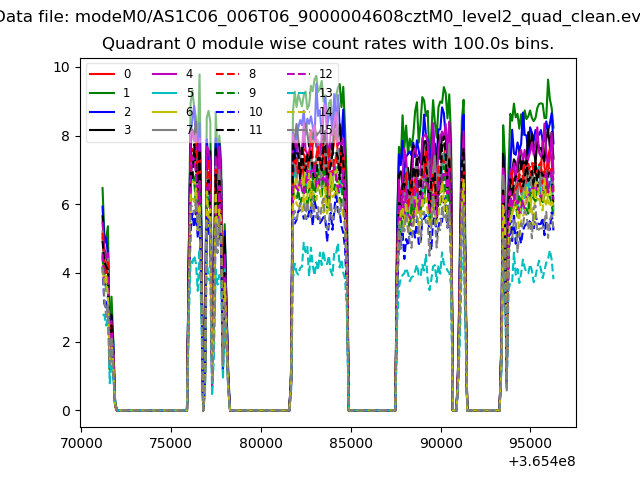
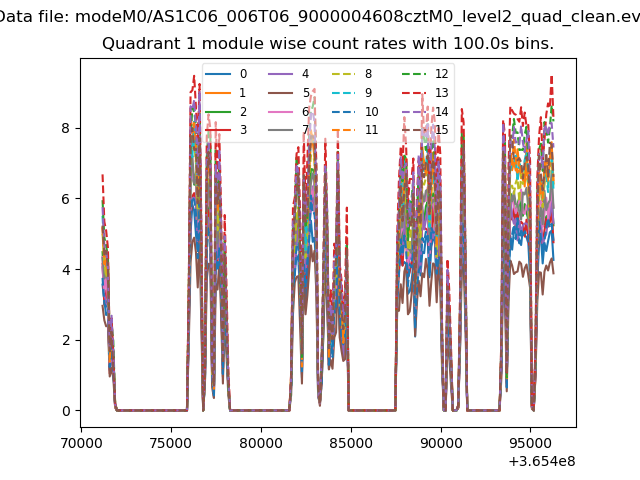
| Module-wise count rates for Quadrant A Data is divided into 100 sec bins |
 |
 |
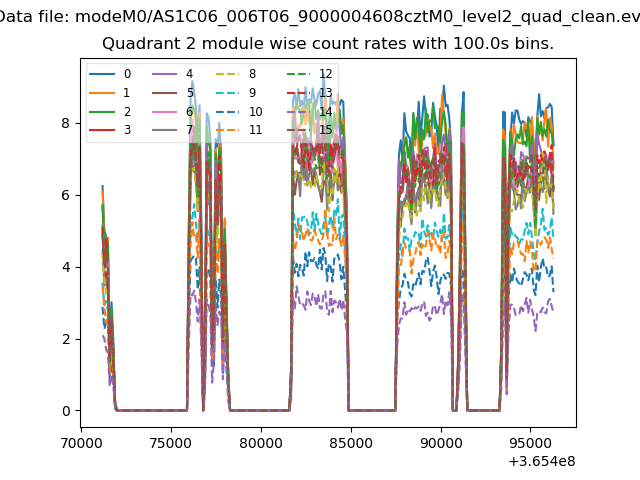
| Module-wise count rates for Quadrant B Data is divided into 100 sec bins |
 |
 |
| Module-wise count rates for Quadrant C Data is divided into 100 sec bins |
 |
 |
| Module-wise count rates for Quadrant D Data is divided into 100 sec bins |
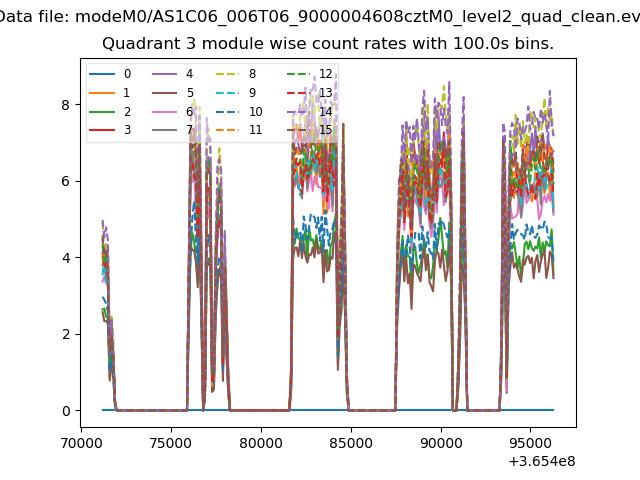 |
 |
| Parameter | Plot |
|---|---|
| CZT HV Monitor | 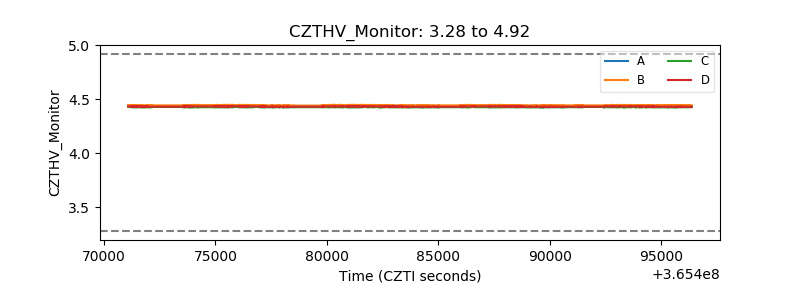 |
| D_VDD | 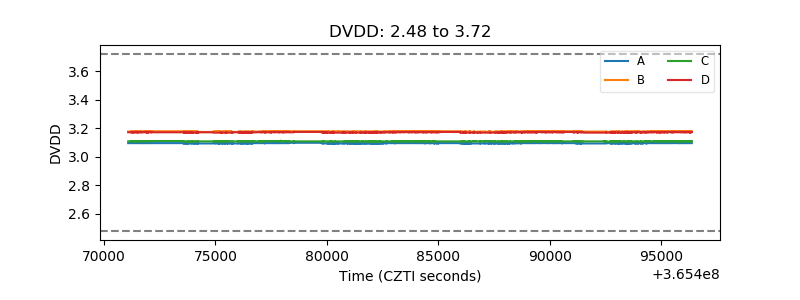 |
| Temperature 1 | 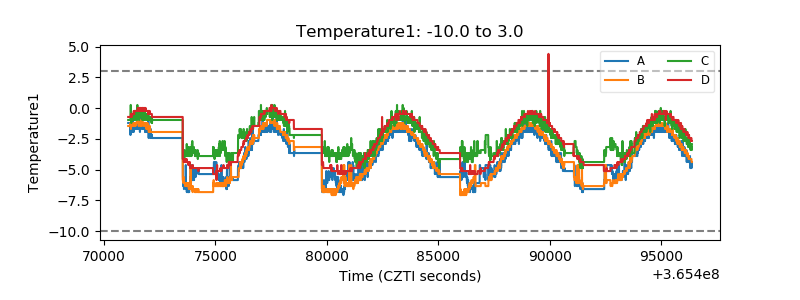 |
| Veto HV Monitor | 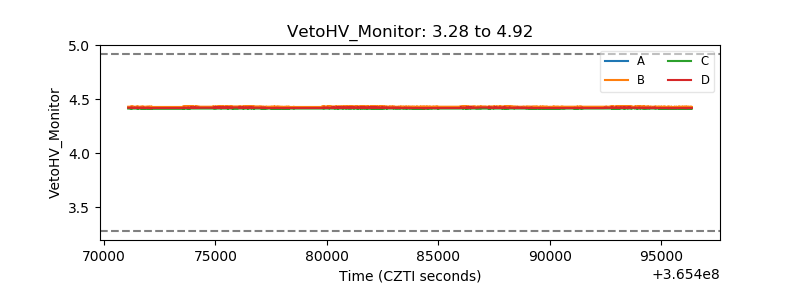 |
| Veto LLD | 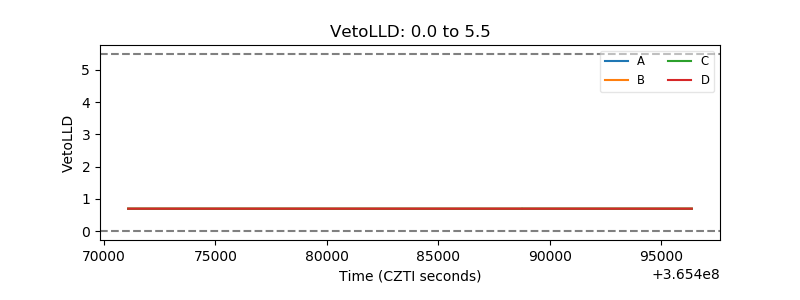 |
| Alpha Counter | 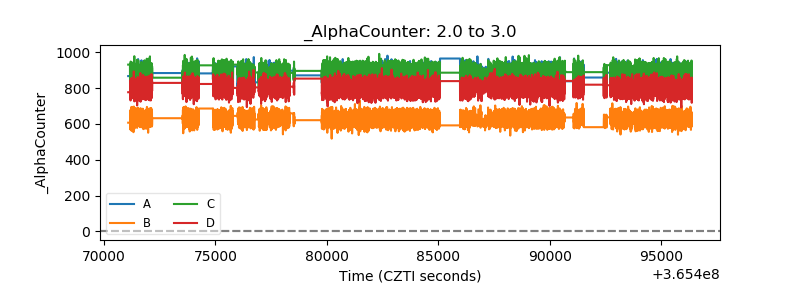 |
| _CPM_Rate | 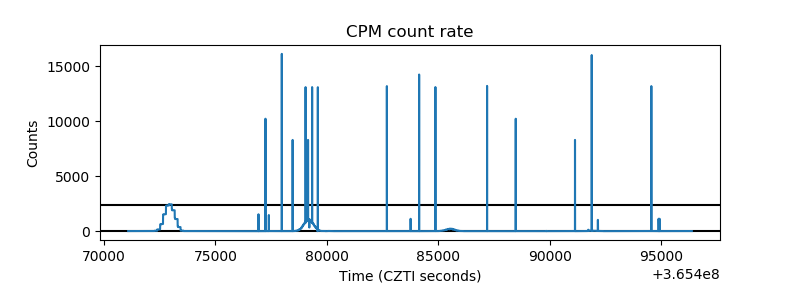 |
| CZT Counter | 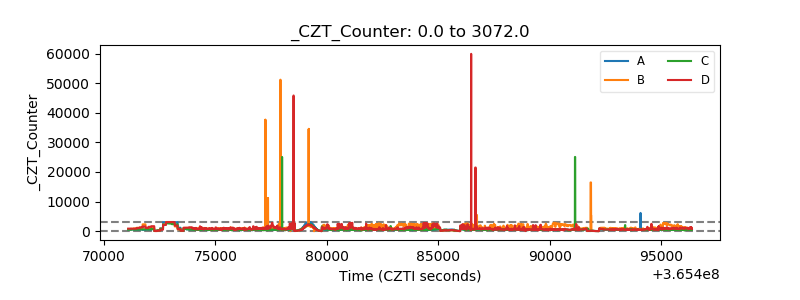 |
| +2.5 Volts monitor | 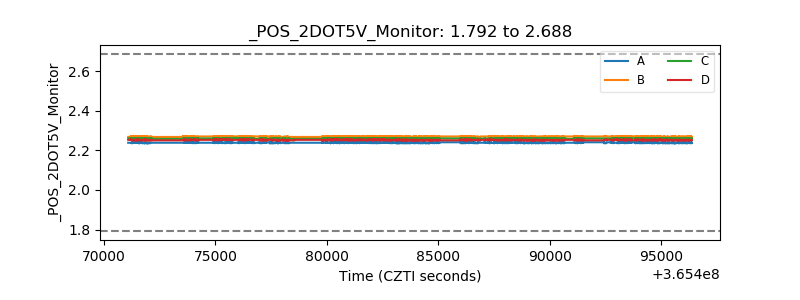 |
| +5 Volts monitor | 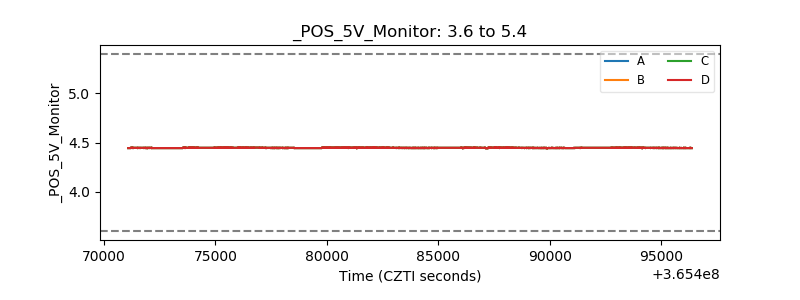 |
| _ROLL_ROT | 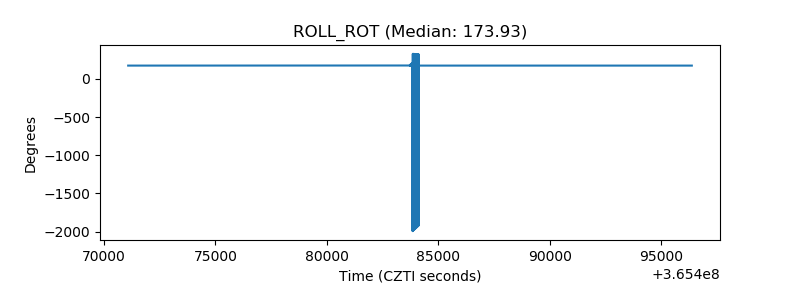 |
| _Roll_DEC | 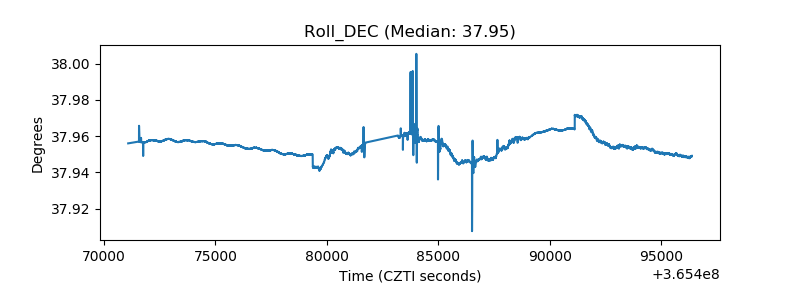 |
| _Roll_RA | 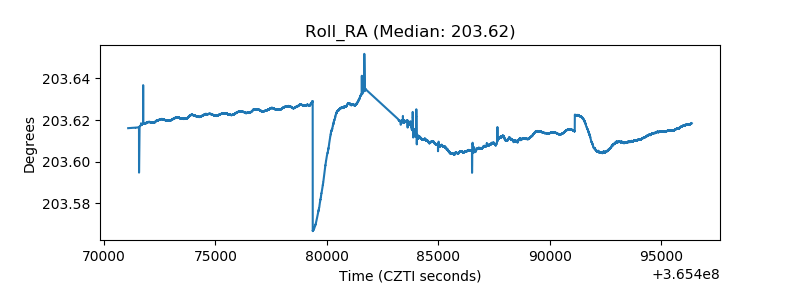 |
| Veto Counter | 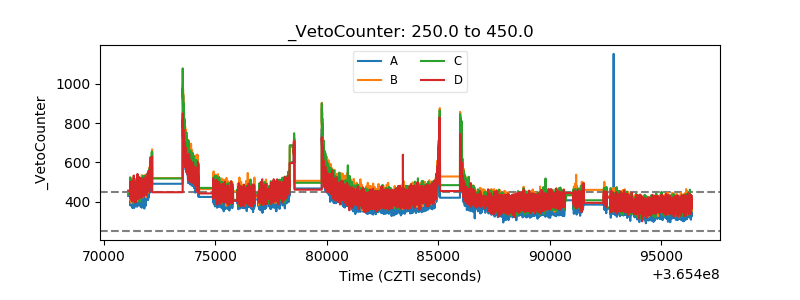 |