| Param | Original file | Final file |
|---|---|---|
| Filename | modeM0/AS1C06_006T06_9000004608_31586cztM0_level2.evt | modeM0/AS1C06_006T06_9000004608_31586cztM0_level2_quad_clean.evt |
| Size (bytes) | 605,485,440 | 61,914,240 |
| Size | 577.4 MB | 59.0 MB |
| Events in quadrant A | 3,025,624 | 377,667 |
| Events in quadrant B | 5,749,160 | 372,432 |
| Events in quadrant C | 3,162,960 | 363,607 |
| Events in quadrant D | 5,993,688 | 341,072 |
| Mode M9 | |||
|---|---|---|---|
| Quadrant | BADHDUFLAG | Total packets | Discarded packets |
| A | 0 | 13 | 0 |
| B | 0 | 13 | 0 |
| C | 0 | 13 | 0 |
| D | 0 | 13 | 0 |
| Mode M0 | |||
|---|---|---|---|
| Quadrant | BADHDUFLAG | Total packets | Discarded packets |
| A | 0 | 12445 | 1 |
| B | 0 | 21091 | 1 |
| C | 0 | 12847 | 1 |
| D | 0 | 22235 | 1 |
| Mode SS | |||
|---|---|---|---|
| Quadrant | BADHDUFLAG | Total packets | Discarded packets |
| A | 0 | 122 | 0 |
| B | 0 | 122 | 0 |
| C | 0 | 122 | 0 |
| D | 0 | 122 | 0 |
| Quadrant | Total seconds | Saturated seconds | Saturation percentage |
|---|---|---|---|
| A | 6008 | 53 | 0.882157% |
| B | 6009 | 402 | 6.689965% |
| C | 6009 | 92 | 1.531037% |
| D | 6009 | 448 | 7.455483% |
Noise dominated data is calculated using 1-second bins in cleaned event files. If a bin has >2000 counts, and if more than 50% of those come from <1% of pixels, then it is considered to be noise-dominated and hence unusable.
| Quadrant | # 1 sec bins | Bins with >0 counts | Bins with >2000 counts | High rate bins dominated by noise | Noise dominated (total time) | Noise dominated (detector-on time) | Marked lightcurve |
|---|---|---|---|---|---|---|---|
| A | 7238 | 6008 | 0 | 0 | 0.00% | 0.00% | 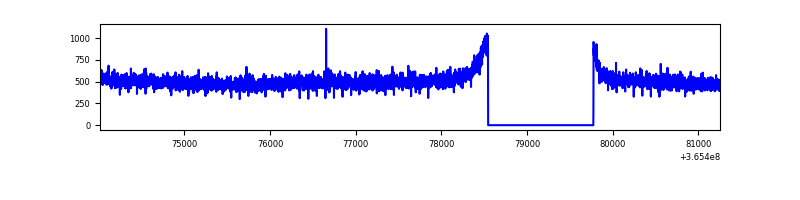 |
| B | 7239 | 6009 | 110 | 110 | 1.52% | 1.83% | 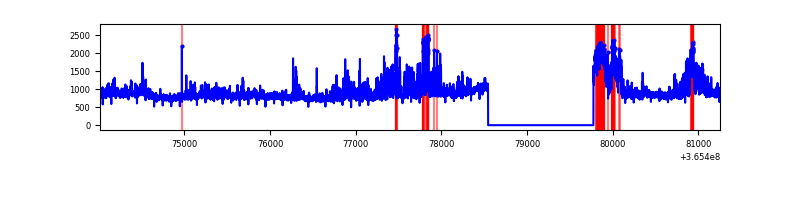 |
| C | 7239 | 6009 | 1 | 1 | 0.01% | 0.02% | 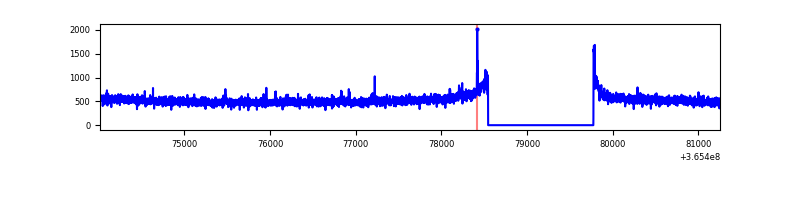 |
| D | 7239 | 6010 | 405 | 405 | 5.59% | 6.74% | 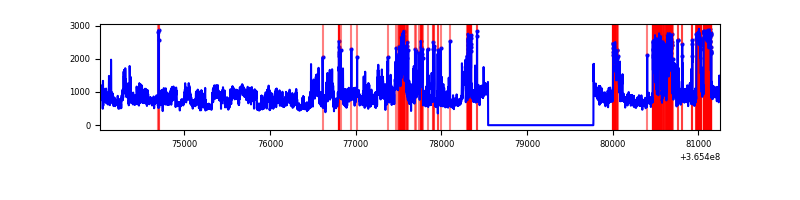 |
Top three noisy pixels from each quadrant. If the there are fewer than three noisy pixels in the level2.evt file, extra rows are filled as -1
| Pixel properties | Quadrant properties | ||||||
|---|---|---|---|---|---|---|---|
| Quadrant | DetID | PixID | Counts | Sigma | Mean | Median | Sigma |
| A | 13 | 254 | 10879 | 64.66 | 784 | 771 | 156.3 |
| A | 3 | 137 | 7492 | 42.99 | 784 | 771 | 156.3 |
| A | 0 | 226 | 6679 | 37.79 | 784 | 771 | 156.3 |
| B | 6 | 159 | 1698950 | 11916.17 | 759 | 742 | 142.5 |
| B | 12 | 1 | 498276 | 3491.15 | 759 | 742 | 142.5 |
| B | 4 | 80 | 377768 | 2645.56 | 759 | 742 | 142.5 |
| C | 14 | 238 | 121898 | 697.12 | 747 | 751 | 173.8 |
| C | 4 | 175 | 48994 | 277.61 | 747 | 751 | 173.8 |
| C | 3 | 233 | 39194 | 221.21 | 747 | 751 | 173.8 |
| D | 8 | 195 | 1772794 | 10438.12 | 722 | 705 | 169.8 |
| D | 7 | 223 | 477946 | 2811.09 | 722 | 705 | 169.8 |
| D | 12 | 218 | 403110 | 2370.28 | 722 | 705 | 169.8 |
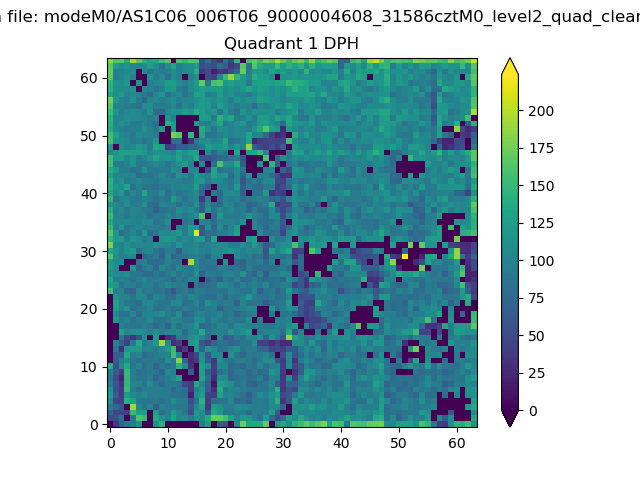
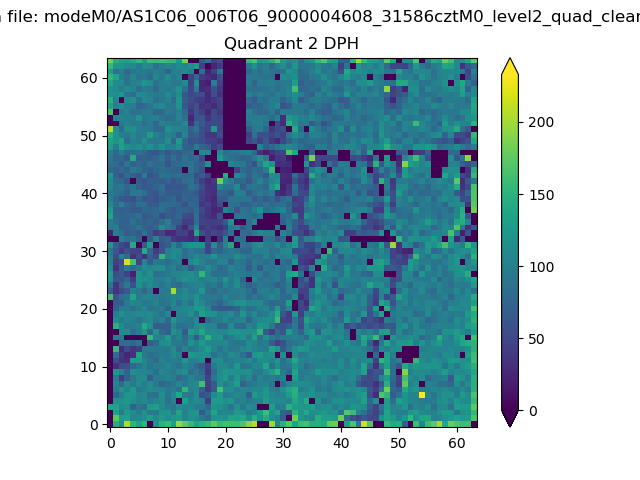
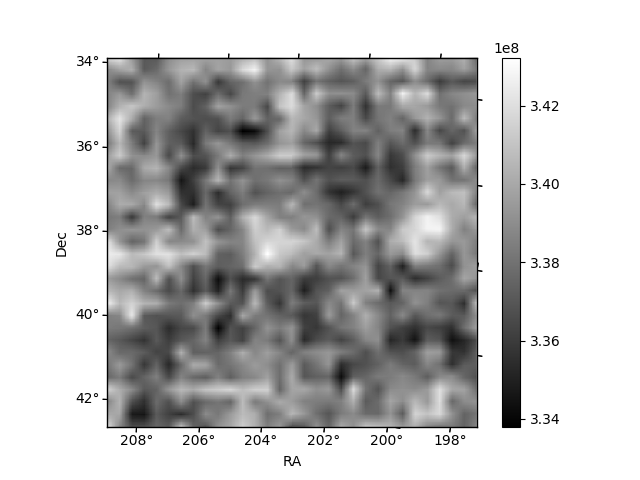
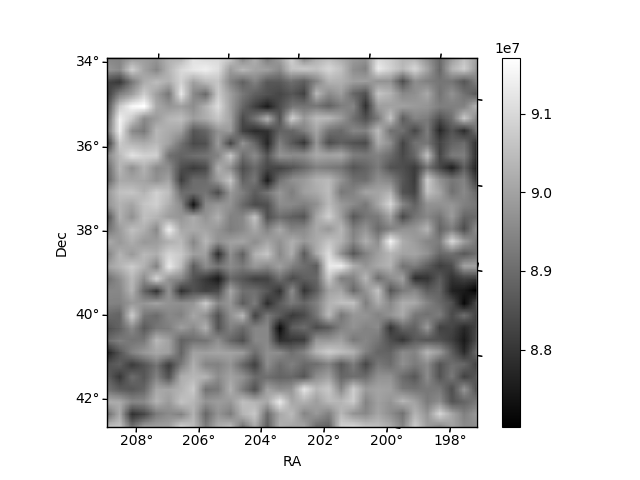
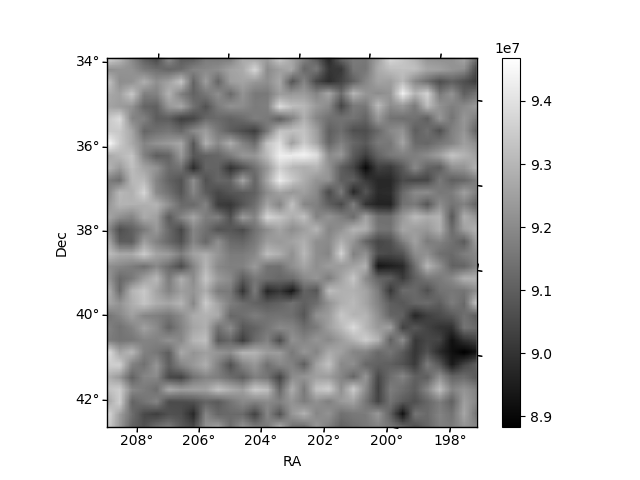
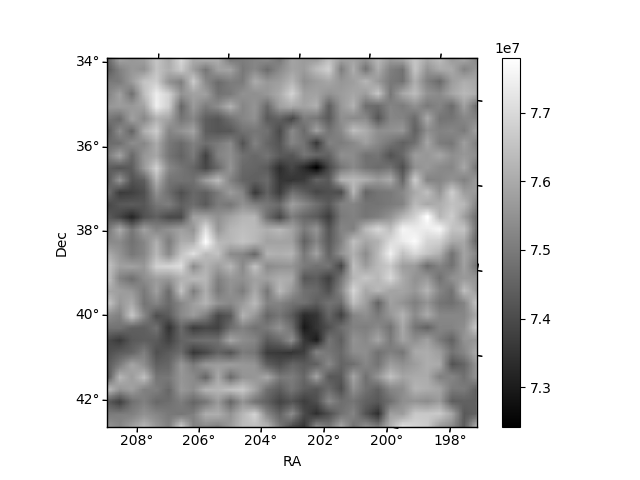
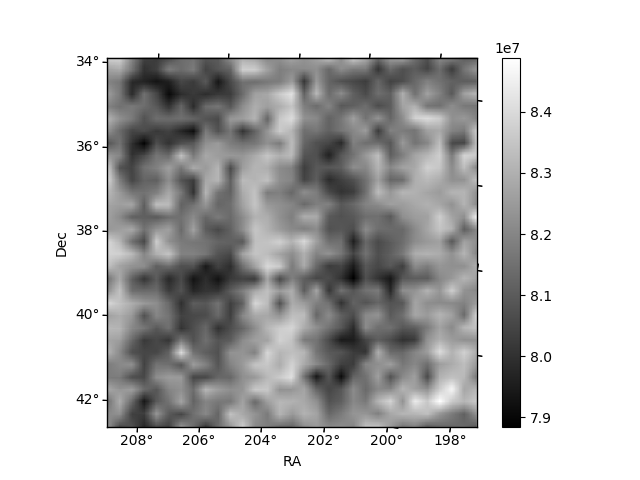
Histogram calculated using DETX and DETY for each event in the final _common_clean file
| Quadrant A |  |
 |
Quadrant B |
|---|---|---|---|
| Quadrant D | 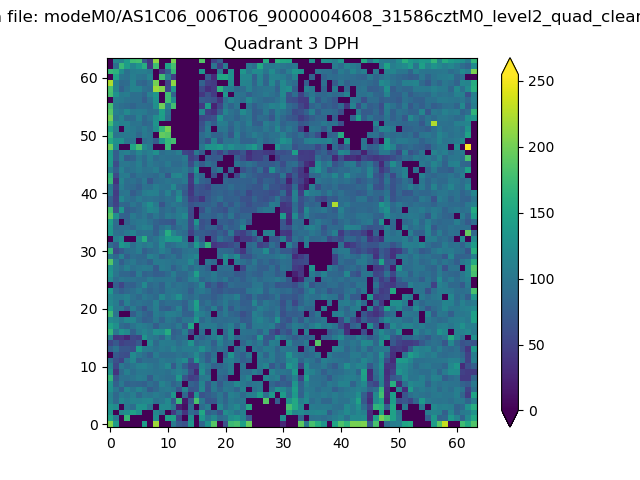 |
 |
Quadrant C |
| Plot type | Count rate plots | Images |
|---|---|---|
| Comparison with Poisson distribution Blue bars denote a histogram of data divided into 1 sec bins. Red curve is a Poisson curve with rate = median count rate of data. |
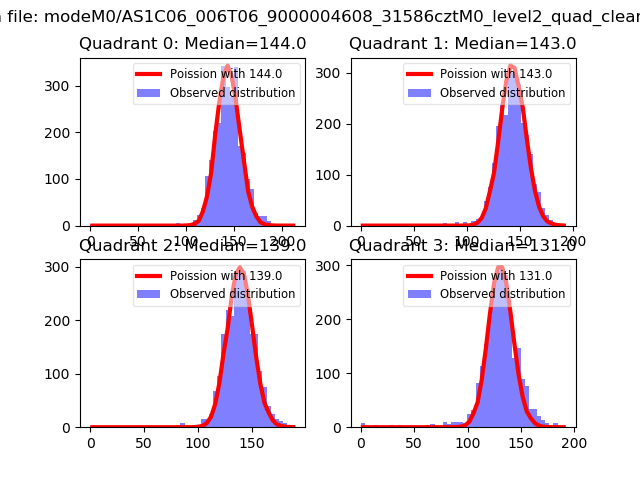 |
 |
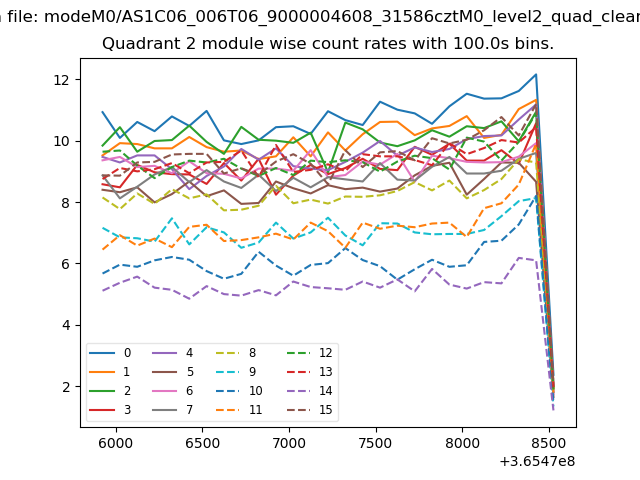
| Quadrant-wise count rates Data is divided into 100 sec bins |
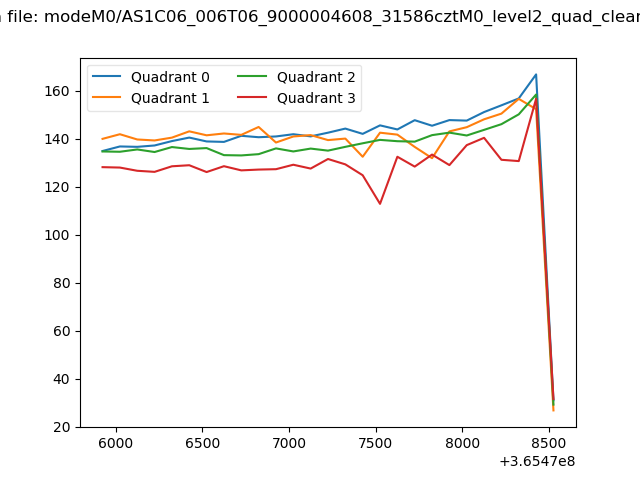 |
|
| Module-wise count rates for Quadrant A Data is divided into 100 sec bins |
 |
 |
| Module-wise count rates for Quadrant B Data is divided into 100 sec bins |
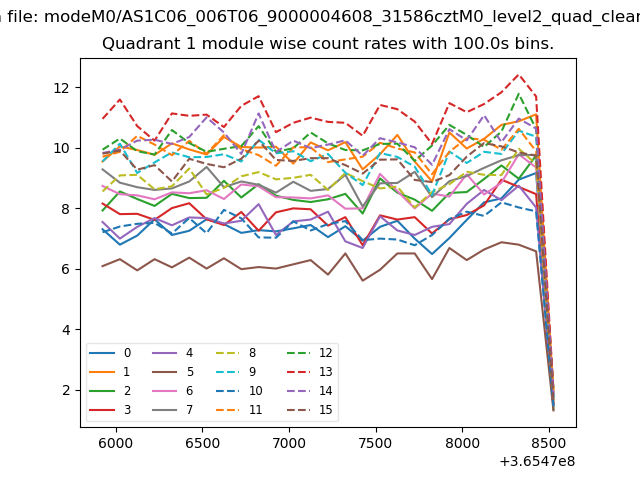 |
 |
| Module-wise count rates for Quadrant C Data is divided into 100 sec bins |
 |
 |
| Module-wise count rates for Quadrant D Data is divided into 100 sec bins |
 |
 |
| Parameter | Plot |
|---|---|
| CZT HV Monitor |  |
| D_VDD | 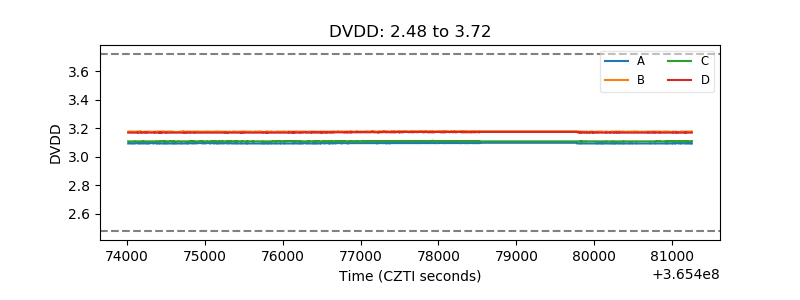 |
| Temperature 1 |  |
| Veto HV Monitor | 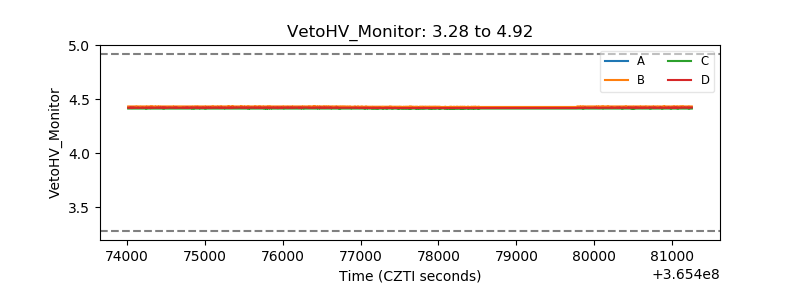 |
| Veto LLD | 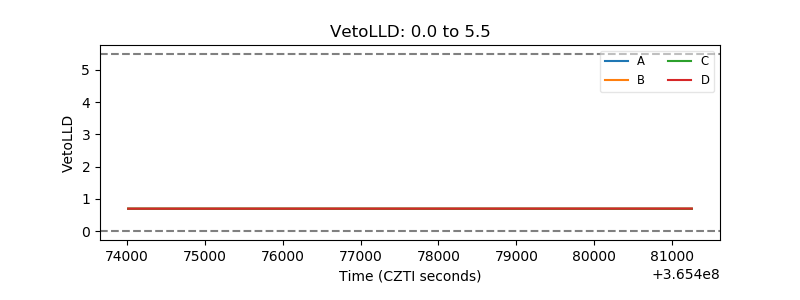 |
| Alpha Counter | 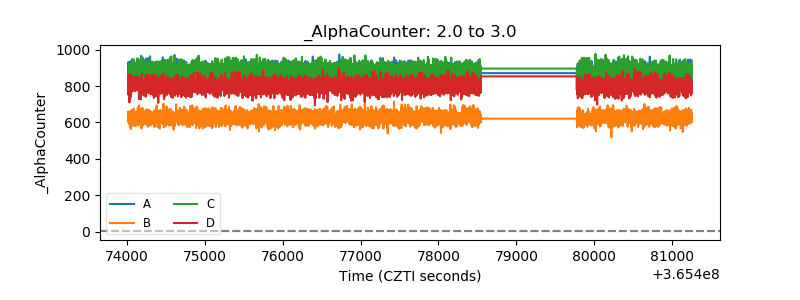 |
| _CPM_Rate | 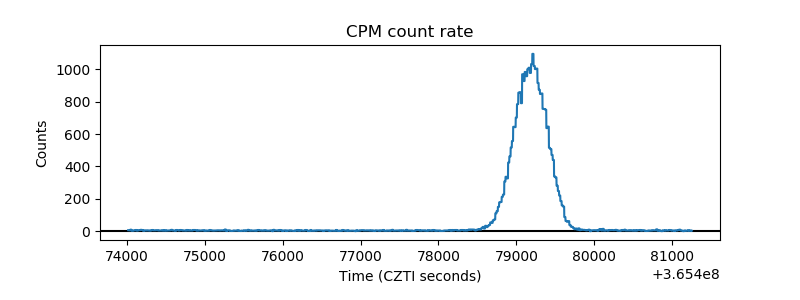 |
| CZT Counter | 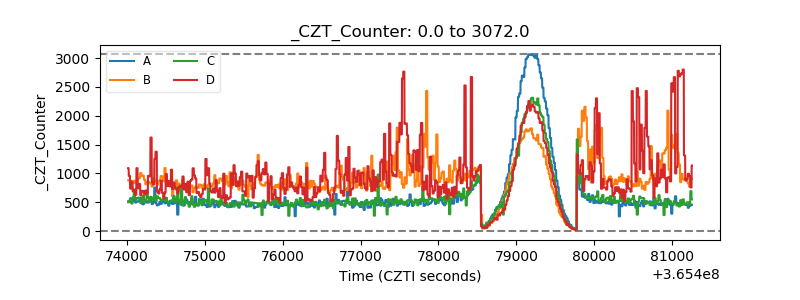 |
| +2.5 Volts monitor | 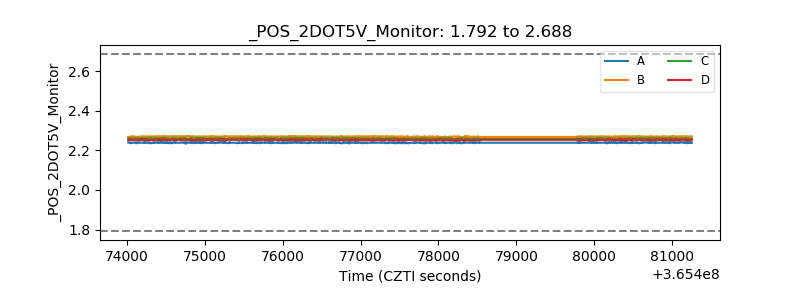 |
| +5 Volts monitor |  |
| _ROLL_ROT |  |
| _Roll_DEC | 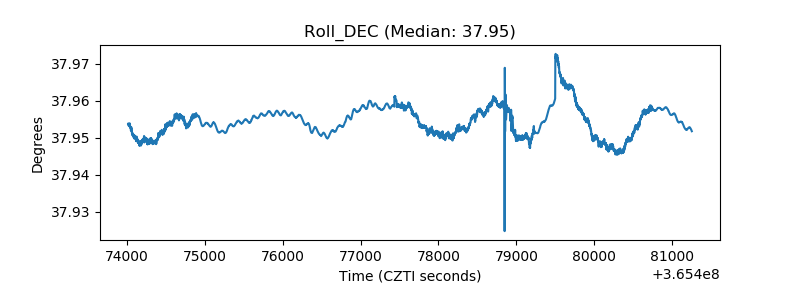 |
| _Roll_RA | 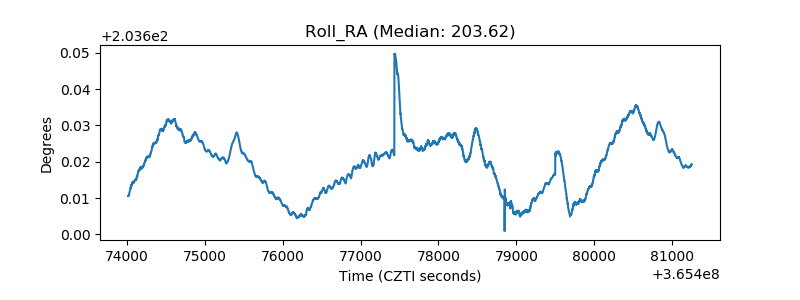 |
| Veto Counter | 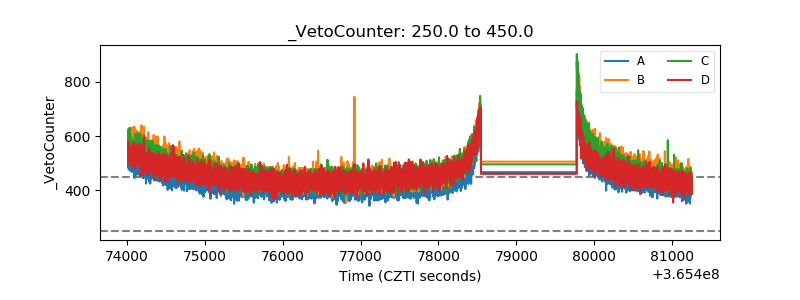 |