| Param | Original file | Final file |
|---|---|---|
| Filename | modeM0/AS1C06_006T06_9000004608_31587cztM0_level2.evt | modeM0/AS1C06_006T06_9000004608_31587cztM0_level2_quad_clean.evt |
| Size (bytes) | 1,185,088,320 | 139,953,600 |
| Size | 1.1 GB | 133.5 MB |
| Events in quadrant A | 5,410,236 | 945,419 |
| Events in quadrant B | 12,891,120 | 821,170 |
| Events in quadrant C | 5,643,582 | 907,647 |
| Events in quadrant D | 11,227,609 | 824,624 |
| Mode M9 | |||
|---|---|---|---|
| Quadrant | BADHDUFLAG | Total packets | Discarded packets |
| A | 0 | 31 | 2 |
| B | 0 | 33 | 5 |
| C | 0 | 32 | 4 |
| D | 0 | 34 | 5 |
| Mode M0 | |||
|---|---|---|---|
| Quadrant | BADHDUFLAG | Total packets | Discarded packets |
| A | 0 | 25414 | 2972 |
| B | 0 | 51320 | 5950 |
| C | 0 | 26167 | 3007 |
| D | 0 | 46339 | 5306 |
| Mode SS | |||
|---|---|---|---|
| Quadrant | BADHDUFLAG | Total packets | Discarded packets |
| A | 0 | 247 | 23 |
| B | 0 | 247 | 31 |
| C | 0 | 249 | 27 |
| D | 0 | 250 | 32 |
| Quadrant | Total seconds | Saturated seconds | Saturation percentage |
|---|---|---|---|
| A | 10745 | 154 | 1.433225% |
| B | 10571 | 2391 | 22.618485% |
| C | 10730 | 247 | 2.301957% |
| D | 10600 | 1117 | 10.537736% |
Noise dominated data is calculated using 1-second bins in cleaned event files. If a bin has >2000 counts, and if more than 50% of those come from <1% of pixels, then it is considered to be noise-dominated and hence unusable.
| Quadrant | # 1 sec bins | Bins with >0 counts | Bins with >2000 counts | High rate bins dominated by noise | Noise dominated (total time) | Noise dominated (detector-on time) | Marked lightcurve |
|---|---|---|---|---|---|---|---|
| A | 16314 | 10939 | 0 | 0 | 0.00% | 0.00% | 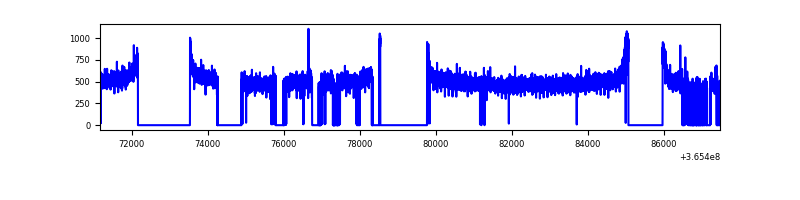 |
| B | 16311 | 10750 | 1496 | 1496 | 9.17% | 13.92% | 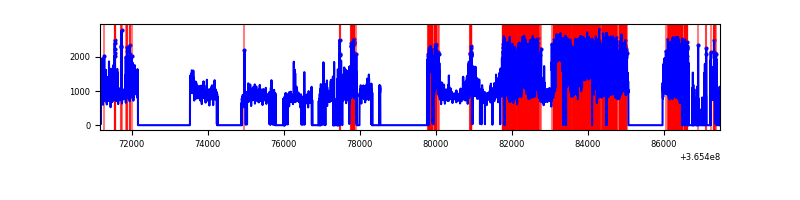 |
| C | 16319 | 10920 | 4 | 4 | 0.02% | 0.04% | 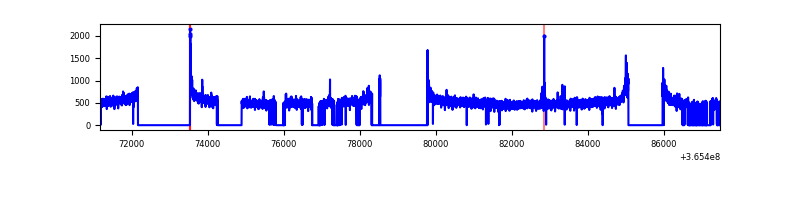 |
| D | 16308 | 10804 | 796 | 796 | 4.88% | 7.37% | 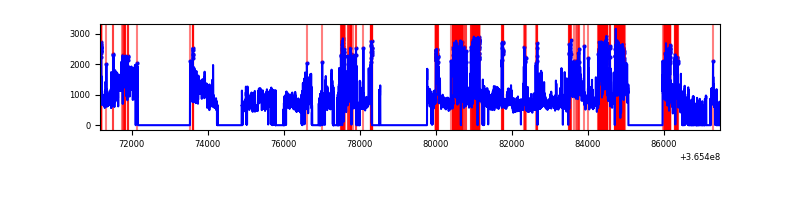 |
Top three noisy pixels from each quadrant. If the there are fewer than three noisy pixels in the level2.evt file, extra rows are filled as -1
| Pixel properties | Quadrant properties | ||||||
|---|---|---|---|---|---|---|---|
| Quadrant | DetID | PixID | Counts | Sigma | Mean | Median | Sigma |
| A | 13 | 254 | 18810 | 62.52 | 1403 | 1375 | 278.8 |
| A | 3 | 137 | 13585 | 43.79 | 1403 | 1375 | 278.8 |
| A | 0 | 226 | 11839 | 37.52 | 1403 | 1375 | 278.8 |
| B | 12 | 1 | 4057304 | 17368.86 | 1249 | 1218 | 233.5 |
| B | 6 | 159 | 2731674 | 11692.28 | 1249 | 1218 | 233.5 |
| B | 4 | 80 | 584367 | 2497.14 | 1249 | 1218 | 233.5 |
| C | 14 | 238 | 216078 | 696.52 | 1334 | 1347 | 308.3 |
| C | 4 | 175 | 80266 | 255.99 | 1334 | 1347 | 308.3 |
| C | 3 | 233 | 59740 | 189.41 | 1334 | 1347 | 308.3 |
| D | 8 | 195 | 3465412 | 11607.3 | 1269 | 1238 | 298.4 |
| D | 12 | 218 | 1113016 | 3725.2 | 1269 | 1238 | 298.4 |
| D | 7 | 223 | 580799 | 1941.92 | 1269 | 1238 | 298.4 |
Histogram calculated using DETX and DETY for each event in the final _common_clean file
| Quadrant A |  |
 |
Quadrant B |
|---|---|---|---|
| Quadrant D |  |
 |
Quadrant C |
| Plot type | Count rate plots | Images |
|---|---|---|
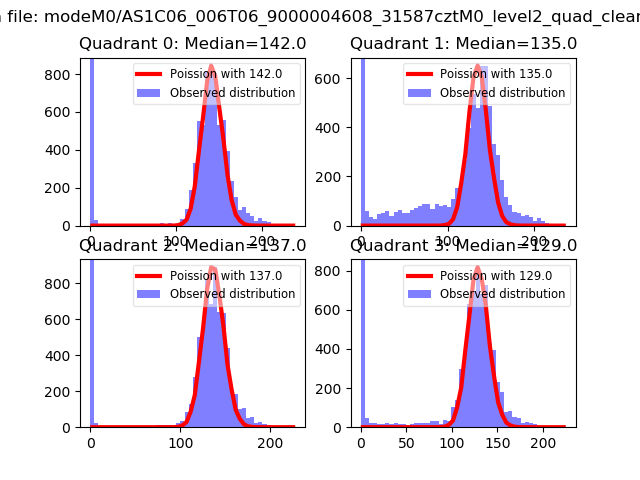
| Comparison with Poisson distribution Blue bars denote a histogram of data divided into 1 sec bins. Red curve is a Poisson curve with rate = median count rate of data. |
 |
 |
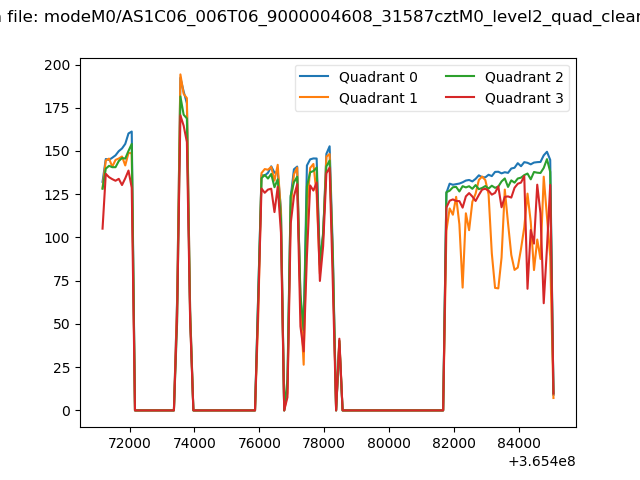
| Quadrant-wise count rates Data is divided into 100 sec bins |
 |
|
| Module-wise count rates for Quadrant A Data is divided into 100 sec bins |
 |
 |
| Module-wise count rates for Quadrant B Data is divided into 100 sec bins |
 |
 |
| Module-wise count rates for Quadrant C Data is divided into 100 sec bins |
 |
 |
| Module-wise count rates for Quadrant D Data is divided into 100 sec bins |
 |
 |
| Parameter | Plot |
|---|---|
| CZT HV Monitor |  |
| D_VDD | 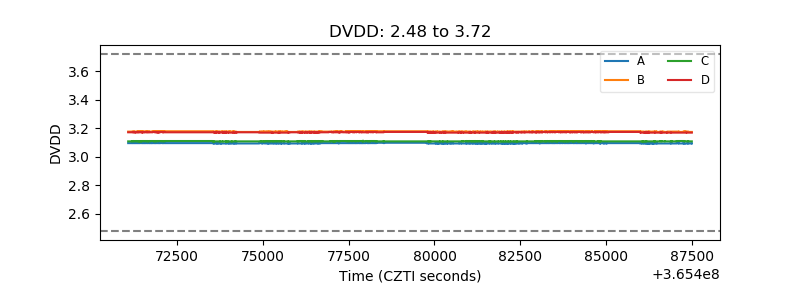 |
| Temperature 1 |  |
| Veto HV Monitor |  |
| Veto LLD |  |
| Alpha Counter |  |
| _CPM_Rate | 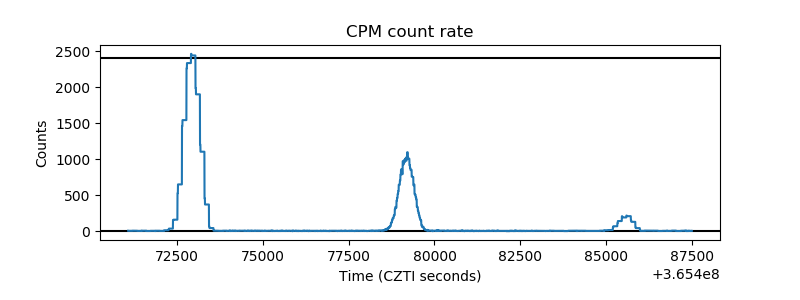 |
| CZT Counter |  |
| +2.5 Volts monitor |  |
| +5 Volts monitor |  |
| _ROLL_ROT |  |
| _Roll_DEC |  |
| _Roll_RA |  |
| Veto Counter |  |