| Param | Original file | Final file |
|---|---|---|
| Filename | modeM0/AS1C06_006T06_9000004608_31588cztM0_level2.evt | modeM0/AS1C06_006T06_9000004608_31588cztM0_level2_quad_clean.evt |
| Size (bytes) | 1,098,334,080 | 113,800,320 |
| Size | 1.0 GB | 108.5 MB |
| Events in quadrant A | 5,315,257 | 740,723 |
| Events in quadrant B | 12,345,336 | 588,042 |
| Events in quadrant C | 5,498,041 | 710,450 |
| Events in quadrant D | 9,370,535 | 652,074 |
| Mode M9 | |||
|---|---|---|---|
| Quadrant | BADHDUFLAG | Total packets | Discarded packets |
| A | 0 | 42 | 25 |
| B | 0 | 46 | 31 |
| C | 0 | 30 | 14 |
| D | 0 | 49 | 30 |
| Mode M0 | |||
|---|---|---|---|
| Quadrant | BADHDUFLAG | Total packets | Discarded packets |
| A | 0 | 27282 | 4795 |
| B | 0 | 55478 | 11712 |
| C | 0 | 27752 | 4846 |
| D | 0 | 43518 | 8270 |
| Mode SS | |||
|---|---|---|---|
| Quadrant | BADHDUFLAG | Total packets | Discarded packets |
| A | 0 | 281 | 57 |
| B | 0 | 272 | 44 |
| C | 0 | 291 | 58 |
| D | 0 | 283 | 55 |
| Quadrant | Total seconds | Saturated seconds | Saturation percentage |
|---|---|---|---|
| A | 11006 | 14 | 0.127203% |
| B | 10614 | 1791 | 16.873940% |
| C | 11017 | 82 | 0.744304% |
| D | 10813 | 527 | 4.873763% |
Noise dominated data is calculated using 1-second bins in cleaned event files. If a bin has >2000 counts, and if more than 50% of those come from <1% of pixels, then it is considered to be noise-dominated and hence unusable.
| Quadrant | # 1 sec bins | Bins with >0 counts | Bins with >2000 counts | High rate bins dominated by noise | Noise dominated (total time) | Noise dominated (detector-on time) | Marked lightcurve |
|---|---|---|---|---|---|---|---|
| A | 23981 | 11424 | 0 | 0 | 0.00% | 0.00% | 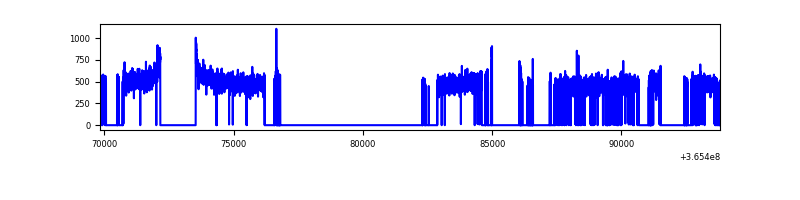 |
| B | 23966 | 11085 | 1414 | 1414 | 5.90% | 12.76% | 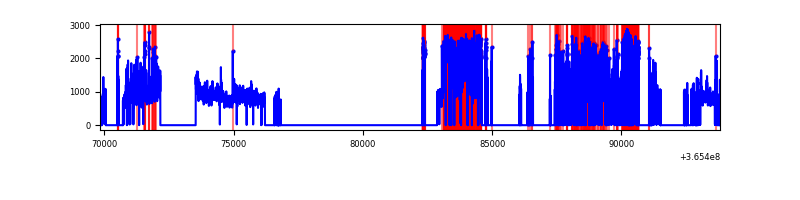 |
| C | 23979 | 11415 | 4 | 4 | 0.02% | 0.04% | 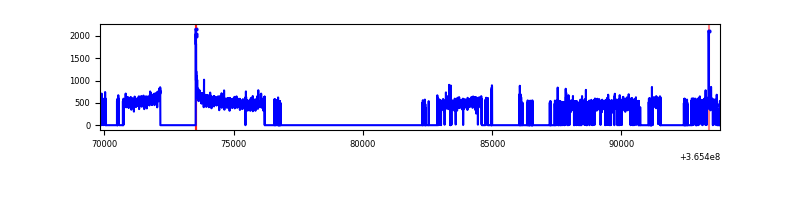 |
| D | 23965 | 11237 | 379 | 379 | 1.58% | 3.37% | 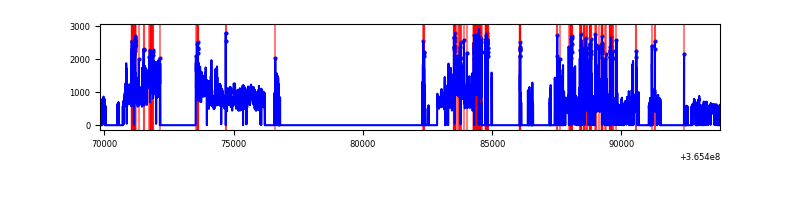 |
Top three noisy pixels from each quadrant. If the there are fewer than three noisy pixels in the level2.evt file, extra rows are filled as -1
| Pixel properties | Quadrant properties | ||||||
|---|---|---|---|---|---|---|---|
| Quadrant | DetID | PixID | Counts | Sigma | Mean | Median | Sigma |
| A | 13 | 254 | 19954 | 67.79 | 1378 | 1352 | 274.4 |
| A | 3 | 137 | 13260 | 43.39 | 1378 | 1352 | 274.4 |
| A | 0 | 226 | 11878 | 38.36 | 1378 | 1352 | 274.4 |
| B | 12 | 1 | 3763964 | 16515.63 | 1226 | 1199 | 227.8 |
| B | 6 | 159 | 2789408 | 12238.08 | 1226 | 1199 | 227.8 |
| B | 4 | 80 | 565604 | 2477.3 | 1226 | 1199 | 227.8 |
| C | 14 | 238 | 215078 | 699.72 | 1317 | 1328 | 305.5 |
| C | 4 | 175 | 50583 | 161.24 | 1317 | 1328 | 305.5 |
| C | 3 | 233 | 35925 | 113.25 | 1317 | 1328 | 305.5 |
| D | 8 | 195 | 2706367 | 9024.9 | 1279 | 1247 | 299.7 |
| D | 12 | 218 | 713034 | 2374.68 | 1279 | 1247 | 299.7 |
| D | 2 | 250 | 364147 | 1210.72 | 1279 | 1247 | 299.7 |
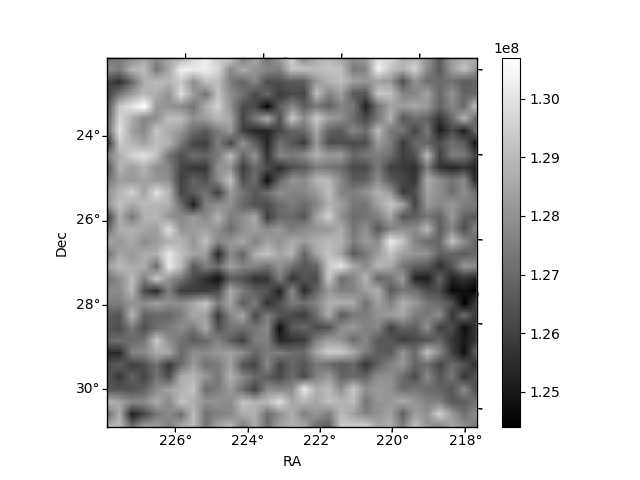
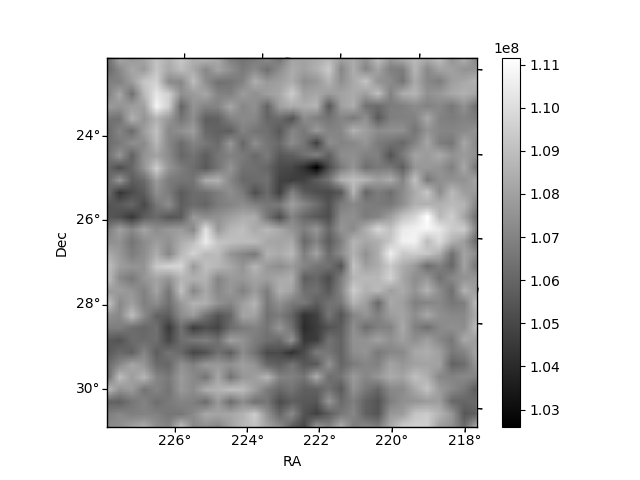
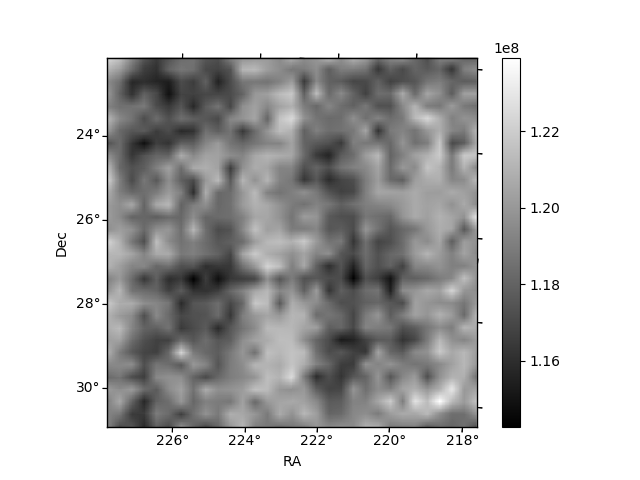
Histogram calculated using DETX and DETY for each event in the final _common_clean file
| Quadrant A | 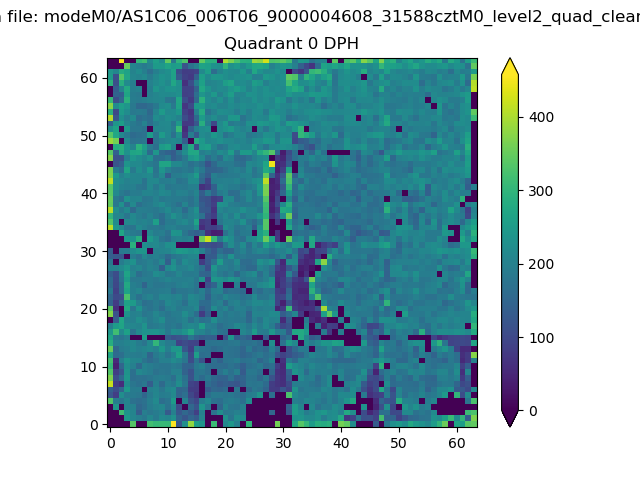 |
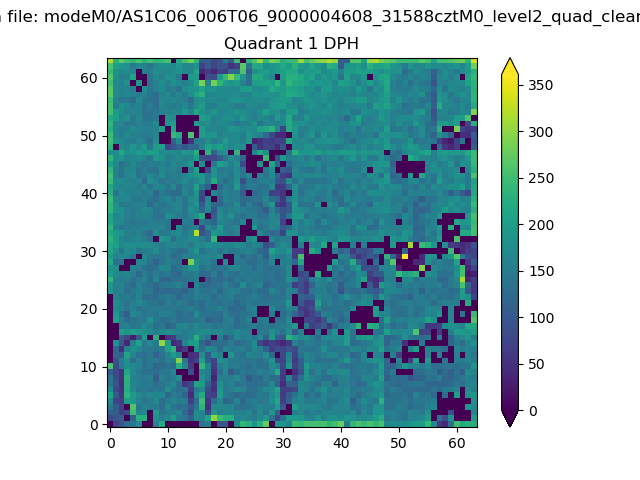 |
Quadrant B |
|---|---|---|---|
| Quadrant D |  |
 |
Quadrant C |
| Plot type | Count rate plots | Images |
|---|---|---|
| Comparison with Poisson distribution Blue bars denote a histogram of data divided into 1 sec bins. Red curve is a Poisson curve with rate = median count rate of data. |
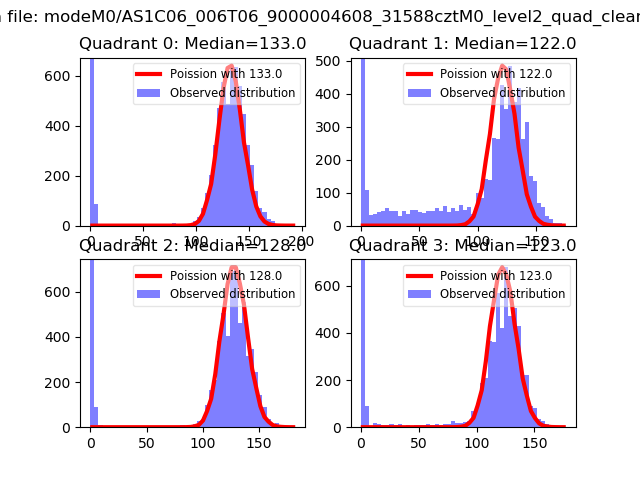 |
 |
| Quadrant-wise count rates Data is divided into 100 sec bins |
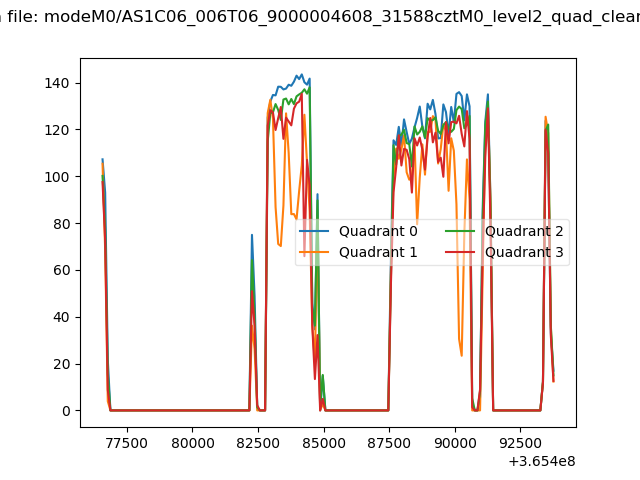 |
|
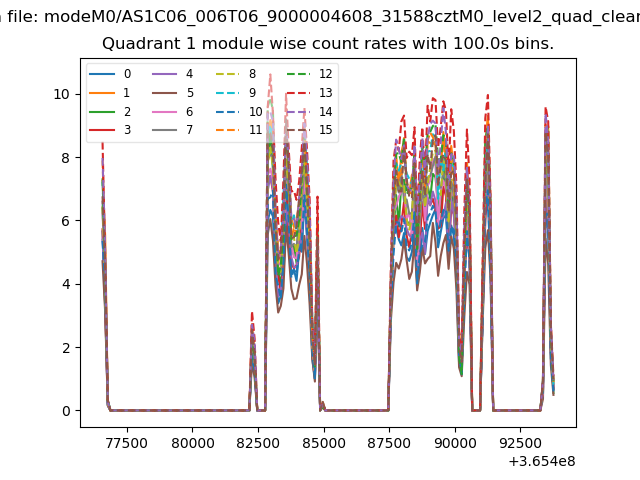
| Module-wise count rates for Quadrant A Data is divided into 100 sec bins |
 |
 |
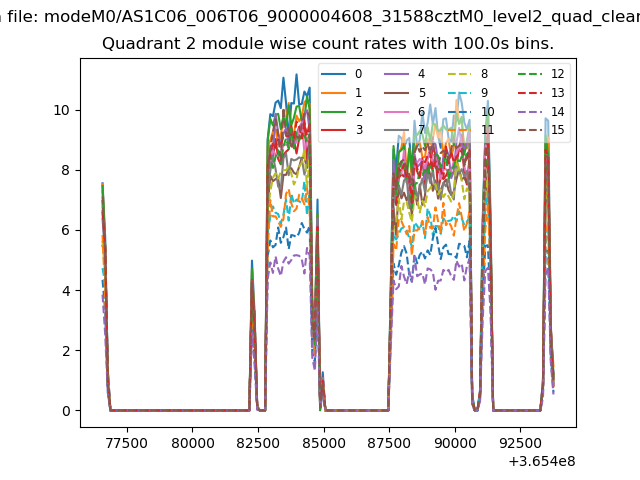
| Module-wise count rates for Quadrant B Data is divided into 100 sec bins |
 |
 |
| Module-wise count rates for Quadrant C Data is divided into 100 sec bins |
 |
 |
| Module-wise count rates for Quadrant D Data is divided into 100 sec bins |
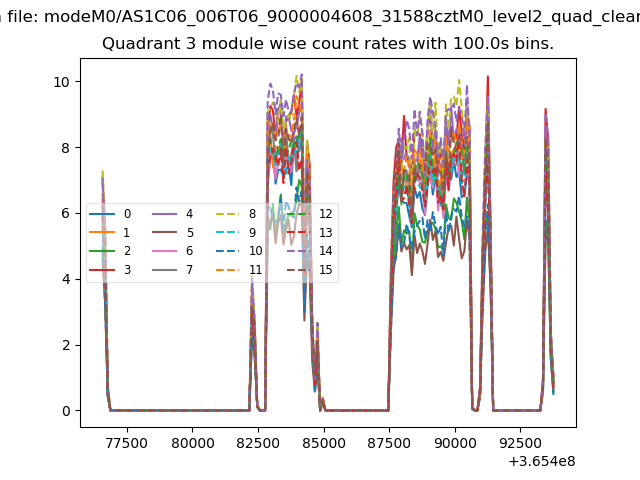 |
 |
| Parameter | Plot |
|---|---|
| CZT HV Monitor | 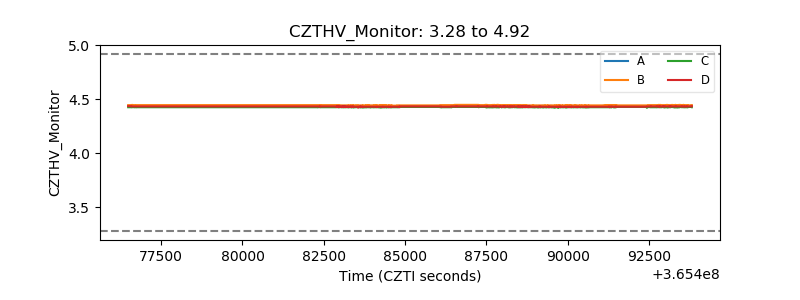 |
| D_VDD | 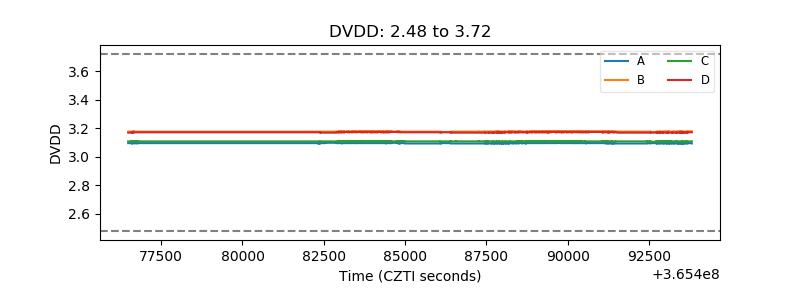 |
| Temperature 1 | 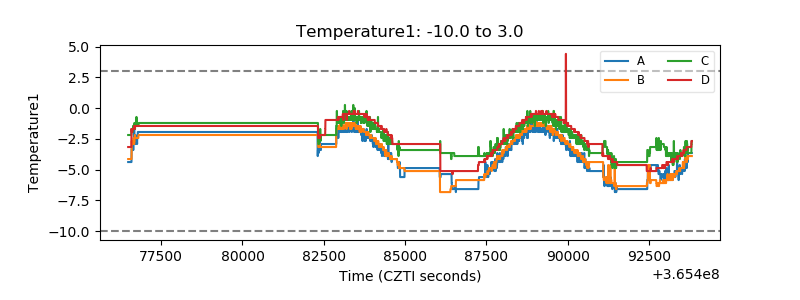 |
| Veto HV Monitor | 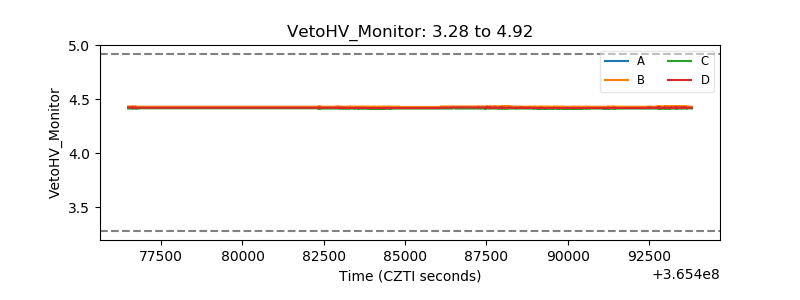 |
| Veto LLD | 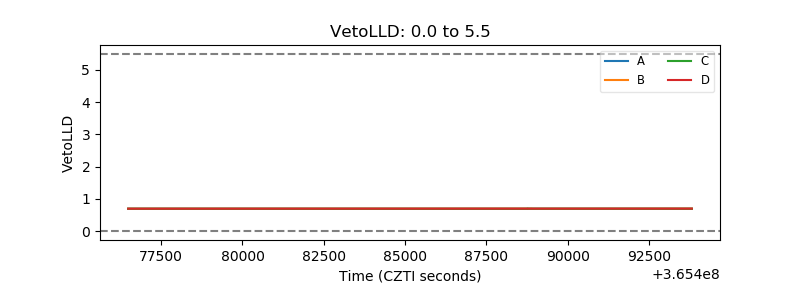 |
| Alpha Counter | 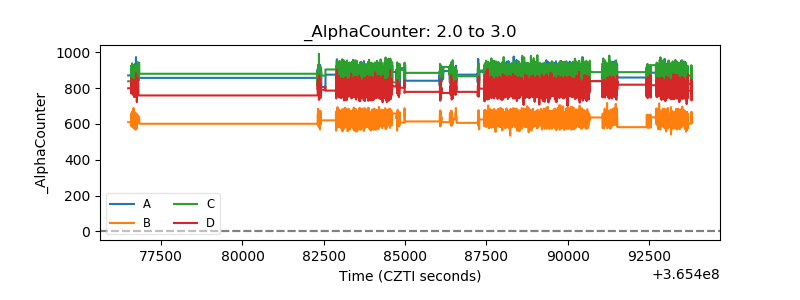 |
| _CPM_Rate | 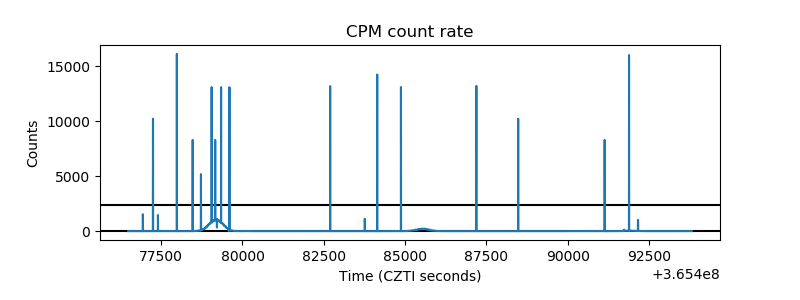 |
| CZT Counter |  |
| +2.5 Volts monitor |  |
| +5 Volts monitor | 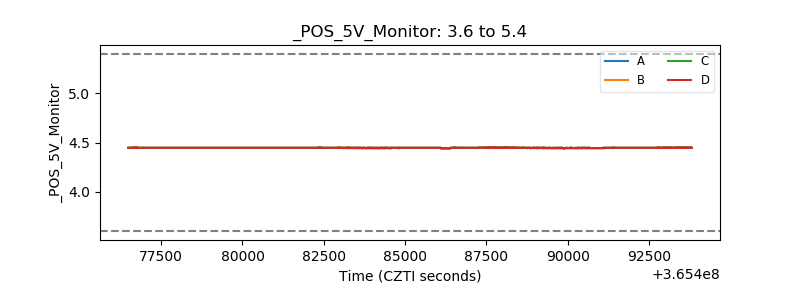 |
| _ROLL_ROT | 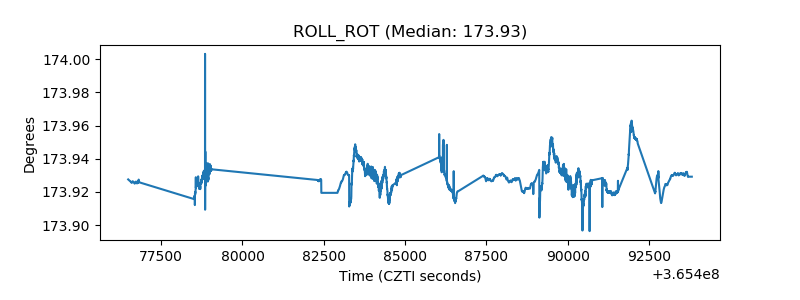 |
| _Roll_DEC | 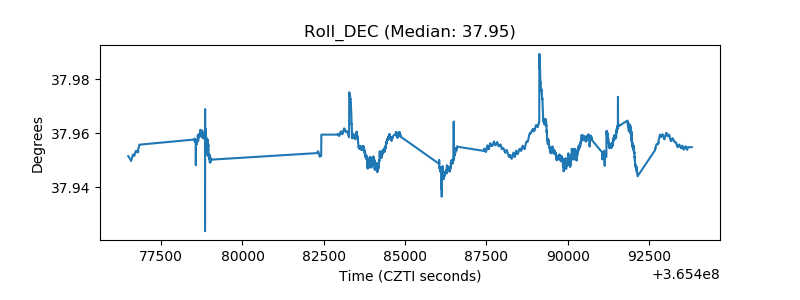 |
| _Roll_RA |  |
| Veto Counter | 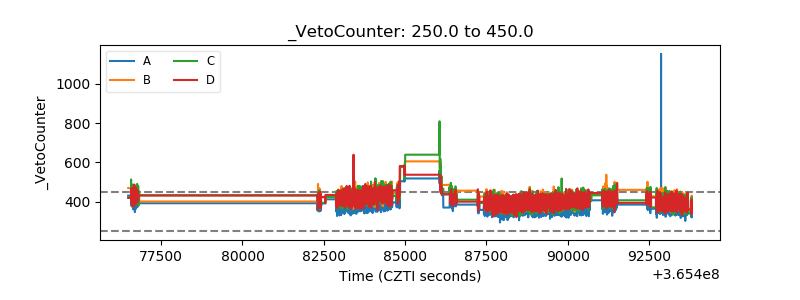 |