| Param | Original file | Final file |
|---|---|---|
| Filename | modeM0/AS1C06_006T06_9000004608_31589cztM0_level2.evt | modeM0/AS1C06_006T06_9000004608_31589cztM0_level2_quad_clean.evt |
| Size (bytes) | 5,472,000 | 1,509,120 |
| Size | 5.2 MB | 1.4 MB |
| Events in quadrant A | 31,377 | 8,967 |
| Events in quadrant B | 52,831 | 6,691 |
| Events in quadrant C | 31,607 | 8,647 |
| Events in quadrant D | 41,325 | 7,398 |
| Mode M9 | |||
|---|---|---|---|
| Quadrant | BADHDUFLAG | Total packets | Discarded packets |
| A | 0 | 1 | 1 |
| B | 0 | 3 | 3 |
| C | 0 | 1 | 1 |
| D | 0 | 1 | 1 |
| Mode M0 | |||
|---|---|---|---|
| Quadrant | BADHDUFLAG | Total packets | Discarded packets |
| A | 0 | 524 | 380 |
| B | 0 | 945 | 754 |
| C | 0 | 487 | 343 |
| D | 0 | 792 | 628 |
| Mode SS | |||
|---|---|---|---|
| Quadrant | BADHDUFLAG | Total packets | Discarded packets |
| A | 0 | 6 | 4 |
| B | 0 | 5 | 3 |
| C | 0 | 5 | 3 |
| D | 0 | 5 | 3 |
| Quadrant | Total seconds | Saturated seconds | Saturation percentage |
|---|---|---|---|
| A | 72 | 0 | 0.000000% |
| B | 56 | 0 | 0.000000% |
| C | 72 | 0 | 0.000000% |
| D | 63 | 0 | 0.000000% |
Noise dominated data is calculated using 1-second bins in cleaned event files. If a bin has >2000 counts, and if more than 50% of those come from <1% of pixels, then it is considered to be noise-dominated and hence unusable.
| Quadrant | # 1 sec bins | Bins with >0 counts | Bins with >2000 counts | High rate bins dominated by noise | Noise dominated (total time) | Noise dominated (detector-on time) | Marked lightcurve |
|---|---|---|---|---|---|---|---|
| A | 263 | 81 | 0 | 0 | 0.00% | 0.00% | 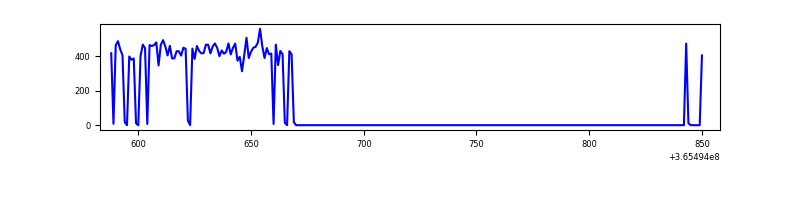 |
| B | 252 | 64 | 0 | 0 | 0.00% | 0.00% | 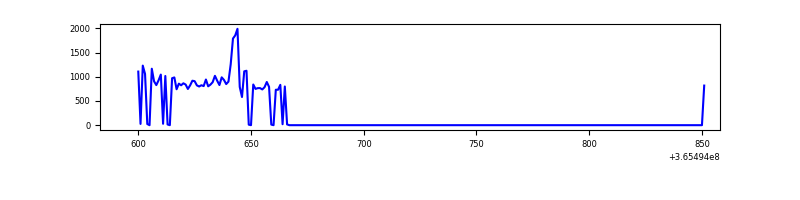 |
| C | 275 | 86 | 0 | 0 | 0.00% | 0.00% | 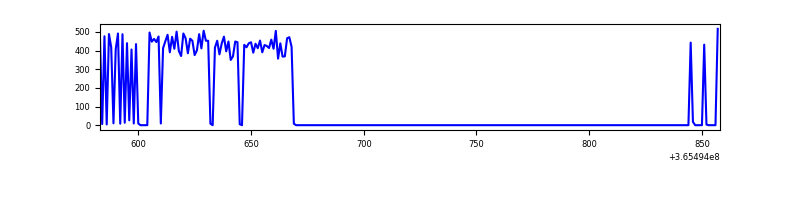 |
| D | 257 | 69 | 0 | 0 | 0.00% | 0.00% | 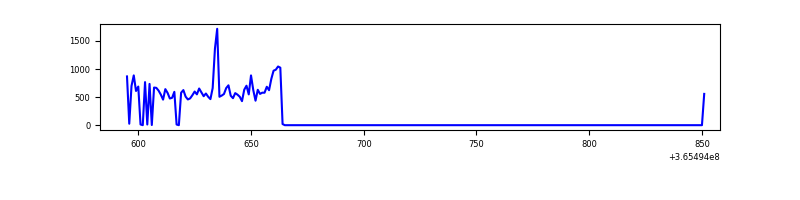 |
Top three noisy pixels from each quadrant. If the there are fewer than three noisy pixels in the level2.evt file, extra rows are filled as -1
| Pixel properties | Quadrant properties | ||||||
|---|---|---|---|---|---|---|---|
| Quadrant | DetID | PixID | Counts | Sigma | Mean | Median | Sigma |
| A | 13 | 254 | 97 | 27.21 | 8 | 8 | 3.3 |
| A | 3 | 137 | 84 | 23.23 | 8 | 8 | 3.3 |
| A | 0 | 226 | 80 | 22.01 | 8 | 8 | 3.3 |
| B | 6 | 159 | 13990 | 5476.54 | 5 | 6 | 2.6 |
| B | 12 | 1 | 8141 | 3185.9 | 5 | 6 | 2.6 |
| B | 4 | 80 | 7349 | 2875.73 | 5 | 6 | 2.6 |
| C | 14 | 238 | 1351 | 412.6 | 7 | 7 | 3.3 |
| C | 2 | 114 | 170 | 50.04 | 7 | 7 | 3.3 |
| C | 4 | 175 | 129 | 37.45 | 7 | 7 | 3.3 |
| D | 8 | 195 | 12459 | 4003.35 | 6 | 6 | 3.1 |
| D | 2 | 250 | 2515 | 806.59 | 6 | 6 | 3.1 |
| D | 10 | 203 | 502 | 159.45 | 6 | 6 | 3.1 |
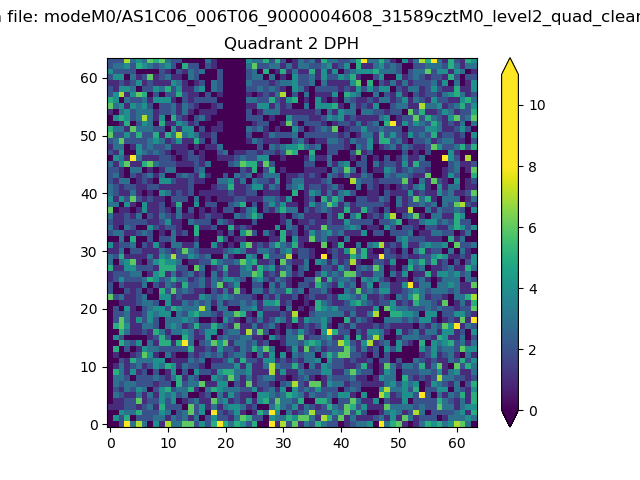
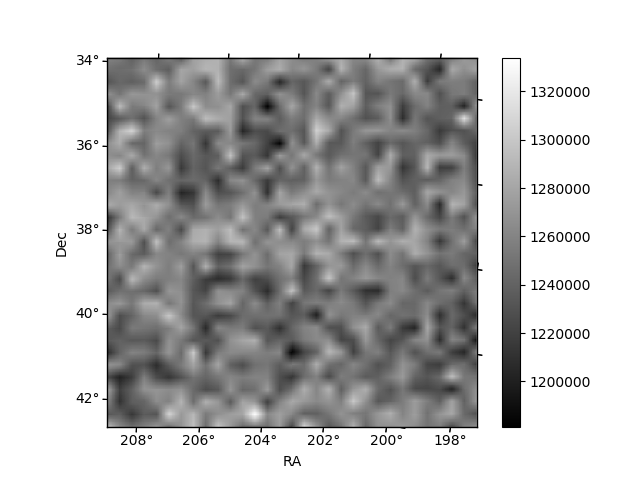
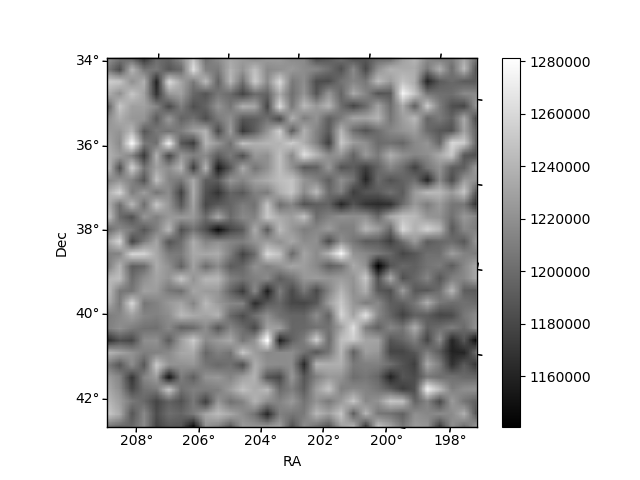
Histogram calculated using DETX and DETY for each event in the final _common_clean file
| Quadrant A | 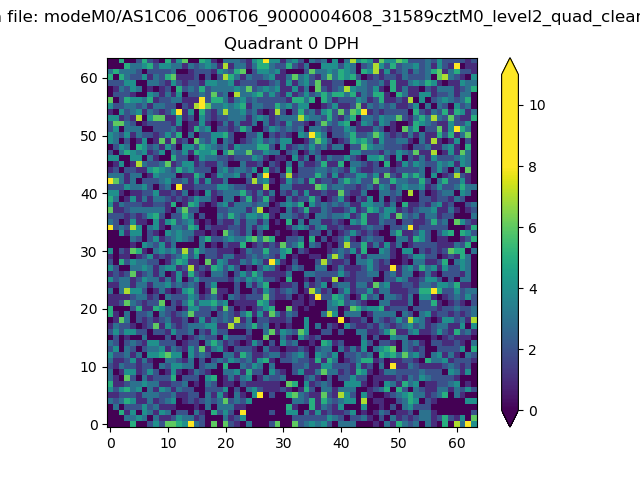 |
 |
Quadrant B |
|---|---|---|---|
| Quadrant D |  |
 |
Quadrant C |
| Plot type | Count rate plots | Images |
|---|---|---|
| Comparison with Poisson distribution Blue bars denote a histogram of data divided into 1 sec bins. Red curve is a Poisson curve with rate = median count rate of data. |
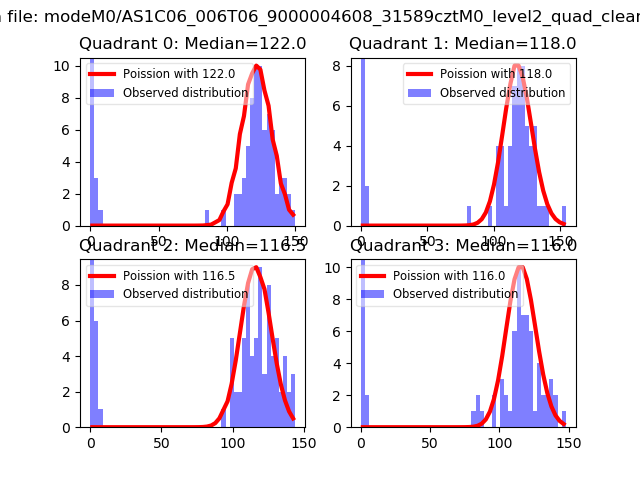 |
 |
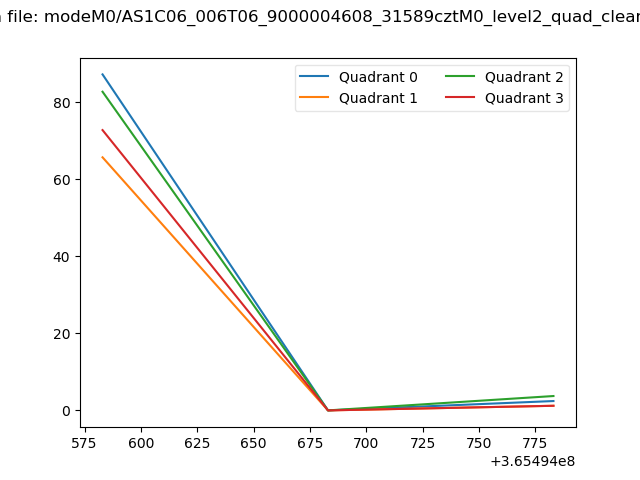
| Quadrant-wise count rates Data is divided into 100 sec bins |
 |
|
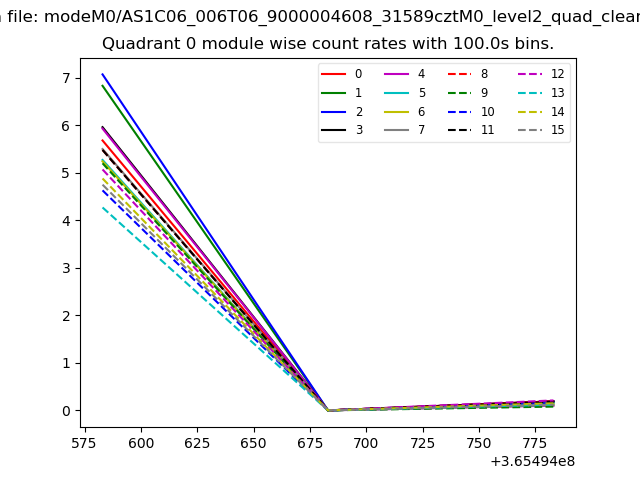
| Module-wise count rates for Quadrant A Data is divided into 100 sec bins |
 |
 |
| Module-wise count rates for Quadrant B Data is divided into 100 sec bins |
 |
 |
| Module-wise count rates for Quadrant C Data is divided into 100 sec bins |
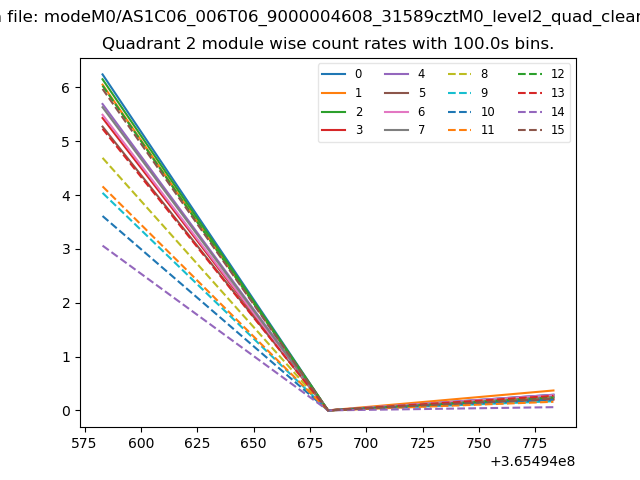 |
 |
| Module-wise count rates for Quadrant D Data is divided into 100 sec bins |
 |
 |
| Parameter | Plot |
|---|---|
| CZT HV Monitor |  |
| D_VDD | 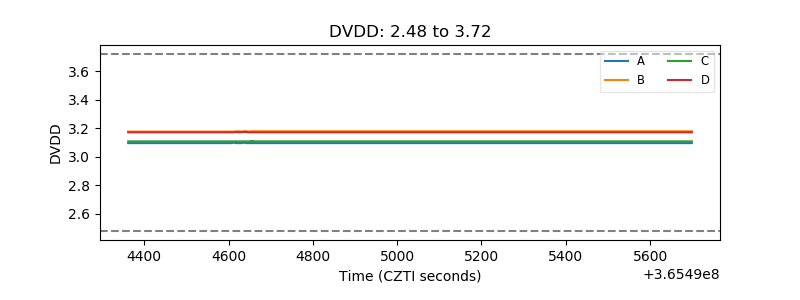 |
| Temperature 1 | 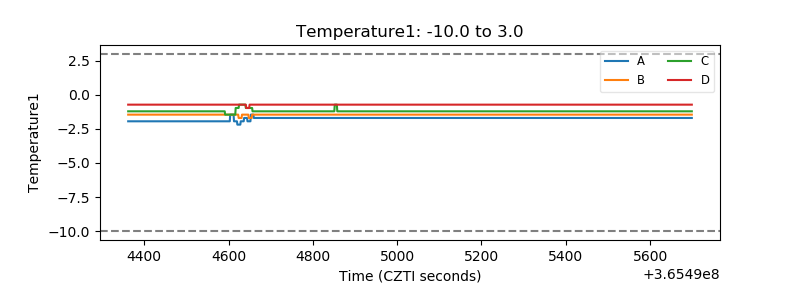 |
| Veto HV Monitor | 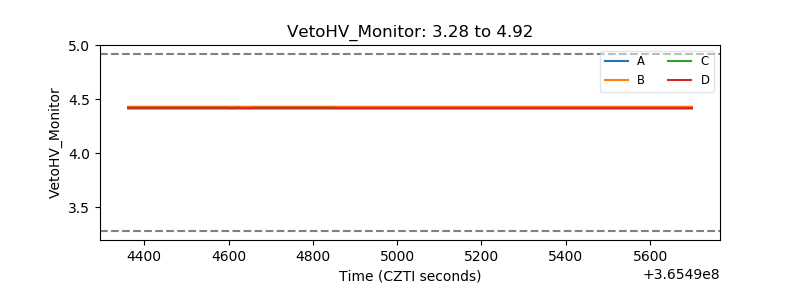 |
| Veto LLD | 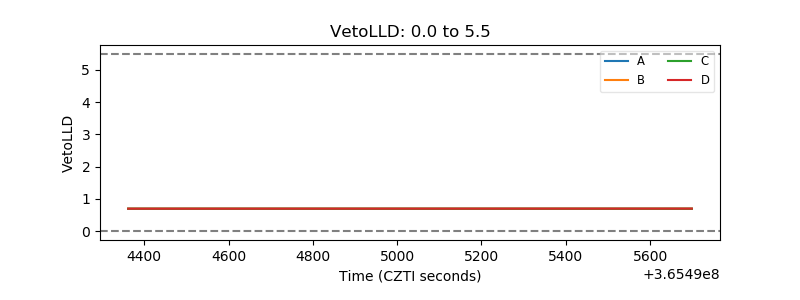 |
| Alpha Counter | 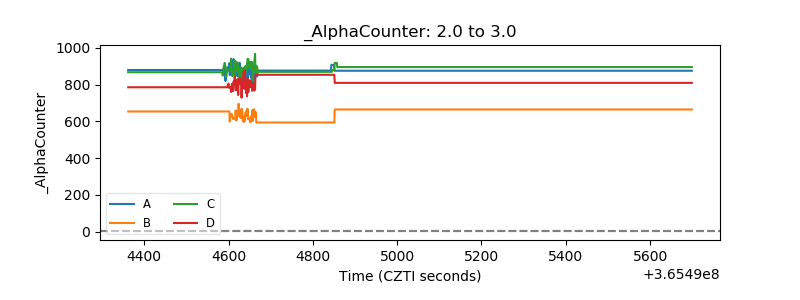 |
| _CPM_Rate | 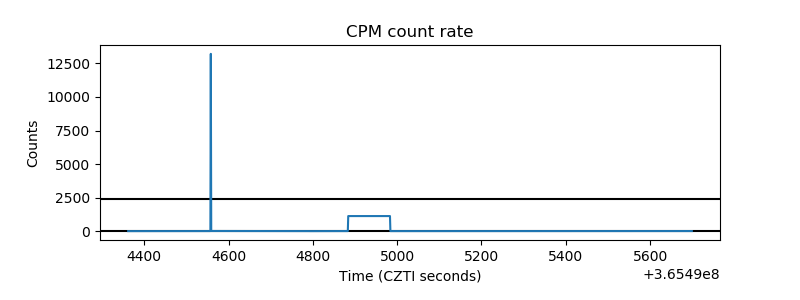 |
| CZT Counter | 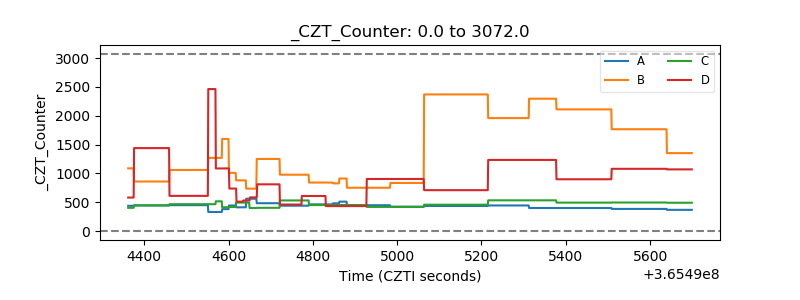 |
| +2.5 Volts monitor |  |
| +5 Volts monitor | 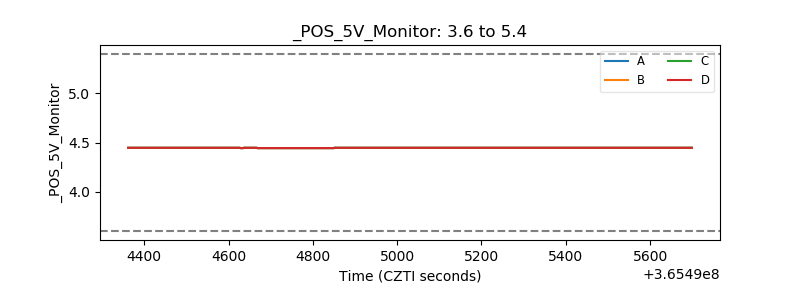 |
| _ROLL_ROT | 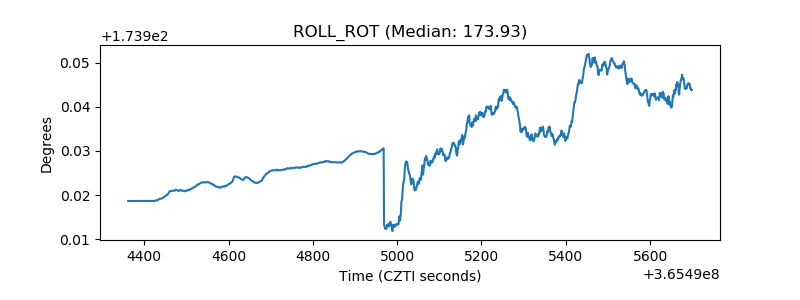 |
| _Roll_DEC | 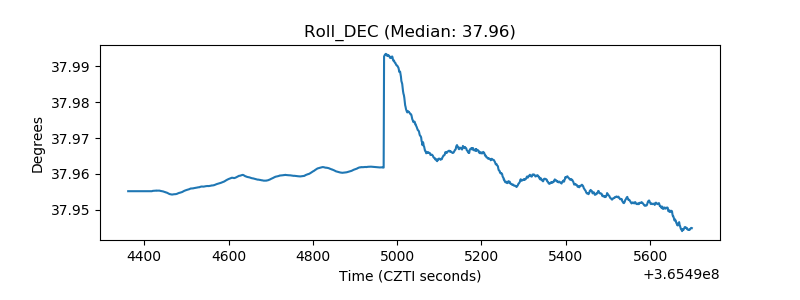 |
| _Roll_RA | 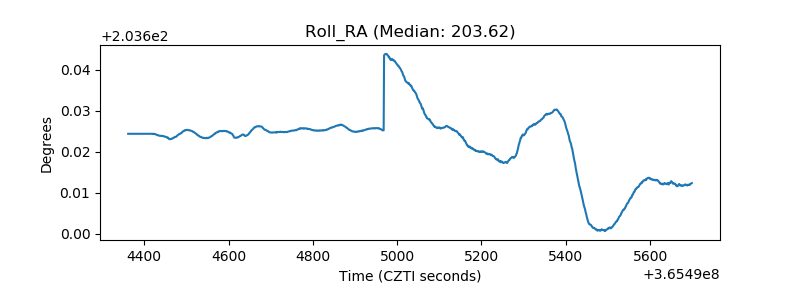 |
| Veto Counter | 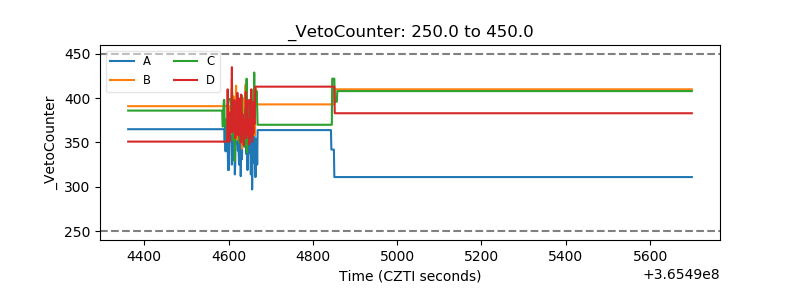 |