| Param | Original file | Final file |
|---|---|---|
| Filename | modeM0/AS1C06_006T06_9000004608_31590cztM0_level2.evt | modeM0/AS1C06_006T06_9000004608_31590cztM0_level2_quad_clean.evt |
| Size (bytes) | 1,377,475,200 | 62,000,640 |
| Size | 1.3 GB | 59.1 MB |
| Events in quadrant A | 6,258,788 | 259,335 |
| Events in quadrant B | 17,045,967 | 210,823 |
| Events in quadrant C | 6,478,606 | 251,015 |
| Events in quadrant D | 11,041,811 | 239,515 |
| Mode M9 | |||
|---|---|---|---|
| Quadrant | BADHDUFLAG | Total packets | Discarded packets |
| A | 0 | 14 | 0 |
| B | 0 | 14 | 0 |
| C | 0 | 14 | 0 |
| D | 0 | 14 | 0 |
| Mode M0 | |||
|---|---|---|---|
| Quadrant | BADHDUFLAG | Total packets | Discarded packets |
| A | 0 | 27365 | 205 |
| B | 0 | 60361 | 671 |
| C | 0 | 27711 | 205 |
| D | 0 | 42173 | 441 |
| Mode SS | |||
|---|---|---|---|
| Quadrant | BADHDUFLAG | Total packets | Discarded packets |
| A | 0 | 271 | 1 |
| B | 0 | 271 | 1 |
| C | 0 | 272 | 2 |
| D | 0 | 272 | 2 |
| Quadrant | Total seconds | Saturated seconds | Saturation percentage |
|---|---|---|---|
| A | 13256 | 200 | 1.508751% |
| B | 13223 | 3272 | 24.744763% |
| C | 13254 | 310 | 2.338917% |
| D | 13234 | 909 | 6.868672% |
Noise dominated data is calculated using 1-second bins in cleaned event files. If a bin has >2000 counts, and if more than 50% of those come from <1% of pixels, then it is considered to be noise-dominated and hence unusable.
| Quadrant | # 1 sec bins | Bins with >0 counts | Bins with >2000 counts | High rate bins dominated by noise | Noise dominated (total time) | Noise dominated (detector-on time) | Marked lightcurve |
|---|---|---|---|---|---|---|---|
| A | 15412 | 13277 | 0 | 0 | 0.00% | 0.00% | 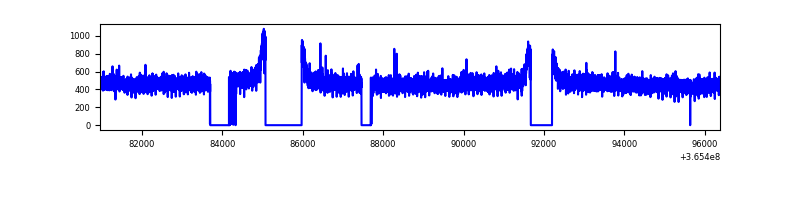 |
| B | 15413 | 13245 | 2367 | 2367 | 15.36% | 17.87% | 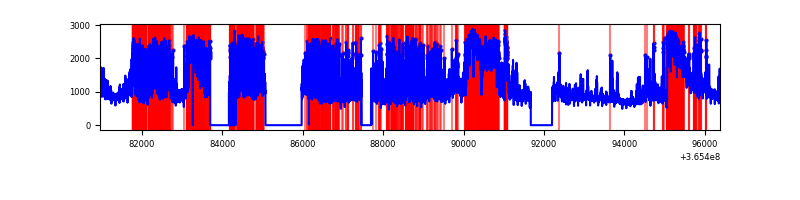 |
| C | 15413 | 13280 | 2 | 2 | 0.01% | 0.02% | 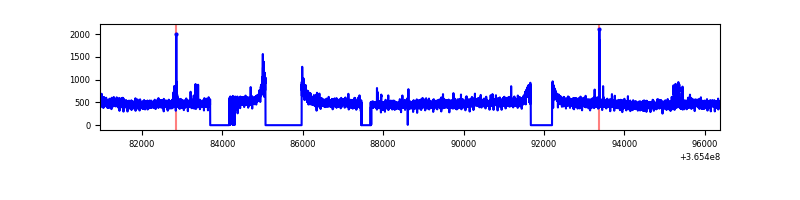 |
| D | 15413 | 13257 | 640 | 640 | 4.15% | 4.83% | 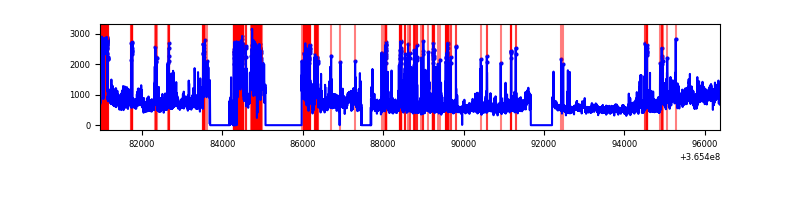 |
Top three noisy pixels from each quadrant. If the there are fewer than three noisy pixels in the level2.evt file, extra rows are filled as -1
| Pixel properties | Quadrant properties | ||||||
|---|---|---|---|---|---|---|---|
| Quadrant | DetID | PixID | Counts | Sigma | Mean | Median | Sigma |
| A | 13 | 254 | 23084 | 66.24 | 1622 | 1588 | 324.5 |
| A | 3 | 137 | 16238 | 45.14 | 1622 | 1588 | 324.5 |
| A | 0 | 226 | 13764 | 37.52 | 1622 | 1588 | 324.5 |
| B | 12 | 1 | 6983034 | 25654.43 | 1446 | 1411 | 272.1 |
| B | 6 | 159 | 3289198 | 12081.19 | 1446 | 1411 | 272.1 |
| B | 4 | 80 | 533207 | 1954.12 | 1446 | 1411 | 272.1 |
| C | 14 | 238 | 262883 | 720.42 | 1548 | 1558 | 362.7 |
| C | 4 | 175 | 65817 | 177.15 | 1548 | 1558 | 362.7 |
| C | 10 | 22 | 37609 | 99.39 | 1548 | 1558 | 362.7 |
| D | 8 | 195 | 2697091 | 7558.65 | 1516 | 1478 | 356.6 |
| D | 12 | 218 | 972871 | 2723.84 | 1516 | 1478 | 356.6 |
| D | 2 | 250 | 573010 | 1602.61 | 1516 | 1478 | 356.6 |
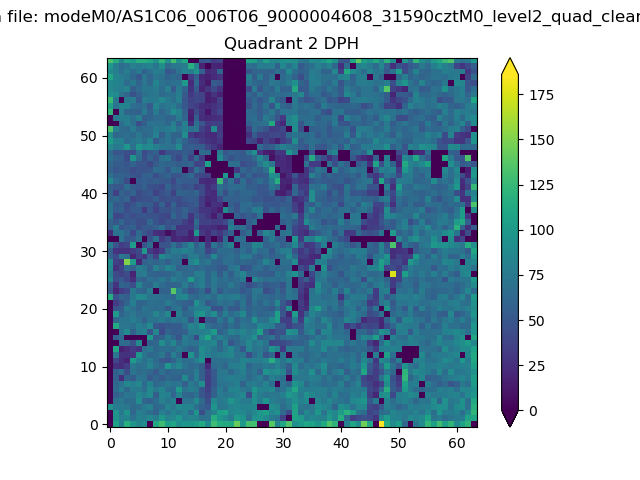
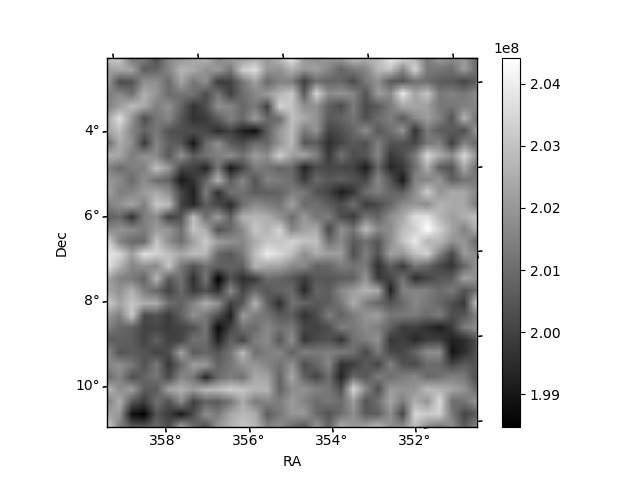
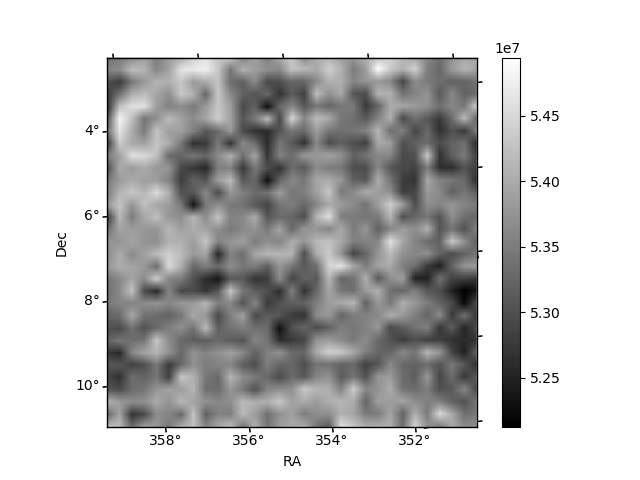
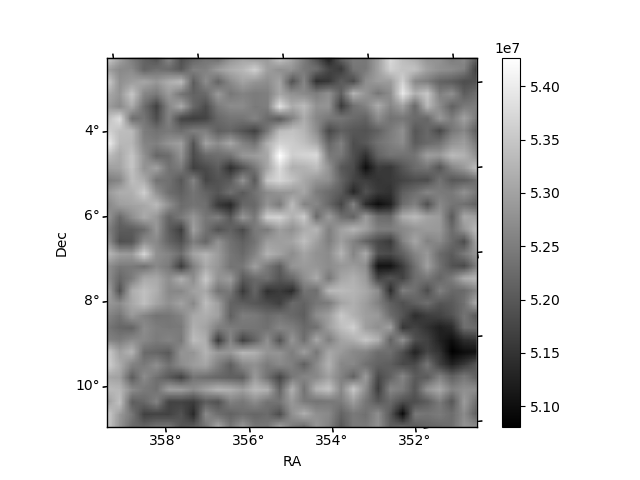
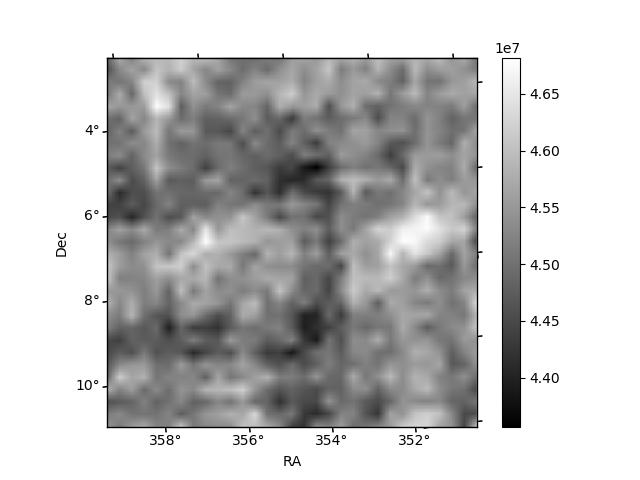
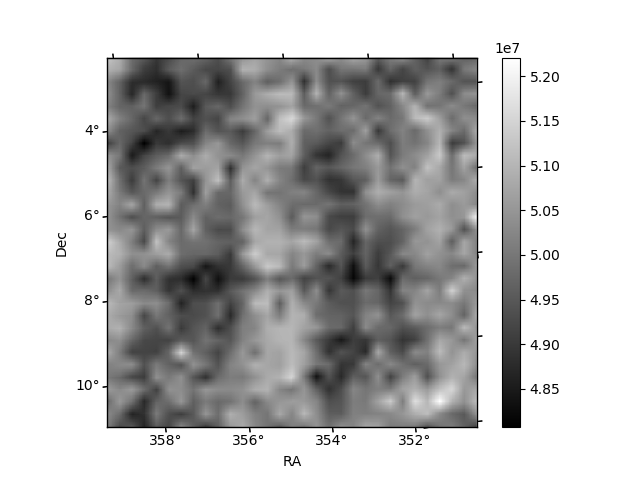
Histogram calculated using DETX and DETY for each event in the final _common_clean file
| Quadrant A | 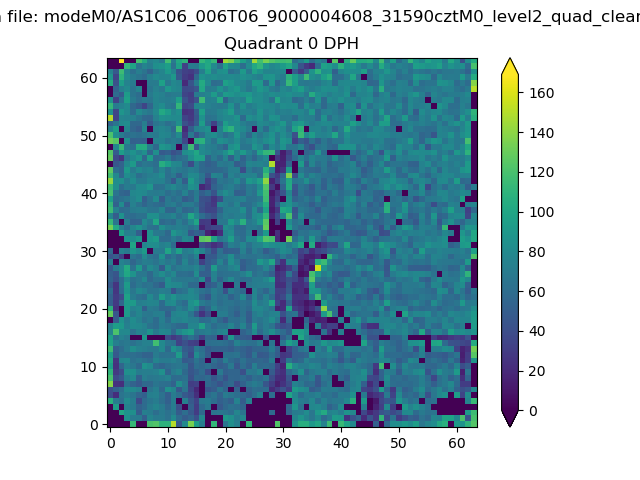 |
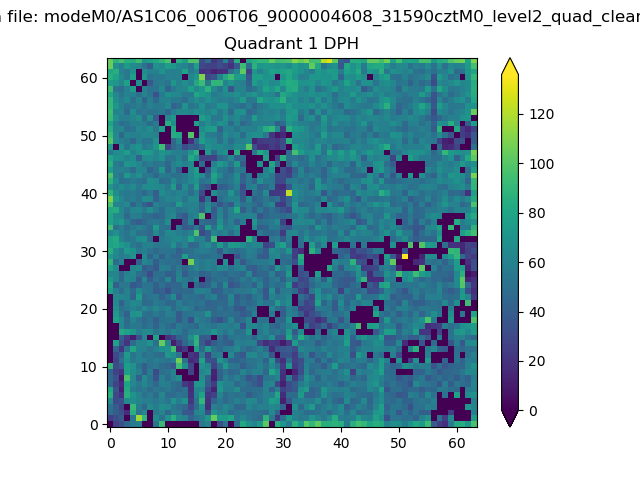 |
Quadrant B |
|---|---|---|---|
| Quadrant D | 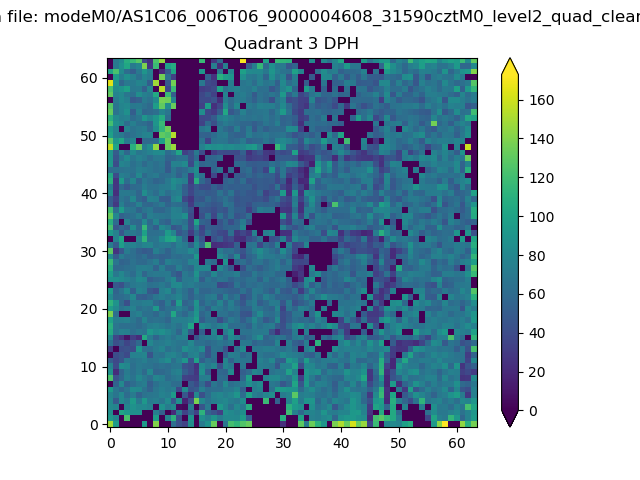 |
 |
Quadrant C |
| Plot type | Count rate plots | Images |
|---|---|---|
| Comparison with Poisson distribution Blue bars denote a histogram of data divided into 1 sec bins. Red curve is a Poisson curve with rate = median count rate of data. |
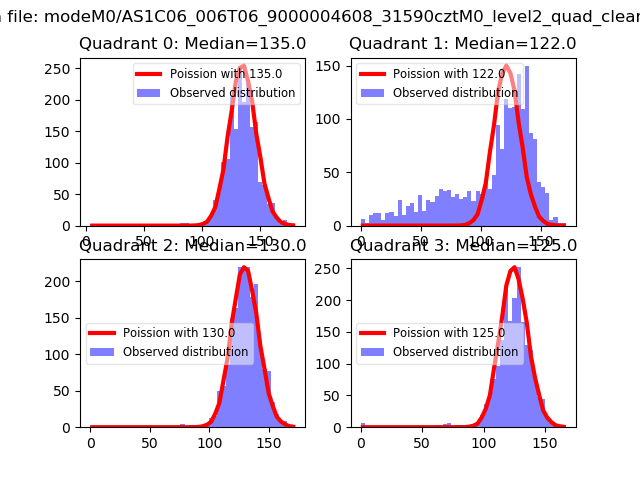 |
 |
| Quadrant-wise count rates Data is divided into 100 sec bins |
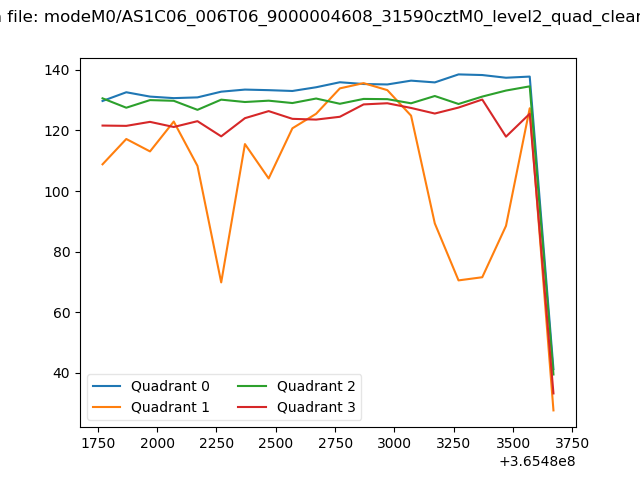 |
|
| Module-wise count rates for Quadrant A Data is divided into 100 sec bins |
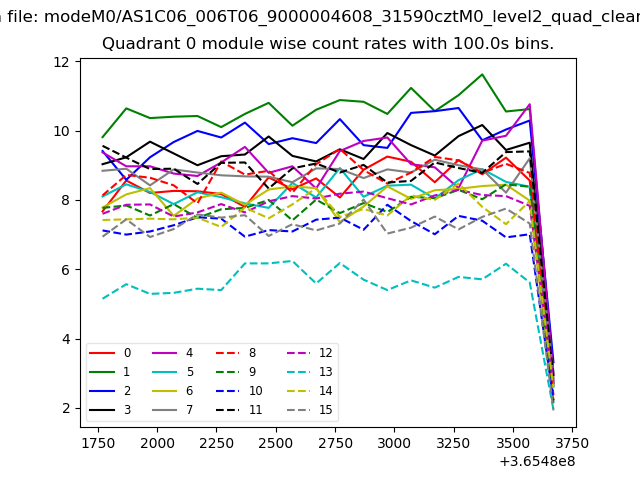 |
 |
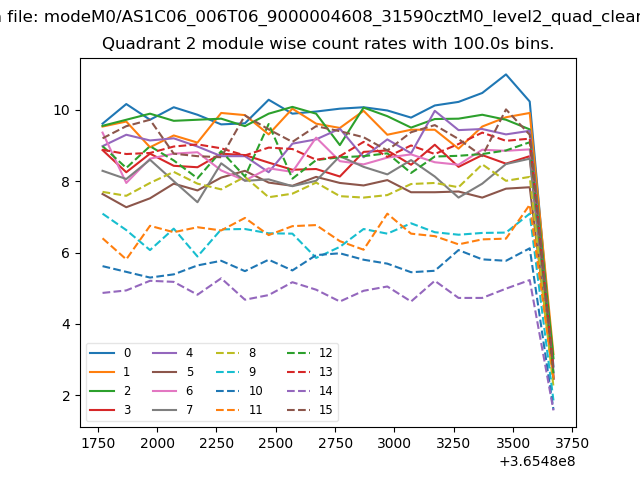
| Module-wise count rates for Quadrant B Data is divided into 100 sec bins |
 |
 |
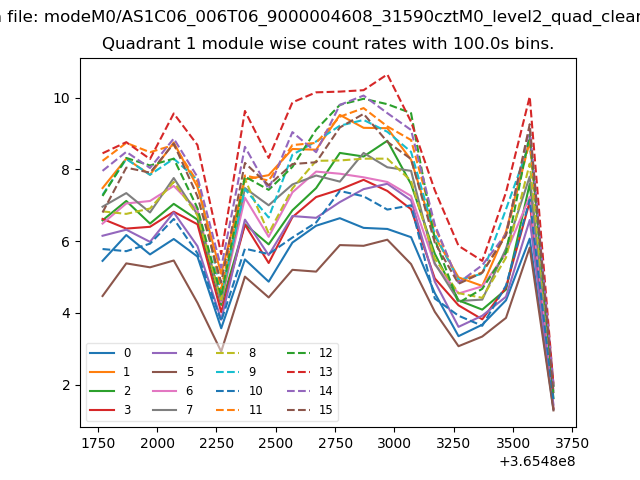
| Module-wise count rates for Quadrant C Data is divided into 100 sec bins |
 |
 |
| Module-wise count rates for Quadrant D Data is divided into 100 sec bins |
 |
 |
| Parameter | Plot |
|---|---|
| CZT HV Monitor | 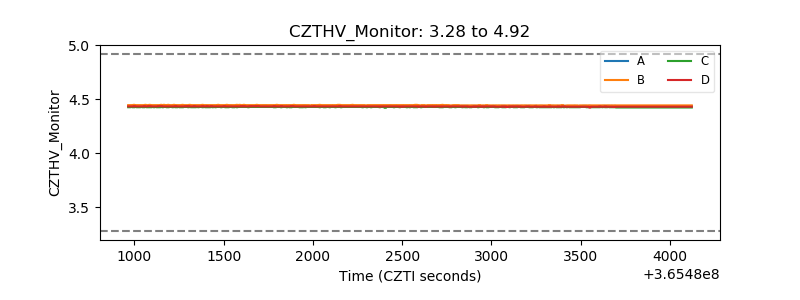 |
| D_VDD | 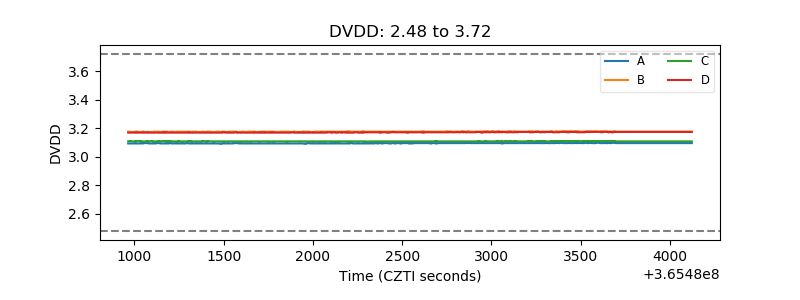 |
| Temperature 1 | 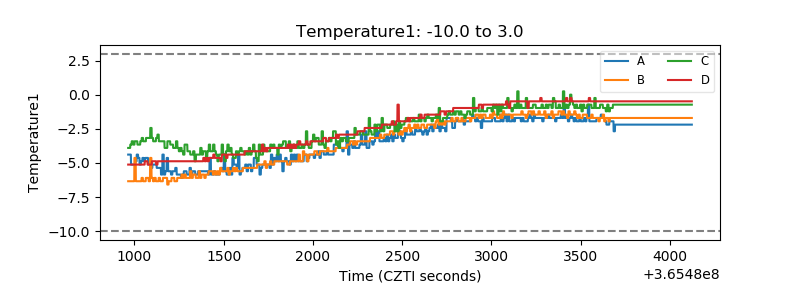 |
| Veto HV Monitor | 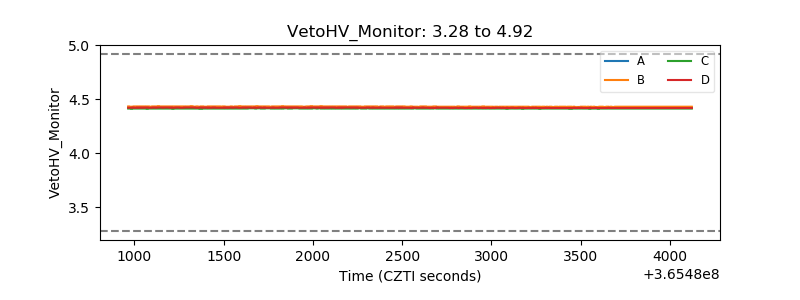 |
| Veto LLD |  |
| Alpha Counter | 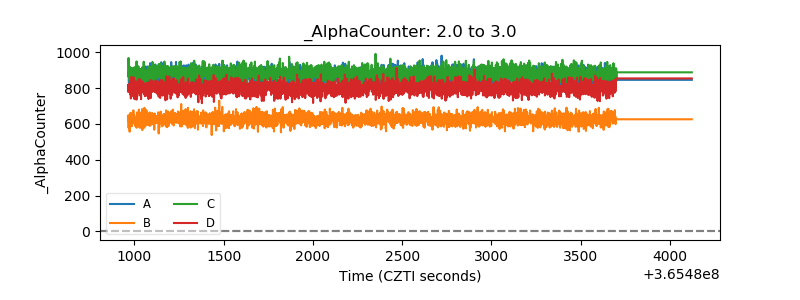 |
| _CPM_Rate | 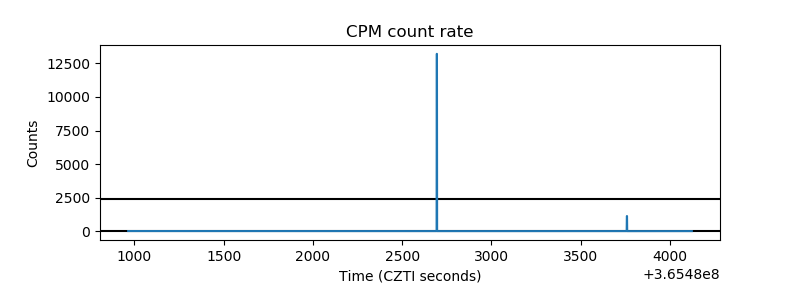 |
| CZT Counter | 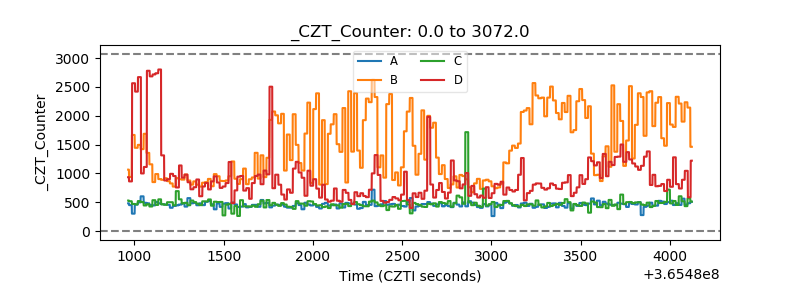 |
| +2.5 Volts monitor |  |
| +5 Volts monitor |  |
| _ROLL_ROT | 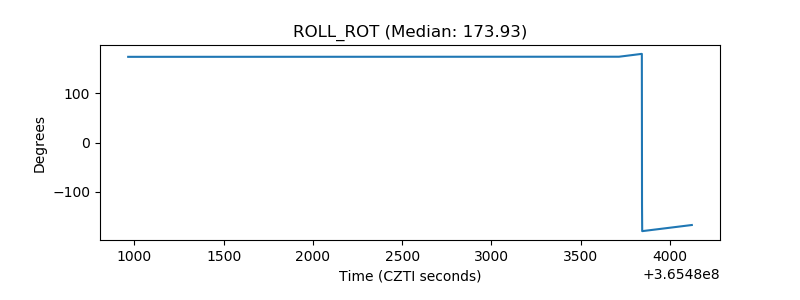 |
| _Roll_DEC | 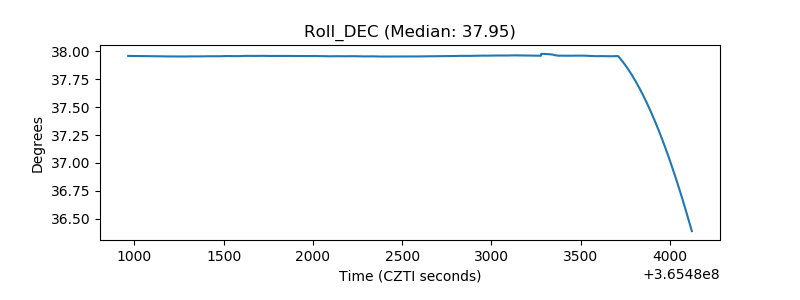 |
| _Roll_RA | 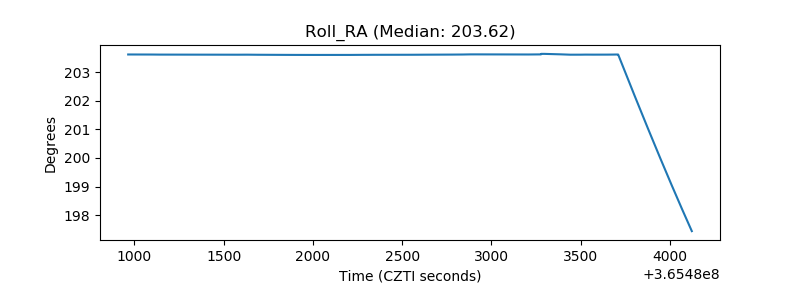 |
| Veto Counter |  |